Wolfram Language
Paclet Repository
Community-contributed installable additions to the Wolfram Language
Primary Navigation
Categories
Cloud & Deployment
Core Language & Structure
Data Manipulation & Analysis
Engineering Data & Computation
External Interfaces & Connections
Financial Data & Computation
Geographic Data & Computation
Geometry
Graphs & Networks
Higher Mathematical Computation
Images
Knowledge Representation & Natural Language
Machine Learning
Notebook Documents & Presentation
Scientific and Medical Data & Computation
Social, Cultural & Linguistic Data
Strings & Text
Symbolic & Numeric Computation
System Operation & Setup
Time-Related Computation
User Interface Construction
Visualization & Graphics
Random Paclet
Alphabetical List
Using Paclets
Create a Paclet
Get Started
Download Definition Notebook
Learn More about
Wolfram Language
TCGADataTool
Guides
TCGA Data Tool
Tech Notes
Custom Entities
Data Exploration
Data Modeling
Data Visualization
Genomic Data
Images Download
Property Standard Name
User Interface
Symbols
buildDesignMatrix
buildModel
cleanRawData
columnHeaderRiskClassSummary
downloadGenomicData
dynamicallyExploreThreshold
exampleDataTCGA
getHistologicalImages
getPotentialPredictors
importGenomicDataFile
inspectPotentialPredictors
modelMeasurementsAtThreshold
overallSurvivalPlot
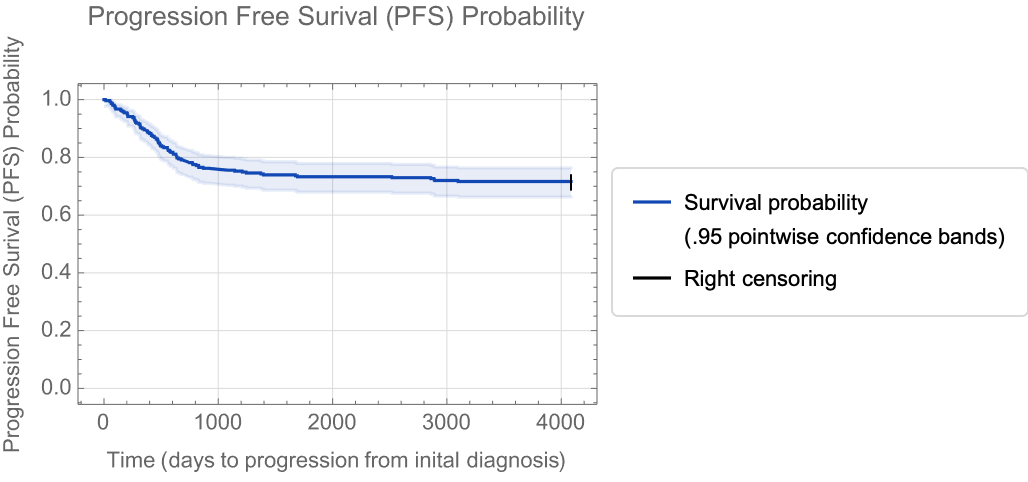
progressionFreeSurvivalPlot
pullDataSlice
radiologicalImagesBatchProcessing
swimmerPlot
TCGADataToolUserInterface
JaneShenGunther`TCGADataTool`
p
r
o
g
r
e
s
s
i
o
n
F
r
e
e
S
u
r
v
i
v
a
l
P
l
o
t
p
r
o
g
r
e
s
s
i
o
n
F
r
e
e
S
u
r
v
i
v
a
l
P
l
o
t
[
d
a
t
a
S
t
r
u
c
t
u
r
e
]
c
a
l
c
u
l
a
t
e
s
a
n
d
p
l
o
t
s
t
h
e
p
r
o
g
r
e
s
s
i
o
n
f
r
e
e
s
u
r
v
i
v
a
l
(
P
F
S
)
p
r
o
b
a
b
i
l
i
t
y
t
h
r
o
u
g
h
t
i
m
e
f
o
r
p
a
t
i
e
n
t
s
i
n
c
l
u
d
e
d
i
n
t
h
e
i
n
p
u
t
d
a
t
a
S
t
r
u
c
t
u
r
e
.
D
e
t
a
i
l
s
a
n
d
O
p
t
i
o
n
s
Examples
(
5
)
Basic Examples
(
1
)
Given the example data structure for project TCGA-CESC:
I
n
[
1
]
:
=
d
a
t
a
S
t
r
u
c
t
u
r
e
=
e
x
a
m
p
l
e
D
a
t
a
T
C
G
A
[
{
"
T
C
G
A
P
r
o
j
e
c
t
D
a
t
a
"
,
"
T
C
G
A
C
E
S
C
E
x
c
e
p
t
G
e
n
o
m
i
c
D
a
t
a
A
l
l
P
a
t
i
e
n
t
s
"
}
,
"
D
a
t
a
"
]
;
Plot the progression free survival rate:
I
n
[
2
]
:
=
p
r
o
g
r
e
s
s
i
o
n
F
r
e
e
S
u
r
v
i
v
a
l
P
l
o
t
[
d
a
t
a
S
t
r
u
c
t
u
r
e
,
I
m
a
g
e
S
i
z
e
3
0
0
]
O
u
t
[
2
]
=
O
p
t
i
o
n
s
(
2
)
P
o
s
s
i
b
l
e
I
s
s
u
e
s
(
1
)
N
e
a
t
E
x
a
m
p
l
e
s
(
1
)
S
e
e
A
l
s
o
o
v
e
r
a
l
l
S
u
r
v
i
v
a
l
P
l
o
t
▪
E
v
e
n
t
D
a
t
a
▪
S
u
r
v
i
v
a
l
M
o
d
e
l
F
i
t
T
e
c
h
N
o
t
e
s
▪
P
r
o
p
e
r
t
y
S
t
a
n
d
a
r
d
N
a
m
e
▪
D
a
t
a
V
i
s
u
a
l
i
z
a
t
i
o
n
R
e
l
a
t
e
d
G
u
i
d
e
s
▪
T
C
G
A
D
a
t
a
T
o
o
l
"
"