Basic Examples (13)
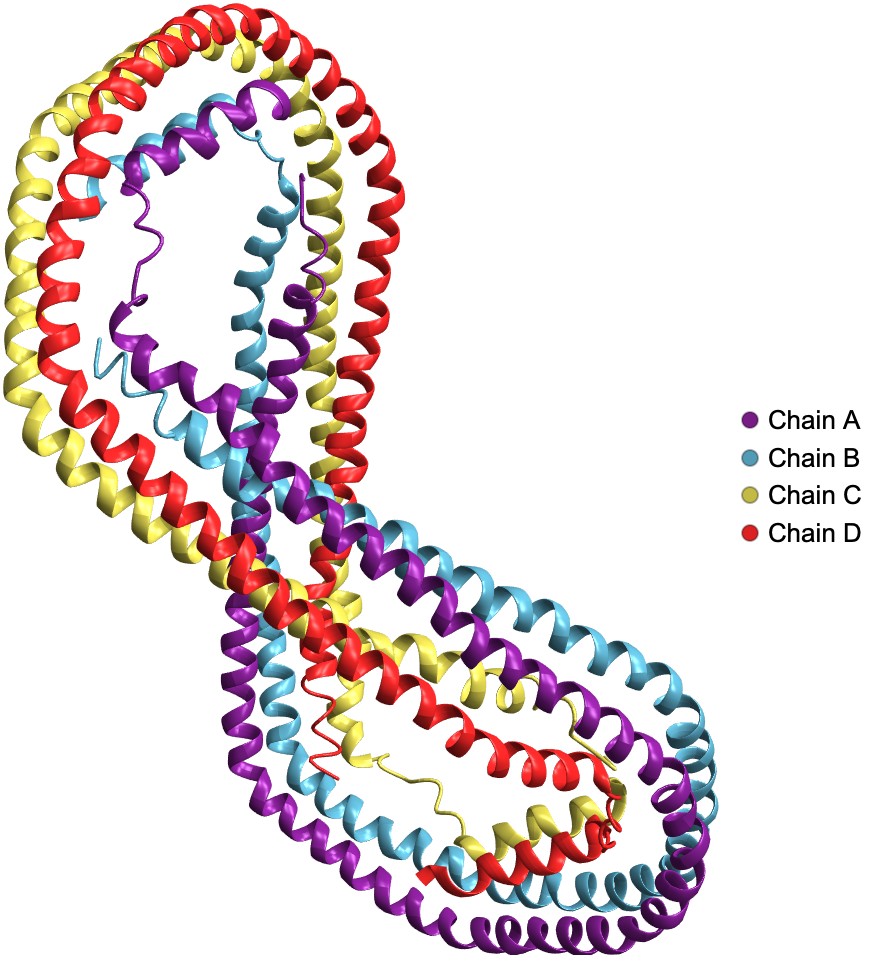
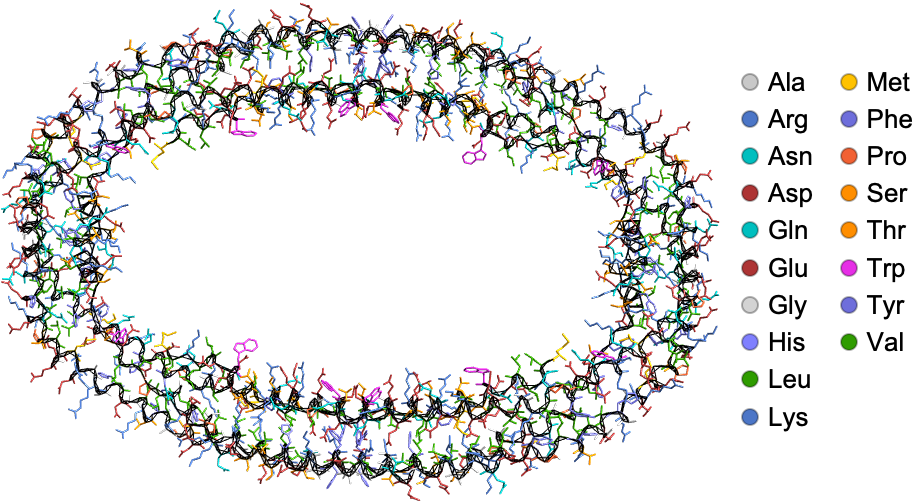
Visualize the ribbon diagram of human Apolipoprotein A-I:
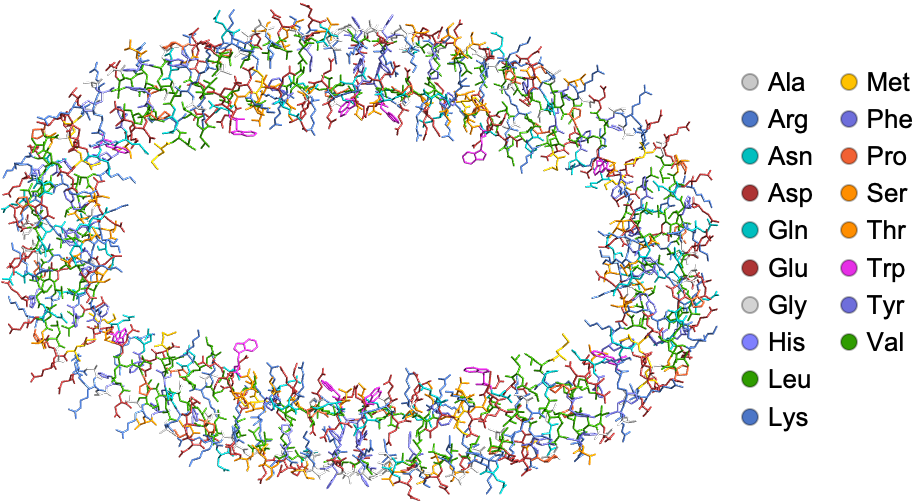
Visualize the backbone atoms of the same structure:
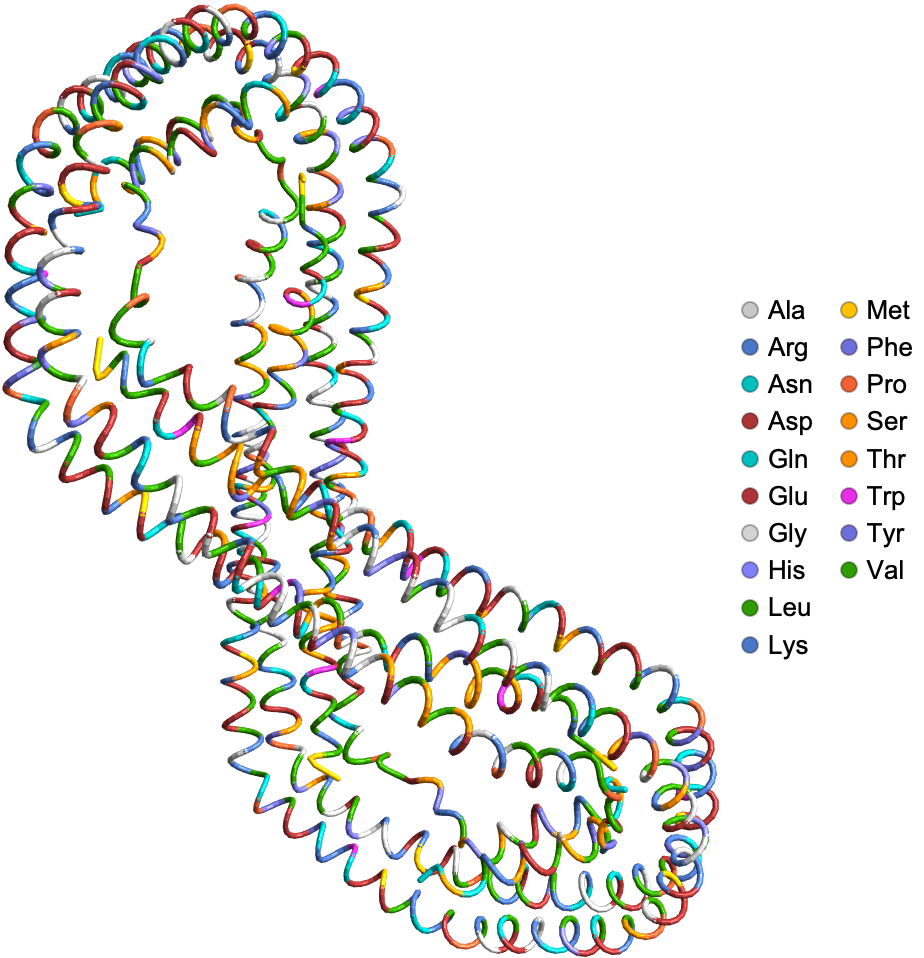
Visualize the α Carbon trace of the protein:
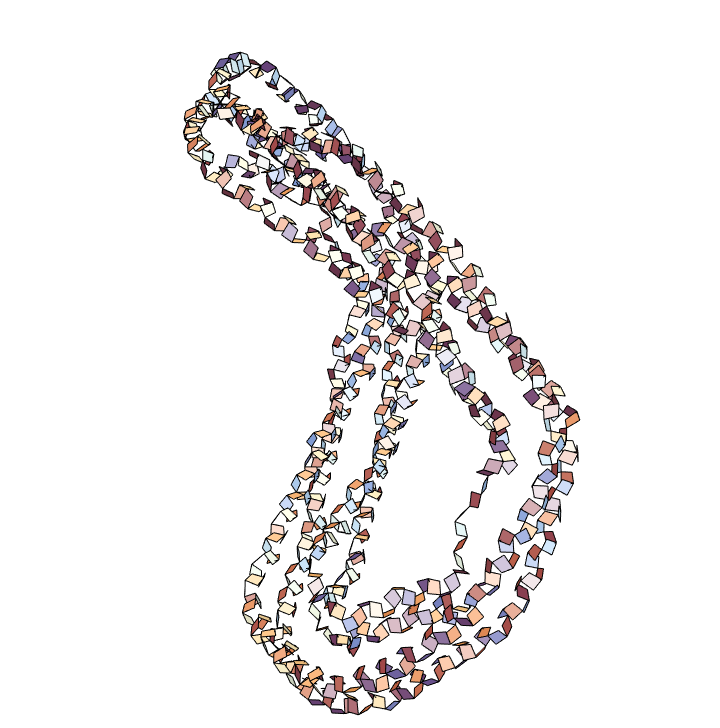
Visualize the amide planes of protein, highlighting the planar geometry of peptide bonds:
Visualize protein backbones (with residue and dihedral angle information) with relevant planes that give rise to dihedral angles ϕ and ψ:
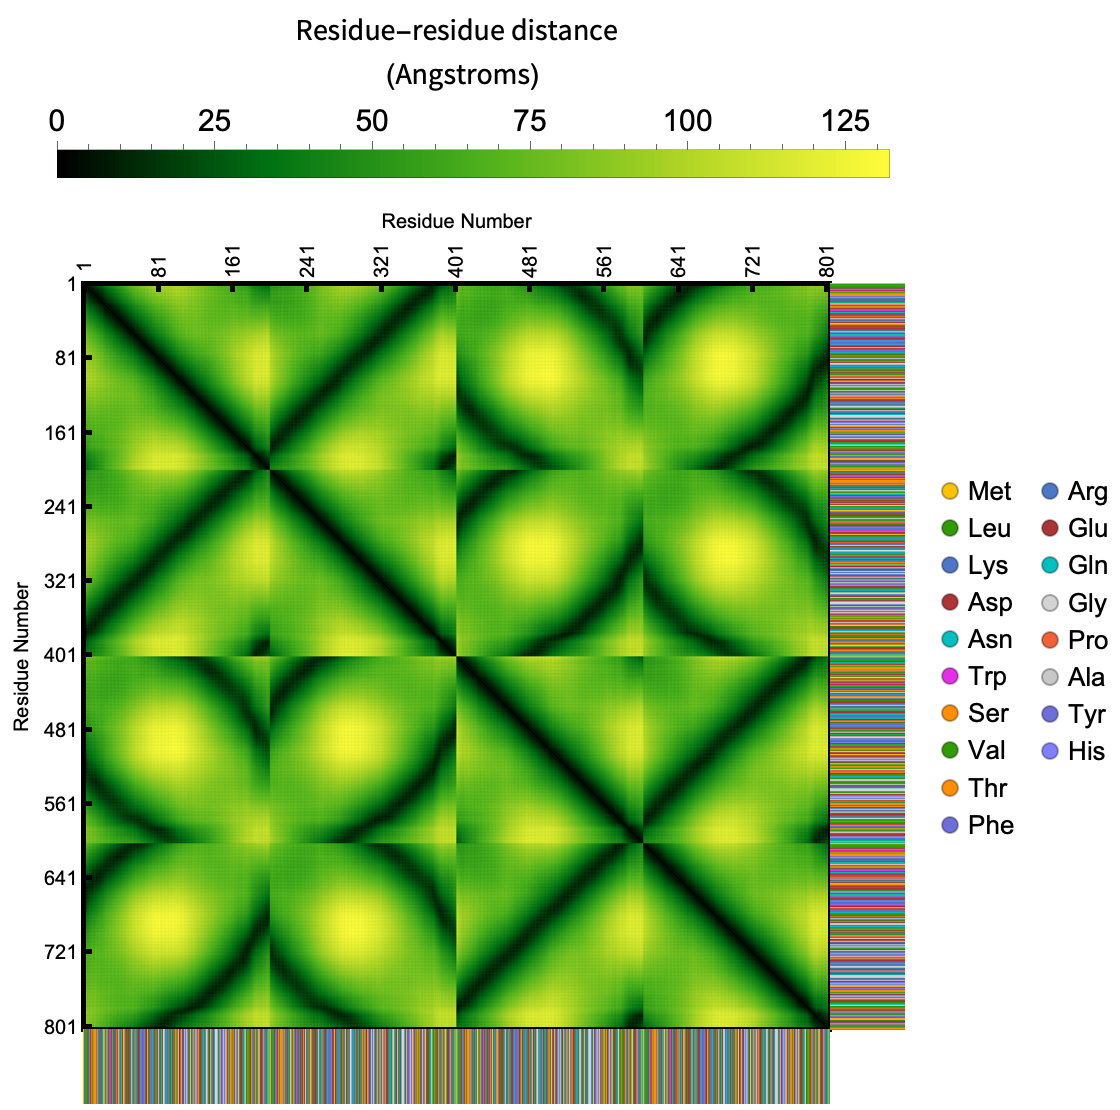
Visualize the contact map of distances between residues in a protein, nucleic acid or protein nucleic acid complexes:
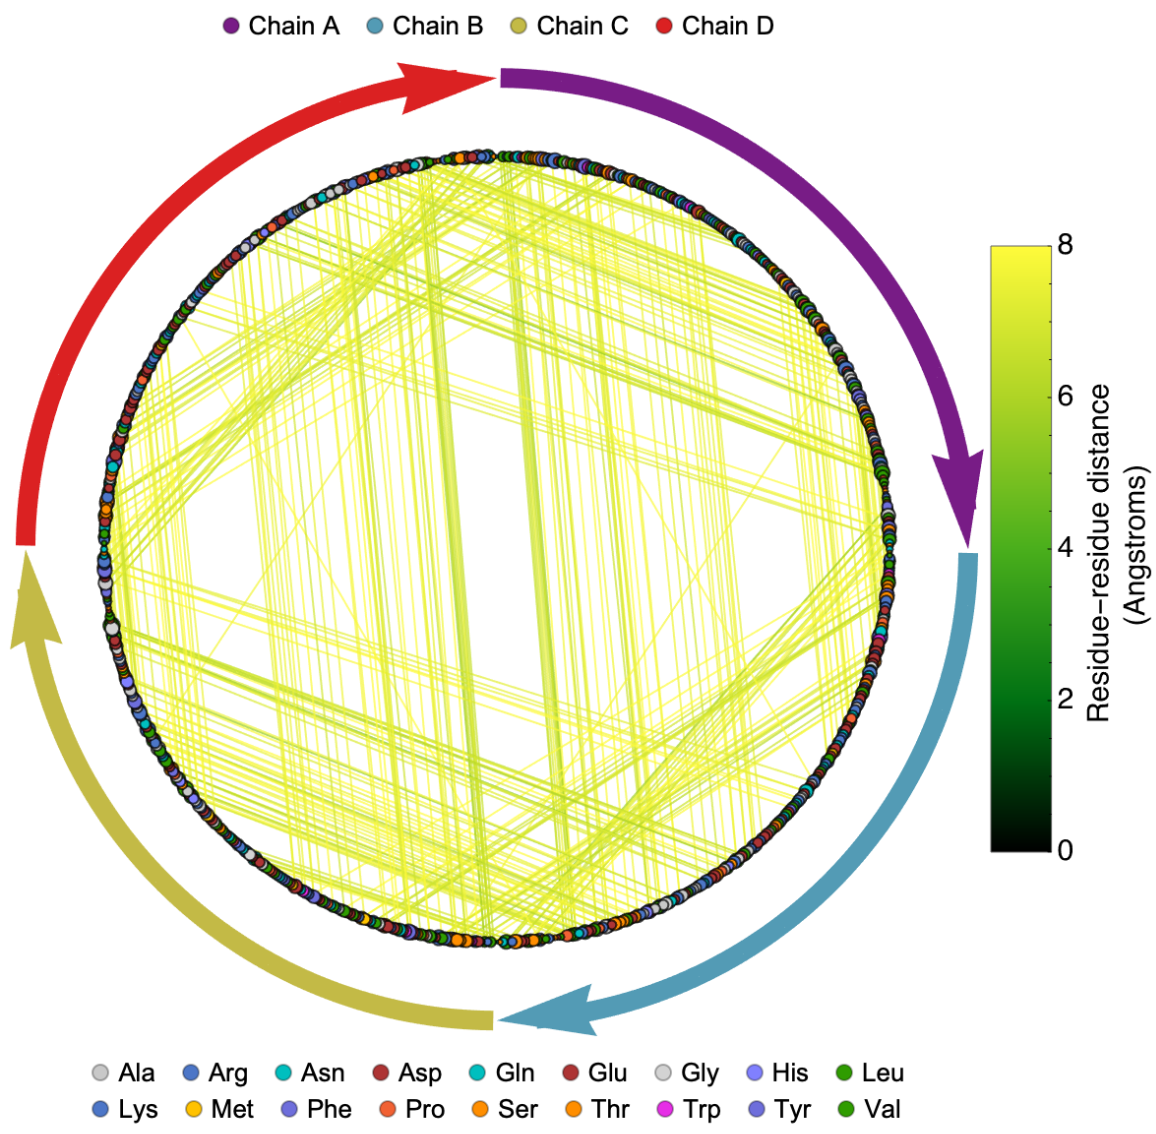
Visualize the contact graph of the protein which is an alternative way of representing the contact map of biomolecule structure:
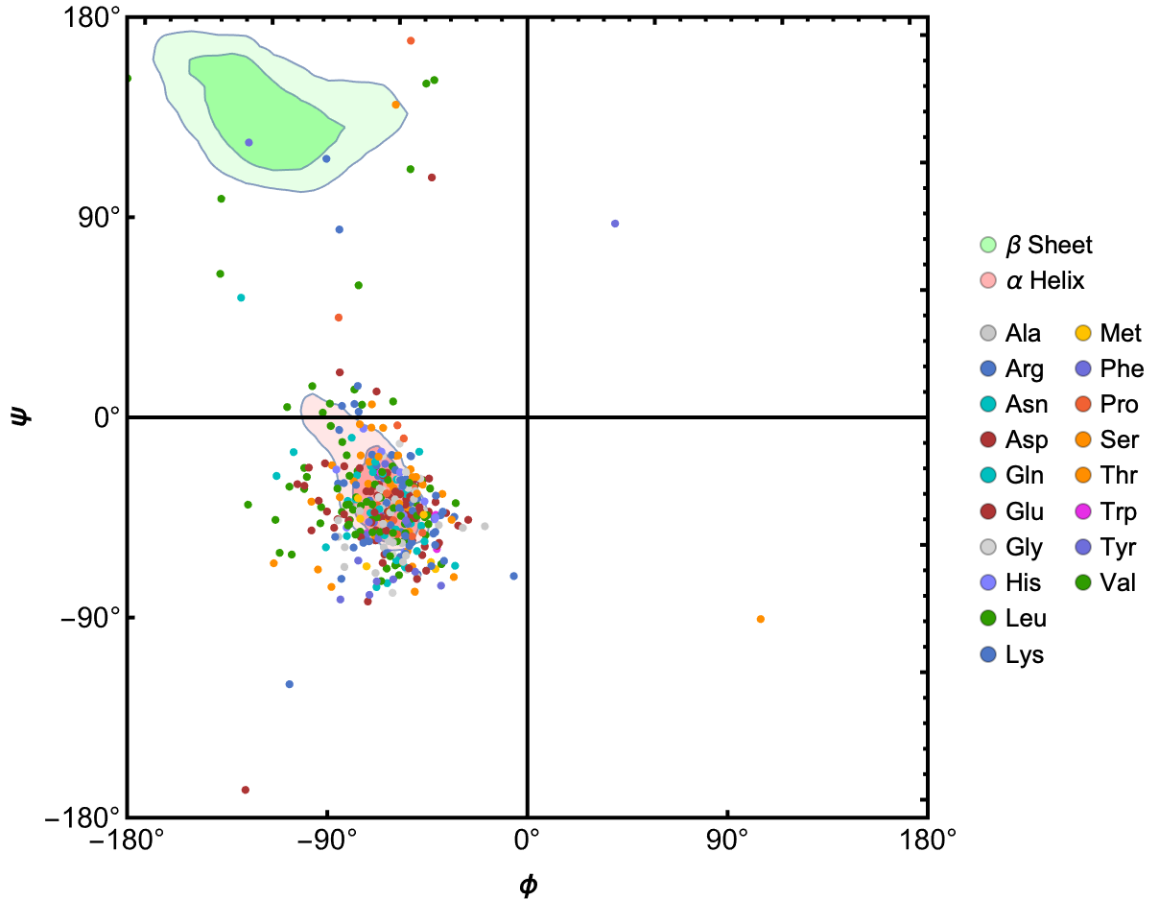
Visualize the Ramachandran plot of the protein:
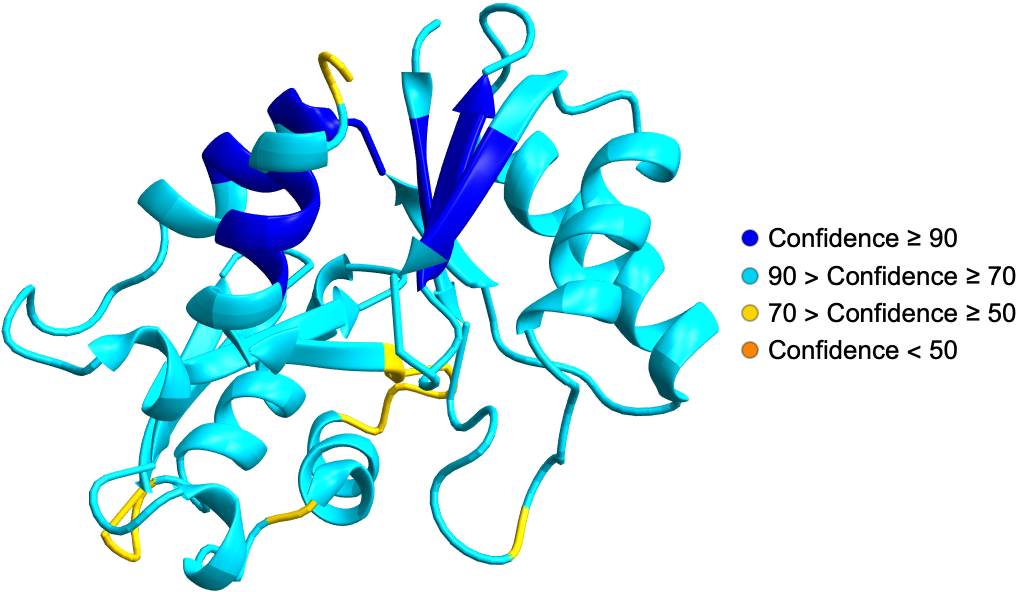
Fold a BioSequence using ESMFold API:
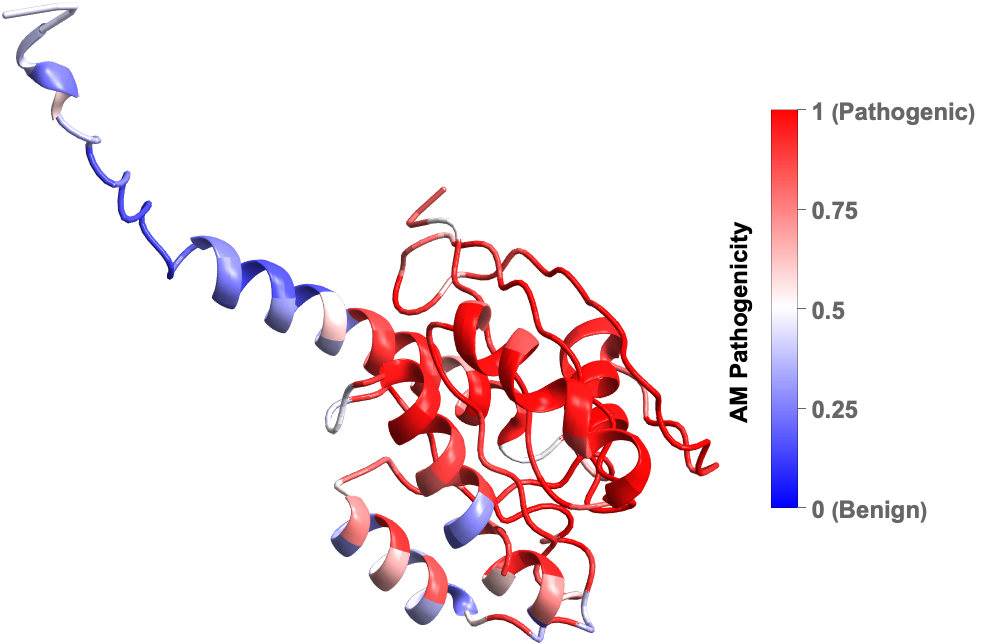
Mutations are changes in the amino acid sequence of proteins that can lead to a wide range of human diseases. AlphaMissense by Google DeepMind is an AI model that has categorized most of the mutations in human proteins and has predicted which ones have a high likelihood of causing disease based on their pathogenicity score. Using their publicly available data we can visualize the effect of single point mutations in human proteins.
MissenseVariantPlot3D gives the 3D structure of a protein where the residues are color coded by its mean or median predicted pathogenicity (by AlphaMissense) due to point mutation. Here is the plot of Human KRAS protein, one the most frequently mutated proteins in cancer:
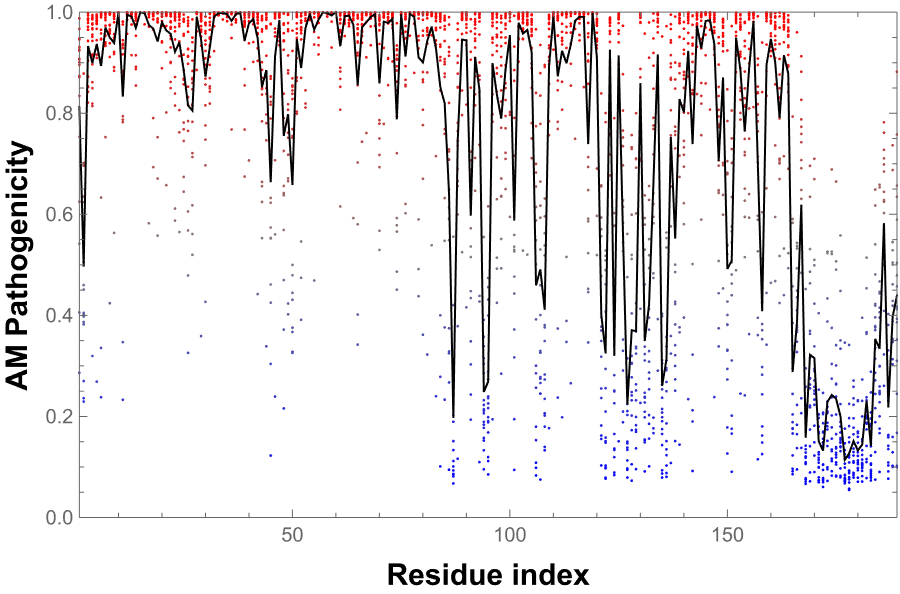
MissenseVariantListPlot gives the ListPlot of the predicted pathogenicity score of a human protein:
MissenseVariantArrayPlot gives the ArrayPlot of the predicted pathogenicity score of a human protein:
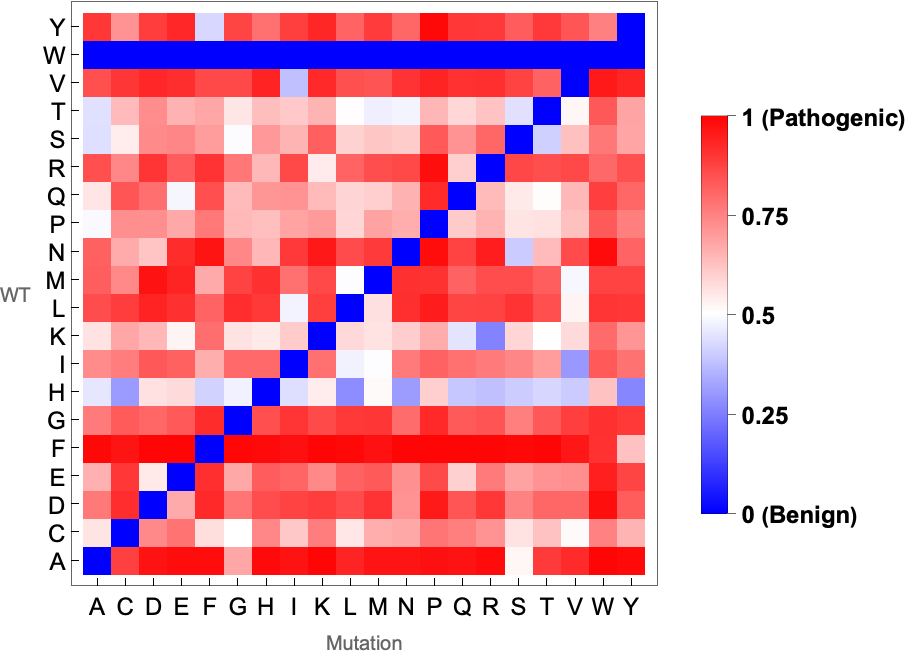
MissenseVariantSubstitutionMatrixPlot gives the plot of the average pathogenicity score of a given pair of amino acid mutation in a protein:

![InterpretationBox[FrameBox[TagBox[TooltipBox[PaneBox[GridBox[List[List[GraphicsBox[List[Thickness[0.0025`], List[FaceForm[List[RGBColor[0.9607843137254902`, 0.5058823529411764`, 0.19607843137254902`], Opacity[1.`]]], FilledCurveBox[List[List[List[0, 2, 0], List[0, 1, 0], List[0, 1, 0], List[0, 1, 0], List[0, 1, 0]], List[List[0, 2, 0], List[0, 1, 0], List[0, 1, 0], List[0, 1, 0], List[0, 1, 0]], List[List[0, 2, 0], List[0, 1, 0], List[0, 1, 0], List[0, 1, 0], List[0, 1, 0], List[0, 1, 0]], List[List[0, 2, 0], List[1, 3, 3], List[0, 1, 0], List[1, 3, 3], List[0, 1, 0], List[1, 3, 3], List[0, 1, 0], List[1, 3, 3], List[1, 3, 3], List[0, 1, 0], List[1, 3, 3], List[0, 1, 0], List[1, 3, 3]]], List[List[List[205.`, 22.863691329956055`], List[205.`, 212.31669425964355`], List[246.01799774169922`, 235.99870109558105`], List[369.0710144042969`, 307.0436840057373`], List[369.0710144042969`, 117.59068870544434`], List[205.`, 22.863691329956055`]], List[List[30.928985595703125`, 307.0436840057373`], List[153.98200225830078`, 235.99870109558105`], List[195.`, 212.31669425964355`], List[195.`, 22.863691329956055`], List[30.928985595703125`, 117.59068870544434`], List[30.928985595703125`, 307.0436840057373`]], List[List[200.`, 410.42970085144043`], List[364.0710144042969`, 315.7036876678467`], List[241.01799774169922`, 244.65868949890137`], List[200.`, 220.97669792175293`], List[158.98200225830078`, 244.65868949890137`], List[35.928985595703125`, 315.7036876678467`], List[200.`, 410.42970085144043`]], List[List[376.5710144042969`, 320.03370475769043`], List[202.5`, 420.53370475769043`], List[200.95300006866455`, 421.42667961120605`], List[199.04699993133545`, 421.42667961120605`], List[197.5`, 420.53370475769043`], List[23.428985595703125`, 320.03370475769043`], List[21.882003784179688`, 319.1406993865967`], List[20.928985595703125`, 317.4896984100342`], List[20.928985595703125`, 315.7036876678467`], List[20.928985595703125`, 114.70369529724121`], List[20.928985595703125`, 112.91769218444824`], List[21.882003784179688`, 111.26669120788574`], List[23.428985595703125`, 110.37369346618652`], List[197.5`, 9.87369155883789`], List[198.27300024032593`, 9.426692008972168`], List[199.13700008392334`, 9.203690528869629`], List[200.`, 9.203690528869629`], List[200.86299991607666`, 9.203690528869629`], List[201.72699999809265`, 9.426692008972168`], List[202.5`, 9.87369155883789`], List[376.5710144042969`, 110.37369346618652`], List[378.1179962158203`, 111.26669120788574`], List[379.0710144042969`, 112.91769218444824`], List[379.0710144042969`, 114.70369529724121`], List[379.0710144042969`, 315.7036876678467`], List[379.0710144042969`, 317.4896984100342`], List[378.1179962158203`, 319.1406993865967`], List[376.5710144042969`, 320.03370475769043`]]]]], List[FaceForm[List[RGBColor[0.5529411764705883`, 0.6745098039215687`, 0.8117647058823529`], Opacity[1.`]]], FilledCurveBox[List[List[List[0, 2, 0], List[0, 1, 0], List[0, 1, 0], List[0, 1, 0]]], List[List[List[44.92900085449219`, 282.59088134765625`], List[181.00001525878906`, 204.0298843383789`], List[181.00001525878906`, 46.90887451171875`], List[44.92900085449219`, 125.46986389160156`], List[44.92900085449219`, 282.59088134765625`]]]]], List[FaceForm[List[RGBColor[0.6627450980392157`, 0.803921568627451`, 0.5686274509803921`], Opacity[1.`]]], FilledCurveBox[List[List[List[0, 2, 0], List[0, 1, 0], List[0, 1, 0], List[0, 1, 0]]], List[List[List[355.0710144042969`, 282.59088134765625`], List[355.0710144042969`, 125.46986389160156`], List[219.`, 46.90887451171875`], List[219.`, 204.0298843383789`], List[355.0710144042969`, 282.59088134765625`]]]]], List[FaceForm[List[RGBColor[0.6901960784313725`, 0.5882352941176471`, 0.8117647058823529`], Opacity[1.`]]], FilledCurveBox[List[List[List[0, 2, 0], List[0, 1, 0], List[0, 1, 0], List[0, 1, 0]]], List[List[List[200.`, 394.0606994628906`], List[336.0710144042969`, 315.4997024536133`], List[200.`, 236.93968200683594`], List[63.928985595703125`, 315.4997024536133`], List[200.`, 394.0606994628906`]]]]]], List[Rule[BaselinePosition, Scaled[0.15`]], Rule[ImageSize, 10], Rule[ImageSize, 15]]], StyleBox[RowBox[List["ProteinContactGraphPlot", " "]], Rule[ShowAutoStyles, False], Rule[ShowStringCharacters, False], Rule[FontSize, Times[0.9`, Inherited]], Rule[FontColor, GrayLevel[0.1`]]]]], Rule[GridBoxSpacings, List[Rule["Columns", List[List[0.25`]]]]]], Rule[Alignment, List[Left, Baseline]], Rule[BaselinePosition, Baseline], Rule[FrameMargins, List[List[3, 0], List[0, 0]]], Rule[BaseStyle, List[Rule[LineSpacing, List[0, 0]], Rule[LineBreakWithin, False]]]], RowBox[List["PacletSymbol", "[", RowBox[List["\"WolframChemistry/ProteinVisualization\"", ",", "\"WolframChemistry`ProteinVisualization`ProteinContactGraphPlot\""]], "]"]], Rule[TooltipStyle, List[Rule[ShowAutoStyles, True], Rule[ShowStringCharacters, True]]]], Function[Annotation[Slot[1], Style[Defer[PacletSymbol["WolframChemistry/ProteinVisualization", "WolframChemistry`ProteinVisualization`ProteinContactGraphPlot"]], Rule[ShowStringCharacters, True]], "Tooltip"]]], Rule[Background, RGBColor[0.968`, 0.976`, 0.984`]], Rule[BaselinePosition, Baseline], Rule[DefaultBaseStyle, List[]], Rule[FrameMargins, List[List[0, 0], List[1, 1]]], Rule[FrameStyle, RGBColor[0.831`, 0.847`, 0.85`]], Rule[RoundingRadius, 4]], PacletSymbol["WolframChemistry/ProteinVisualization", "WolframChemistry`ProteinVisualization`ProteinContactGraphPlot"], Rule[Selectable, False], Rule[SelectWithContents, True], Rule[BoxID, "PacletSymbolBox"]][protein, "CutOff" -> Quantity[8, "Angstroms"], "ScaledVertexSize" -> True, "EdgeColorFunction" -> True, ImageSize -> 500,
VertexSize -> 10]](https://www.wolframcloud.com/obj/resourcesystem/images/27c/27c9f769-ed76-4469-a91d-3134e486c891/006af6005df0fa33.png)
![InterpretationBox[FrameBox[TagBox[TooltipBox[PaneBox[GridBox[List[List[GraphicsBox[List[Thickness[0.0025`], List[FaceForm[List[RGBColor[0.9607843137254902`, 0.5058823529411764`, 0.19607843137254902`], Opacity[1.`]]], FilledCurveBox[List[List[List[0, 2, 0], List[0, 1, 0], List[0, 1, 0], List[0, 1, 0], List[0, 1, 0]], List[List[0, 2, 0], List[0, 1, 0], List[0, 1, 0], List[0, 1, 0], List[0, 1, 0]], List[List[0, 2, 0], List[0, 1, 0], List[0, 1, 0], List[0, 1, 0], List[0, 1, 0], List[0, 1, 0]], List[List[0, 2, 0], List[1, 3, 3], List[0, 1, 0], List[1, 3, 3], List[0, 1, 0], List[1, 3, 3], List[0, 1, 0], List[1, 3, 3], List[1, 3, 3], List[0, 1, 0], List[1, 3, 3], List[0, 1, 0], List[1, 3, 3]]], List[List[List[205.`, 22.863691329956055`], List[205.`, 212.31669425964355`], List[246.01799774169922`, 235.99870109558105`], List[369.0710144042969`, 307.0436840057373`], List[369.0710144042969`, 117.59068870544434`], List[205.`, 22.863691329956055`]], List[List[30.928985595703125`, 307.0436840057373`], List[153.98200225830078`, 235.99870109558105`], List[195.`, 212.31669425964355`], List[195.`, 22.863691329956055`], List[30.928985595703125`, 117.59068870544434`], List[30.928985595703125`, 307.0436840057373`]], List[List[200.`, 410.42970085144043`], List[364.0710144042969`, 315.7036876678467`], List[241.01799774169922`, 244.65868949890137`], List[200.`, 220.97669792175293`], List[158.98200225830078`, 244.65868949890137`], List[35.928985595703125`, 315.7036876678467`], List[200.`, 410.42970085144043`]], List[List[376.5710144042969`, 320.03370475769043`], List[202.5`, 420.53370475769043`], List[200.95300006866455`, 421.42667961120605`], List[199.04699993133545`, 421.42667961120605`], List[197.5`, 420.53370475769043`], List[23.428985595703125`, 320.03370475769043`], List[21.882003784179688`, 319.1406993865967`], List[20.928985595703125`, 317.4896984100342`], List[20.928985595703125`, 315.7036876678467`], List[20.928985595703125`, 114.70369529724121`], List[20.928985595703125`, 112.91769218444824`], List[21.882003784179688`, 111.26669120788574`], List[23.428985595703125`, 110.37369346618652`], List[197.5`, 9.87369155883789`], List[198.27300024032593`, 9.426692008972168`], List[199.13700008392334`, 9.203690528869629`], List[200.`, 9.203690528869629`], List[200.86299991607666`, 9.203690528869629`], List[201.72699999809265`, 9.426692008972168`], List[202.5`, 9.87369155883789`], List[376.5710144042969`, 110.37369346618652`], List[378.1179962158203`, 111.26669120788574`], List[379.0710144042969`, 112.91769218444824`], List[379.0710144042969`, 114.70369529724121`], List[379.0710144042969`, 315.7036876678467`], List[379.0710144042969`, 317.4896984100342`], List[378.1179962158203`, 319.1406993865967`], List[376.5710144042969`, 320.03370475769043`]]]]], List[FaceForm[List[RGBColor[0.5529411764705883`, 0.6745098039215687`, 0.8117647058823529`], Opacity[1.`]]], FilledCurveBox[List[List[List[0, 2, 0], List[0, 1, 0], List[0, 1, 0], List[0, 1, 0]]], List[List[List[44.92900085449219`, 282.59088134765625`], List[181.00001525878906`, 204.0298843383789`], List[181.00001525878906`, 46.90887451171875`], List[44.92900085449219`, 125.46986389160156`], List[44.92900085449219`, 282.59088134765625`]]]]], List[FaceForm[List[RGBColor[0.6627450980392157`, 0.803921568627451`, 0.5686274509803921`], Opacity[1.`]]], FilledCurveBox[List[List[List[0, 2, 0], List[0, 1, 0], List[0, 1, 0], List[0, 1, 0]]], List[List[List[355.0710144042969`, 282.59088134765625`], List[355.0710144042969`, 125.46986389160156`], List[219.`, 46.90887451171875`], List[219.`, 204.0298843383789`], List[355.0710144042969`, 282.59088134765625`]]]]], List[FaceForm[List[RGBColor[0.6901960784313725`, 0.5882352941176471`, 0.8117647058823529`], Opacity[1.`]]], FilledCurveBox[List[List[List[0, 2, 0], List[0, 1, 0], List[0, 1, 0], List[0, 1, 0]]], List[List[List[200.`, 394.0606994628906`], List[336.0710144042969`, 315.4997024536133`], List[200.`, 236.93968200683594`], List[63.928985595703125`, 315.4997024536133`], List[200.`, 394.0606994628906`]]]]]], List[Rule[BaselinePosition, Scaled[0.15`]], Rule[ImageSize, 10], Rule[ImageSize, 15]]], StyleBox[RowBox[List["BiomoleculePlot3D", " "]], Rule[ShowAutoStyles, False], Rule[ShowStringCharacters, False], Rule[FontSize, Times[0.9`, Inherited]], Rule[FontColor, GrayLevel[0.1`]]]]], Rule[GridBoxSpacings, List[Rule["Columns", List[List[0.25`]]]]]], Rule[Alignment, List[Left, Baseline]], Rule[BaselinePosition, Baseline], Rule[FrameMargins, List[List[3, 0], List[0, 0]]], Rule[BaseStyle, List[Rule[LineSpacing, List[0, 0]], Rule[LineBreakWithin, False]]]], RowBox[List["PacletSymbol", "[", RowBox[List["\"WolframChemistry/ProteinVisualization\"", ",", "\"WolframChemistry`ProteinVisualization`BiomoleculePlot3D\""]], "]"]], Rule[TooltipStyle, List[Rule[ShowAutoStyles, True], Rule[ShowStringCharacters, True]]]], Function[Annotation[Slot[1], Style[Defer[PacletSymbol["WolframChemistry/ProteinVisualization", "WolframChemistry`ProteinVisualization`BiomoleculePlot3D"]], Rule[ShowStringCharacters, True]], "Tooltip"]]], Rule[Background, RGBColor[0.968`, 0.976`, 0.984`]], Rule[BaselinePosition, Baseline], Rule[DefaultBaseStyle, List[]], Rule[FrameMargins, List[List[0, 0], List[1, 1]]], Rule[FrameStyle, RGBColor[0.831`, 0.847`, 0.85`]], Rule[RoundingRadius, 4]], PacletSymbol["WolframChemistry/ProteinVisualization", "WolframChemistry`ProteinVisualization`BiomoleculePlot3D"], Rule[Selectable, False], Rule[SelectWithContents, True], Rule[BoxID, "PacletSymbolBox"]][
BioSequence[
"Peptide", "MNYIAFLRAVNVGNSKKMPMADLRTACEAMGLANSITYIQSGNVLFEAPEDDKSSIEAKVNHYLSQLFRFSASVFVRTADDLKALAKAAPFPEEVEHDQVLIGFLSGPPRKEQVEAIDKLSERGERIDVRGSSVYWYFADGWGRSKMGNGTITKALRVKNVDTTRNLQTIAKIIALEGK", {}]]](https://www.wolframcloud.com/obj/resourcesystem/images/27c/27c9f769-ed76-4469-a91d-3134e486c891/7e6263ca332497fb.png)
