Wolfram Function Repository
Instant-use add-on functions for the Wolfram Language
Function Repository Resource:
A 3D rotatable Riemann sphere version of ComplexPlot
ResourceFunction["RiemannSphereComplexPlot"][f,z] generates a plot of Arg[f] over the Riemann sphere. |
Plot a complex function with a zero at 1 and poles at (-1)±2/3:
| In[1]:= |
|
| Out[1]= |
|
Specify a custom ColorFunction and color shading:
| In[2]:= |
![ResourceFunction["RiemannSphereComplexPlot"][(z - 1)/(1 + z + z^2), z,
ColorFunction -> {ResourceFunction["DLMFHue"], "CyclicLogAbsArgBoundaries"}]](https://www.wolframcloud.com/obj/resourcesystem/images/ebc/ebc19509-7b63-49d6-b273-6c4034f77a38/60741dd02fc88327.png)
|
| Out[2]= |
|
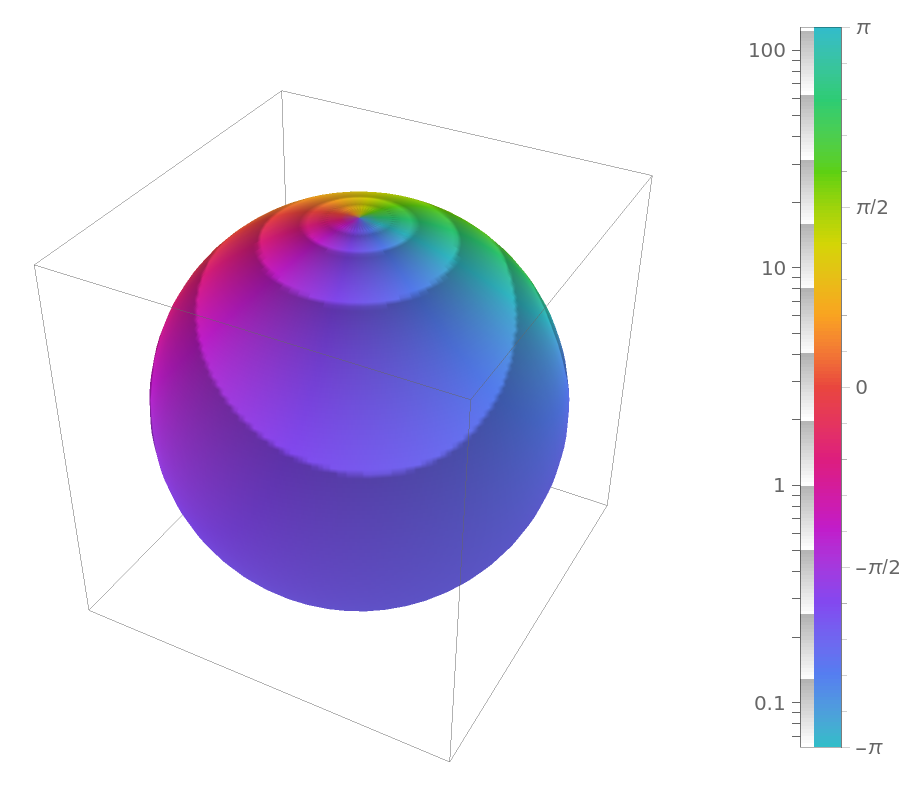
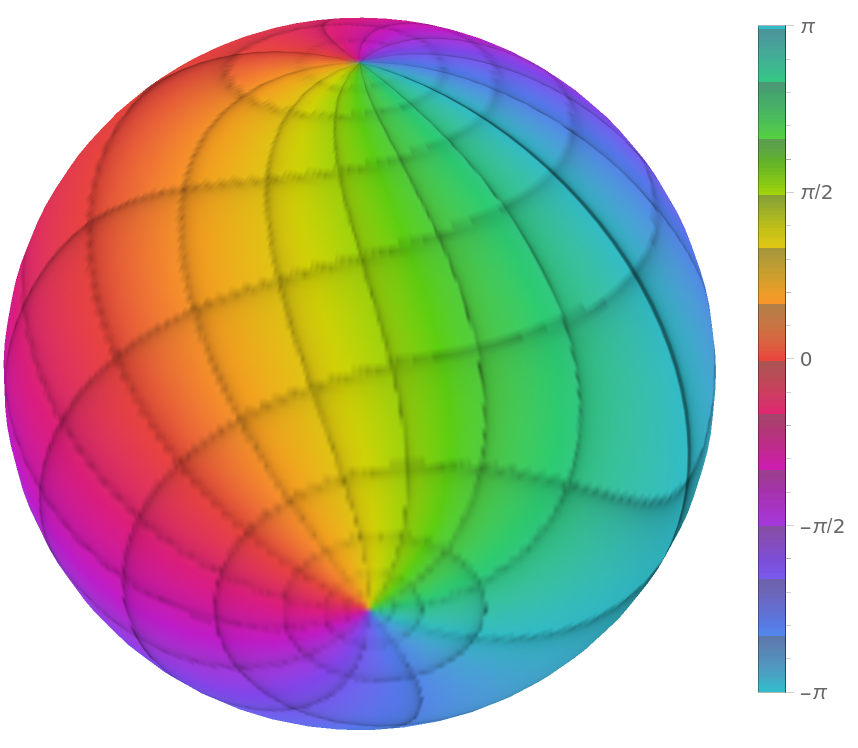
Include a legend showing how the colors vary from -π to π:
| In[3]:= |
![ResourceFunction["RiemannSphereComplexPlot"][(z - 1)/(1 + z + z^2), z,
ColorFunction -> {ResourceFunction["DLMFHue"], "CyclicLogAbsArgBoundaries"}, PlotLegends -> Automatic]](https://www.wolframcloud.com/obj/resourcesystem/images/ebc/ebc19509-7b63-49d6-b273-6c4034f77a38/092db646bf43834c.png)
|
| Out[3]= |
|
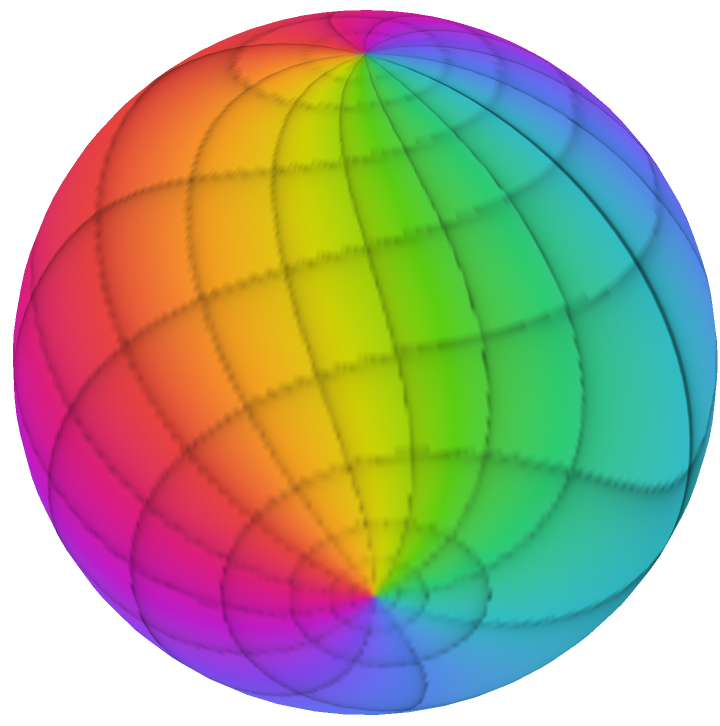
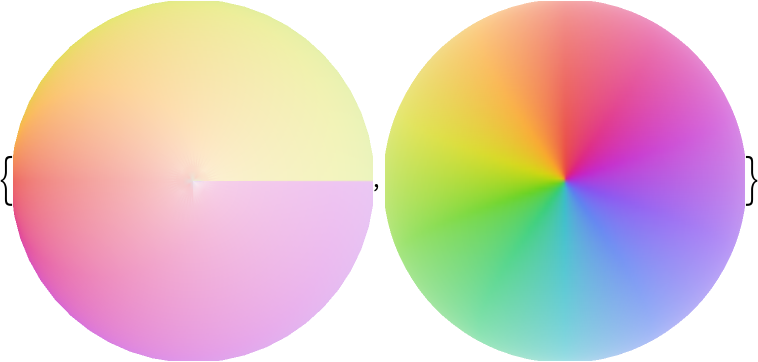
For functions with a branch cut, RiemannSphereComplexPlot will display a discontinuity in color:
| In[4]:= |
![{ResourceFunction["RiemannSphereComplexPlot"][Log[z], z, ViewPoint -> Above], ResourceFunction["RiemannSphereComplexPlot"][Log[z], z, ViewPoint -> Left]}](https://www.wolframcloud.com/obj/resourcesystem/images/ebc/ebc19509-7b63-49d6-b273-6c4034f77a38/3aa060aa612af15c.png)
|
| Out[4]= |
|
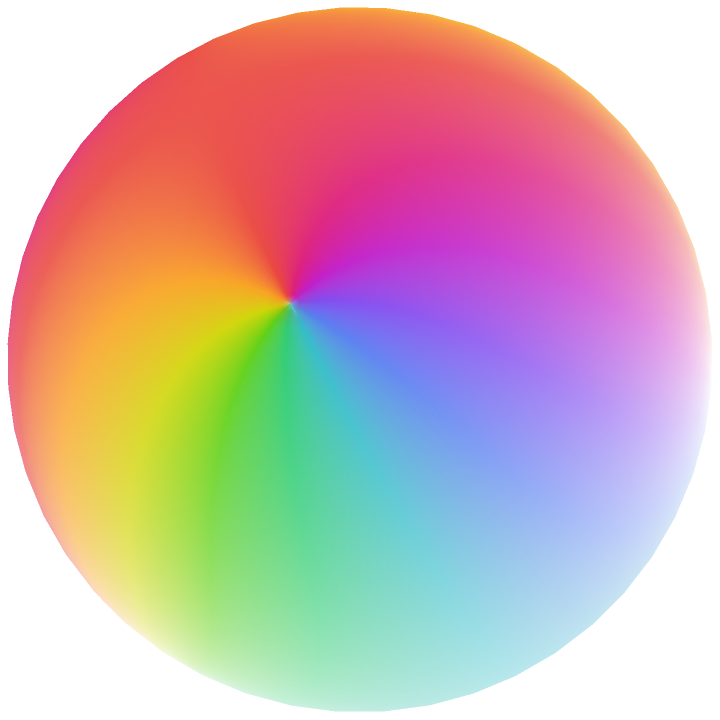
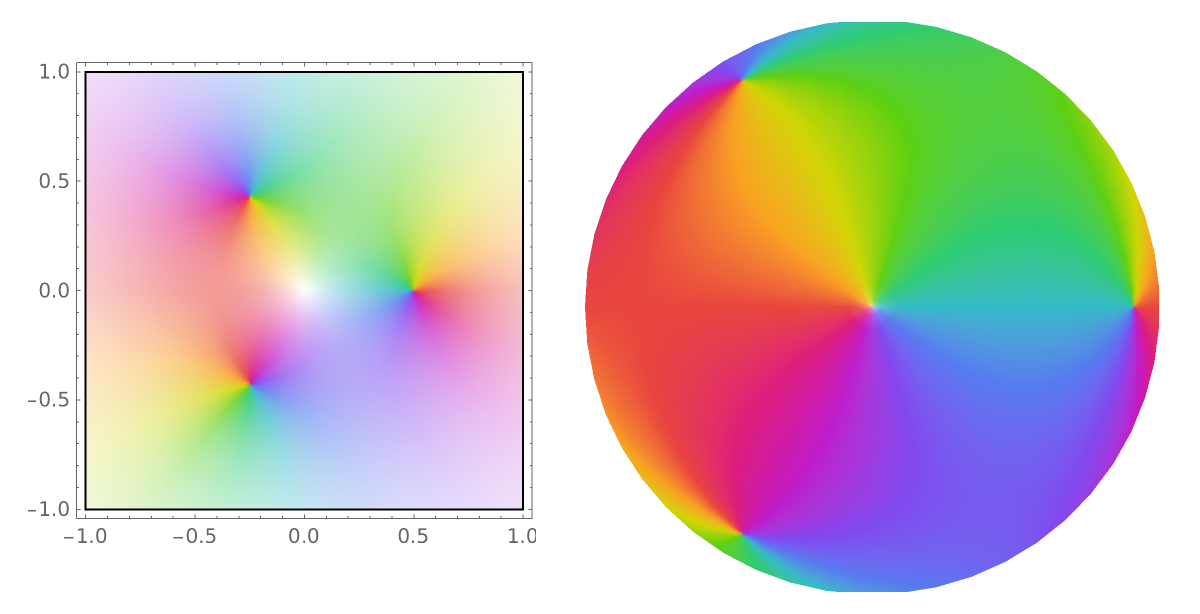
In RiemannSphereComplexPlot, the origin is projected to the South Pole of the sphere, and the point at infinity is mapped to the North Pole:
| In[6]:= |
![{ComplexPlot[(8 z^3 - 1)/(8 z), {z, 1}], ResourceFunction["RiemannSphereComplexPlot"][(8 z^3 - 1)/(8 z), z, ViewPoint -> Below]} // GraphicsRow](https://www.wolframcloud.com/obj/resourcesystem/images/ebc/ebc19509-7b63-49d6-b273-6c4034f77a38/69f70717e7da3308.png)
|
| Out[6]= |
|
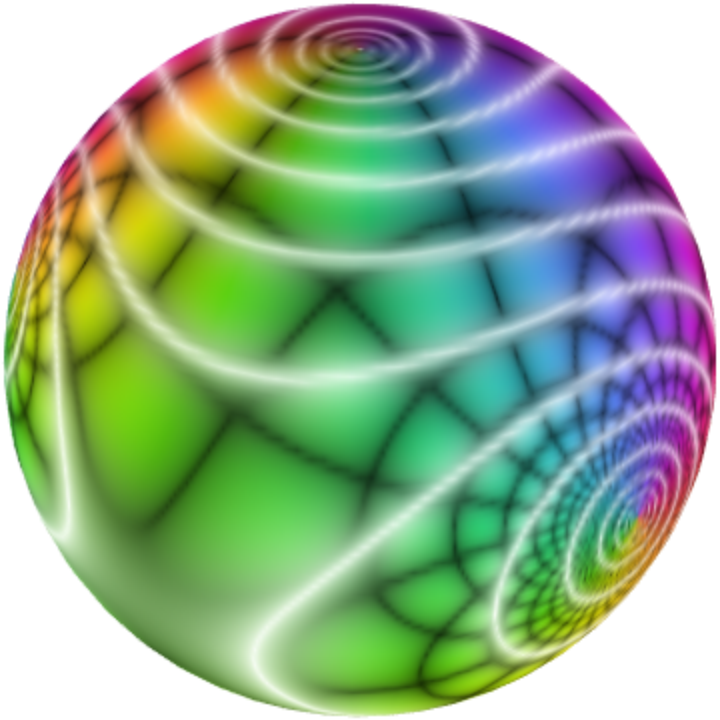
Use resource function SpinShow to create a spinning Riemann sphere visualization:
| In[7]:= |
![ResourceFunction["SpinShow"][
ResourceFunction["RiemannSphereComplexPlot"][(z + 1 + I)/(
1 - I + I z - z^2), z, ColorFunction -> {ResourceFunction["DLMFHue"], "CyclicReImLogAbs"}]]](https://www.wolframcloud.com/obj/resourcesystem/images/ebc/ebc19509-7b63-49d6-b273-6c4034f77a38/74f9f7d0e695e5c2.png)
|
| Out[7]= |
|
This work is licensed under a Creative Commons Attribution 4.0 International License
![ResourceFunction["RiemannSphereComplexPlot"][(z^2 - I z - 1 + I)/(
z - I), z, Boxed -> True, ColorFunction -> "CyclicLogAbs", PlotLegends -> Automatic]](https://www.wolframcloud.com/obj/resourcesystem/images/ebc/ebc19509-7b63-49d6-b273-6c4034f77a38/0a558cb44b93a47f.png)