Wolfram Function Repository
Instant-use add-on functions for the Wolfram Language
Function Repository Resource:
Visualize the intersections and aggregates of intersections of tuples of intersecting sets
ResourceFunction["UpSetChart"][{tuple1,tuple2,…}] charts the list of related tuples {tuple1,tuple2,…}. | |
ResourceFunction["UpSetChart"][{{tuple1,1,tuple1,2,…},{tuple2,1,tuple2,2,…},…}] charts the list of sublists of related tuples. |
| Set Menu Chart | Lower Left | BarChart of the cardinality of each element in the lists of tuples |
| Cardinality Chart | Upper Right | BarChart of the cardinality of each subset of the lists of tuples |
| Combination Matrix Plot | Lower Right | Plot of the subsets in the list of tuples |
| AspectRatio | {1/GoldenRatio,1/GoldenRatio} | aspect ratios used for the set menu and cardinarity sub-charts |
| Background | Lighter[LightGray] | style used for placeholders in combination matrix subplot |
| ChartLegends | None | list of labels used for the legend for the set menu sub-chart |
| ChartStyle | Automatic | list of styles used for the set menu and cardinality sub-charts |
| ImagePadding | {{20,2},{15,2}} | image padding of the combination matrix subplot |
| ImageSize | {Medium,Small} | size of the combination matrix subplot |
| PlotMarkers | Graphics[Disk[{0,0},Scaled[0.025]]] | markers used for the combination matrix subplot |
| PlotStyle | Gray | style used for the combination matrix subplot |
| PlotTheme | Automatic | theme applied to all subplots and sub-charts |
| "SortingFunctions" | {Identity,Identity} | sort functions applied to the elements of the set menu and cardinality sub-charts |
Simulate data for a survey of 30 animal lovers for the types of pets they have:
| In[1]:= | ![pets = Permutations[{"Cat", "Dog", "Fish", "Bird", "Rodent", "Reptile"}, {1, 4}];
SeedRandom[321];
pets =
RandomChoice[
Delete[pets, List /@ RandomSample[Range@Length@pets, Floor[.25 Length@pets]]]
, 30
]](https://www.wolframcloud.com/obj/resourcesystem/images/56a/56a25f7a-e2ec-4d11-bd8d-31b8131ad798/33d4683330b41fc3.png) |
| Out[3]= |  |
View relationships:
| In[4]:= |
| Out[4]= | 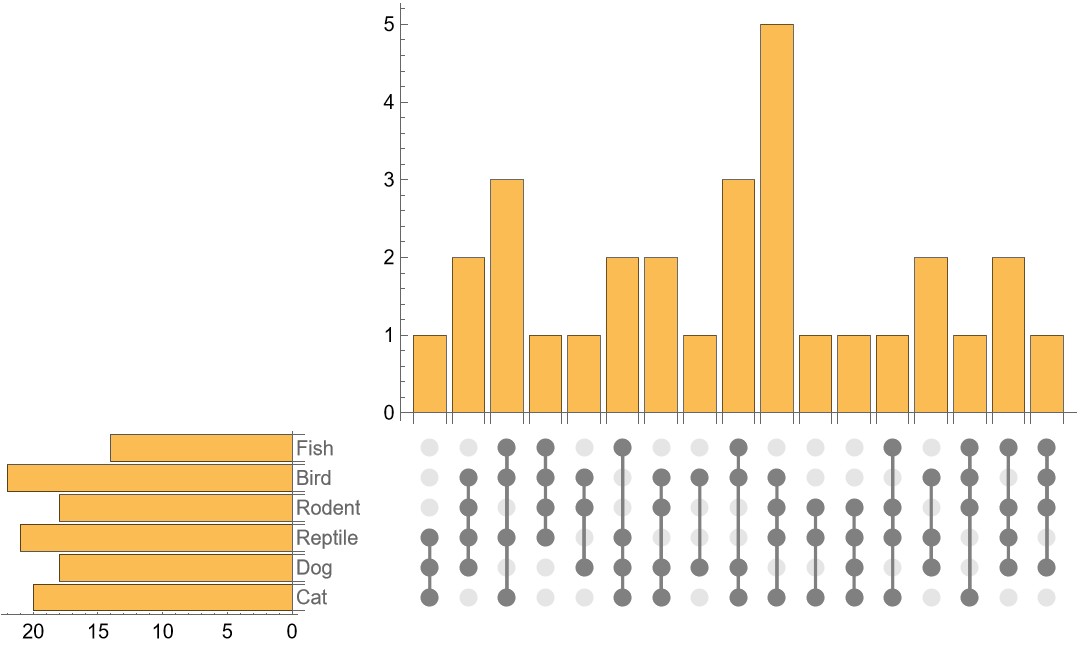 |
Simulate data for a survey of 15 homes in two cities for the types of vehicles they own:
| In[5]:= | ![vehicles = Permutations[{"Bicycle", "Motorbike", "Car", "Van", "Truck"}, {1, 4}];
SeedRandom[789];
vehicles =
RandomChoice[
Delete[vehicles, List /@ RandomSample[Range@Length@vehicles, Floor[.25 Length@vehicles]]]
, {2, 15}
]](https://www.wolframcloud.com/obj/resourcesystem/images/56a/56a25f7a-e2ec-4d11-bd8d-31b8131ad798/11d38c280e720d5b.png) |
| Out[6]= |  |
View relationships of both categories:
| In[7]:= | ![ResourceFunction["UpSetChart"][vehicles
, ChartLegends -> {"City 1", "City 2"}
, ChartStyle -> {Blue, Brown}
]](https://www.wolframcloud.com/obj/resourcesystem/images/56a/56a25f7a-e2ec-4d11-bd8d-31b8131ad798/64497a30e3077460.png) |
| Out[7]= | 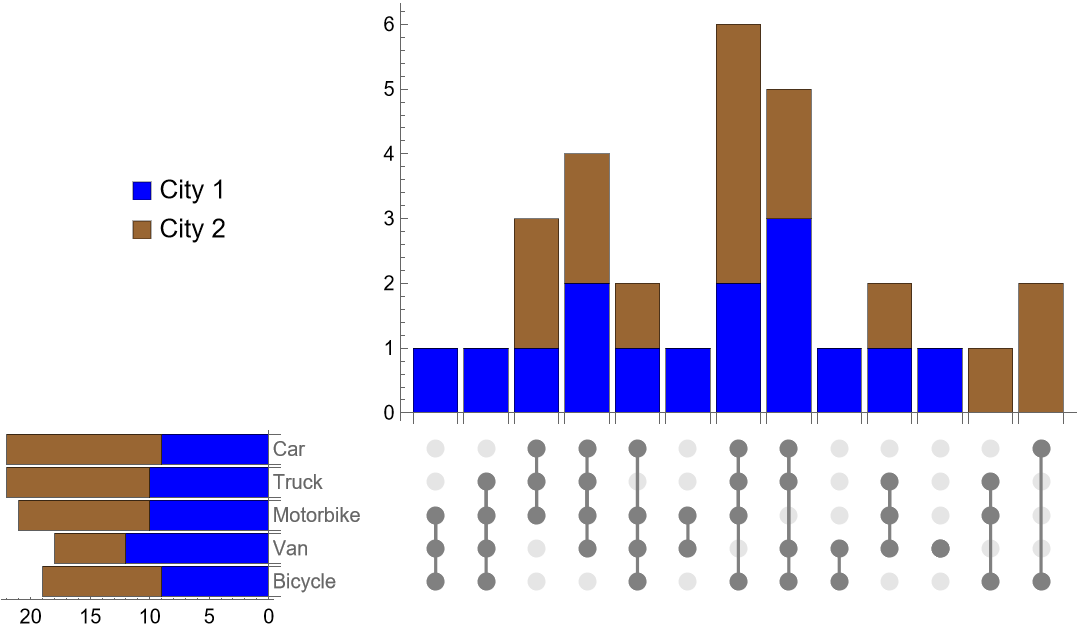 |
Set menu and cardinality sub-charts are sized to the combination plot. However, their size can be adjusted with AspectRatio. Use default sizes for a fixed-sized combination plot:
| In[8]:= | ![SeedRandom[567];
tuples = RandomSample[Range[6], #] & /@ RandomVariate[DiscreteUniformDistribution[{1, 6}], 100];
ResourceFunction["UpSetChart"][
tuples
, ImageSize -> {500, 150}
]](https://www.wolframcloud.com/obj/resourcesystem/images/56a/56a25f7a-e2ec-4d11-bd8d-31b8131ad798/291819ac5fa6dbd9.png) |
| Out[8]= | 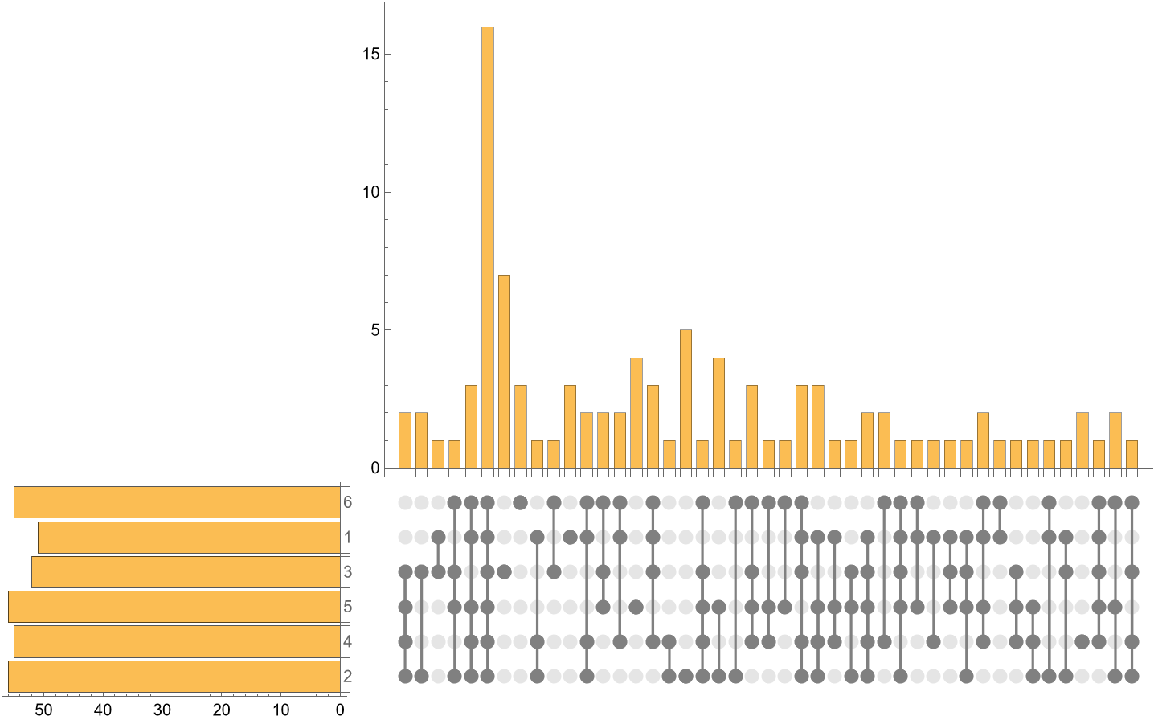 |
Supply AspectRatio specification for set menu and cardinality sub-charts to adjust their size:
| In[9]:= | ![ResourceFunction["UpSetChart"][
tuples
, ImageSize -> {500, 150}
, AspectRatio -> {5/6, 1/5}
]](https://www.wolframcloud.com/obj/resourcesystem/images/56a/56a25f7a-e2ec-4d11-bd8d-31b8131ad798/513daa411b7648be.png) |
| Out[9]= | 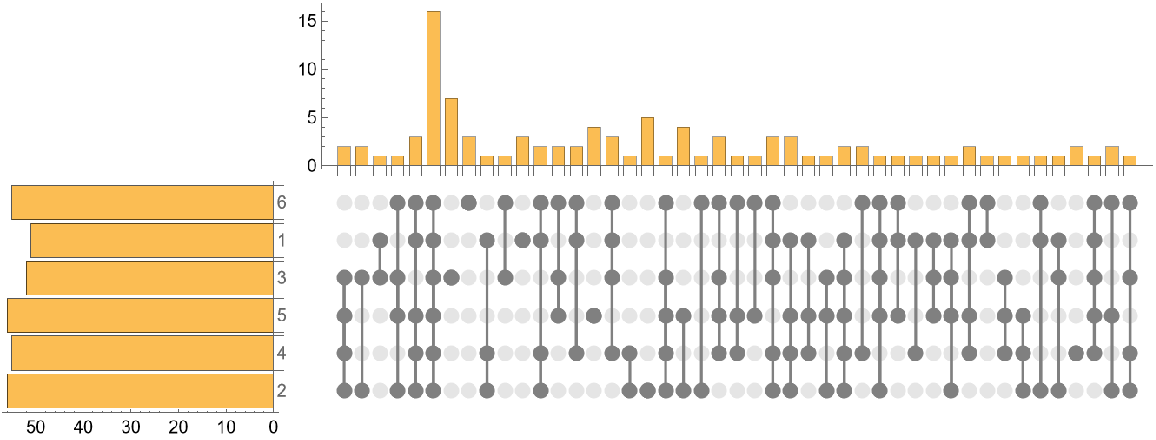 |
Supply a style for the placeholders of the combination matrix subplot:
| In[10]:= | ![SeedRandom[567];
tuples = RandomSample[Range[4], #] & /@ RandomVariate[DiscreteUniformDistribution[{1, 4}], 20];
ResourceFunction["UpSetChart"][
tuples
, Background -> Yellow
]](https://www.wolframcloud.com/obj/resourcesystem/images/56a/56a25f7a-e2ec-4d11-bd8d-31b8131ad798/39407e33925f78ad.png) |
| Out[10]= | 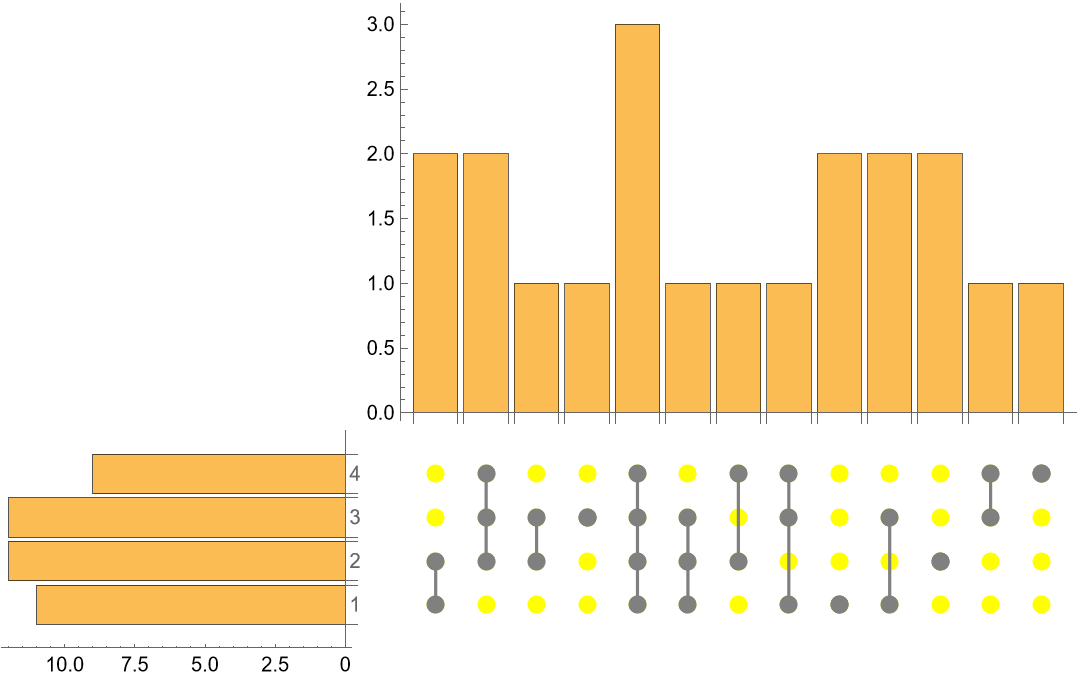 |
Create example data:
| In[11]:= | ![SeedRandom[567];
tuples = RandomSample[Range[4], #] & /@ RandomVariate[DiscreteUniformDistribution[{1, 4}], 20];](https://www.wolframcloud.com/obj/resourcesystem/images/56a/56a25f7a-e2ec-4d11-bd8d-31b8131ad798/3bfba29278e6edd9.png) |
Supply a list of labels and a list of styles:
| In[12]:= | ![ResourceFunction["UpSetChart"][
tuples
, ChartStyle -> {LightBlue}
, ChartLegends -> {"Group 1"}
]](https://www.wolframcloud.com/obj/resourcesystem/images/56a/56a25f7a-e2ec-4d11-bd8d-31b8131ad798/4c71917d9e4e3ade.png) |
| Out[12]= | 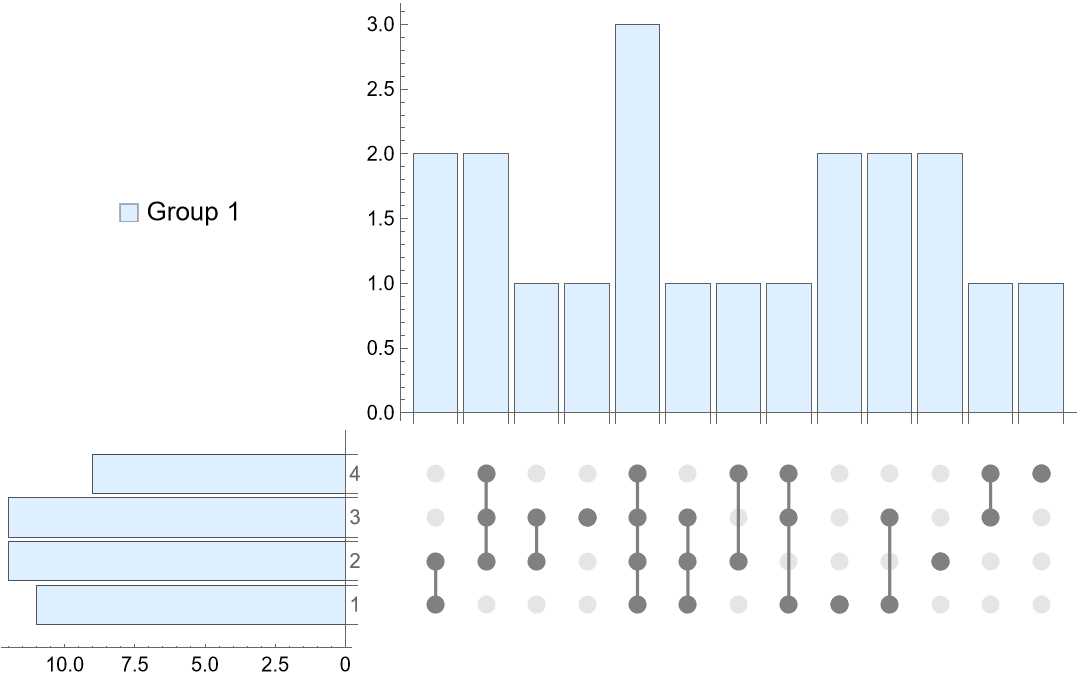 |
Create example data:
| In[13]:= | ![SeedRandom[567];
tuples = Partition[
RandomSample[Range[4], #] & /@ RandomVariate[DiscreteUniformDistribution[{1, 4}], 40], 20];](https://www.wolframcloud.com/obj/resourcesystem/images/56a/56a25f7a-e2ec-4d11-bd8d-31b8131ad798/619efcbed174dc1d.png) |
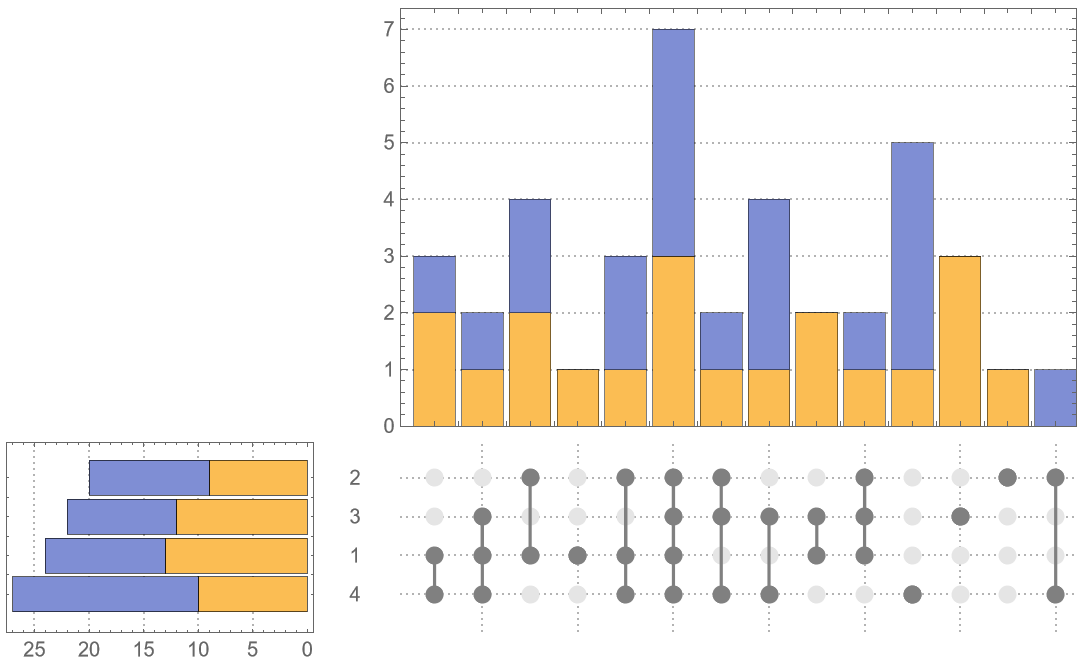
Supply a list of styles:
| In[14]:= | ![ResourceFunction["UpSetChart"][
tuples
, ChartStyle -> {Red, Purple}
]](https://www.wolframcloud.com/obj/resourcesystem/images/56a/56a25f7a-e2ec-4d11-bd8d-31b8131ad798/5f2520c29a550627.png) |
| Out[14]= | 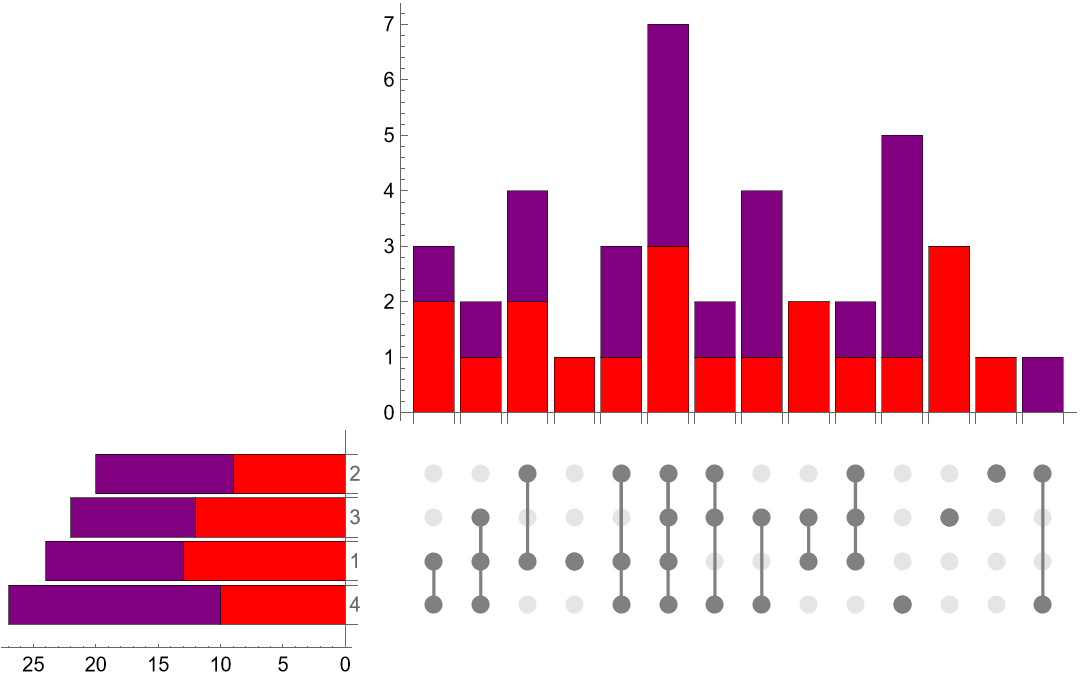 |
Set menu and cardinality sub-charts image padding uses the combination plot's image padding. Default image padding may be too narrow to fit set menu or cardinality sub-chart axis labels:
| In[15]:= | ![SeedRandom[567];
tuples = RandomSample[Range[4], #] & /@ RandomVariate[DiscreteUniformDistribution[{1, 4}], 5000];
ResourceFunction["UpSetChart"][tuples]](https://www.wolframcloud.com/obj/resourcesystem/images/56a/56a25f7a-e2ec-4d11-bd8d-31b8131ad798/2f10efbb5ea332ba.png) |
| Out[15]= | 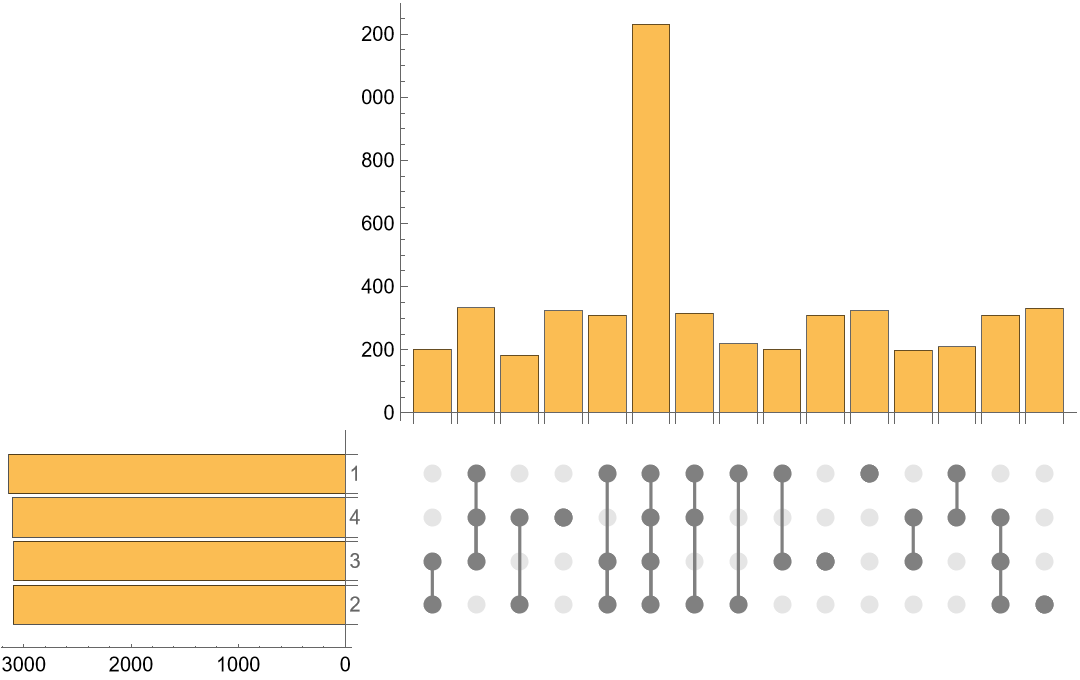 |
Supply ImagePadding specification to display full chart labels:
| In[16]:= | ![ResourceFunction["UpSetChart"][
tuples
, ImagePadding -> {{25, 2}, {15, 2}}
]](https://www.wolframcloud.com/obj/resourcesystem/images/56a/56a25f7a-e2ec-4d11-bd8d-31b8131ad798/6f70f0ae59cc1cbb.png) |
| Out[16]= | 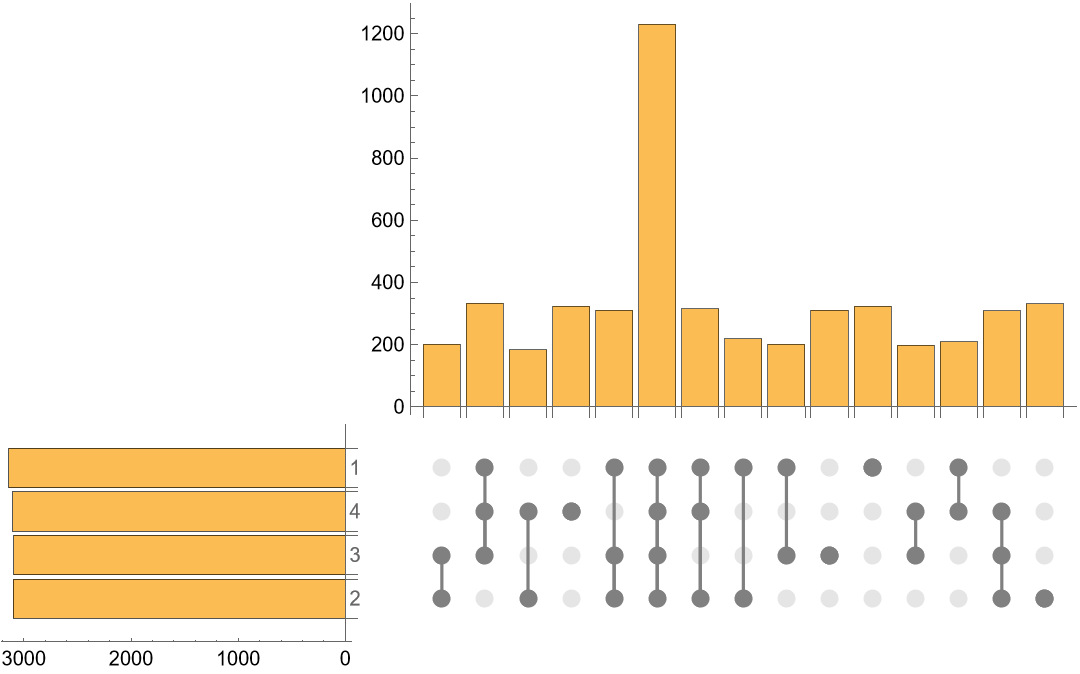 |
Default sizing compresses large combination matrix subplots:
| In[17]:= | ![SeedRandom[567];
tuples = RandomSample[Range[6], #] & /@ RandomVariate[DiscreteUniformDistribution[{2, 5}], 100];](https://www.wolframcloud.com/obj/resourcesystem/images/56a/56a25f7a-e2ec-4d11-bd8d-31b8131ad798/2d3245fa6773bbb5.png) |
View with default ImageSize:
| In[18]:= | ![ResourceFunction["UpSetChart"][
tuples
]](https://www.wolframcloud.com/obj/resourcesystem/images/56a/56a25f7a-e2ec-4d11-bd8d-31b8131ad798/163a35772356a431.png) |
| Out[18]= | 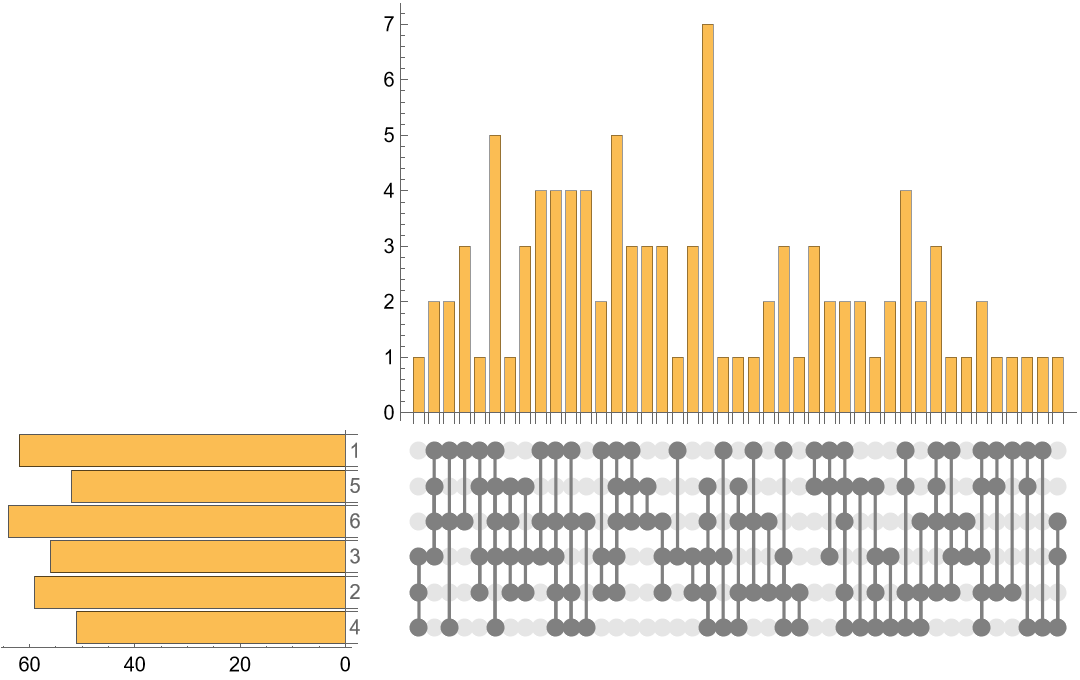 |
Increase ImageSize for a larger combination matrix subplot:
| In[19]:= | ![ResourceFunction["UpSetChart"][
tuples
, ImageSize -> {Large, Small}
]](https://www.wolframcloud.com/obj/resourcesystem/images/56a/56a25f7a-e2ec-4d11-bd8d-31b8131ad798/0c562059262dddc0.png) |
| Out[19]= | 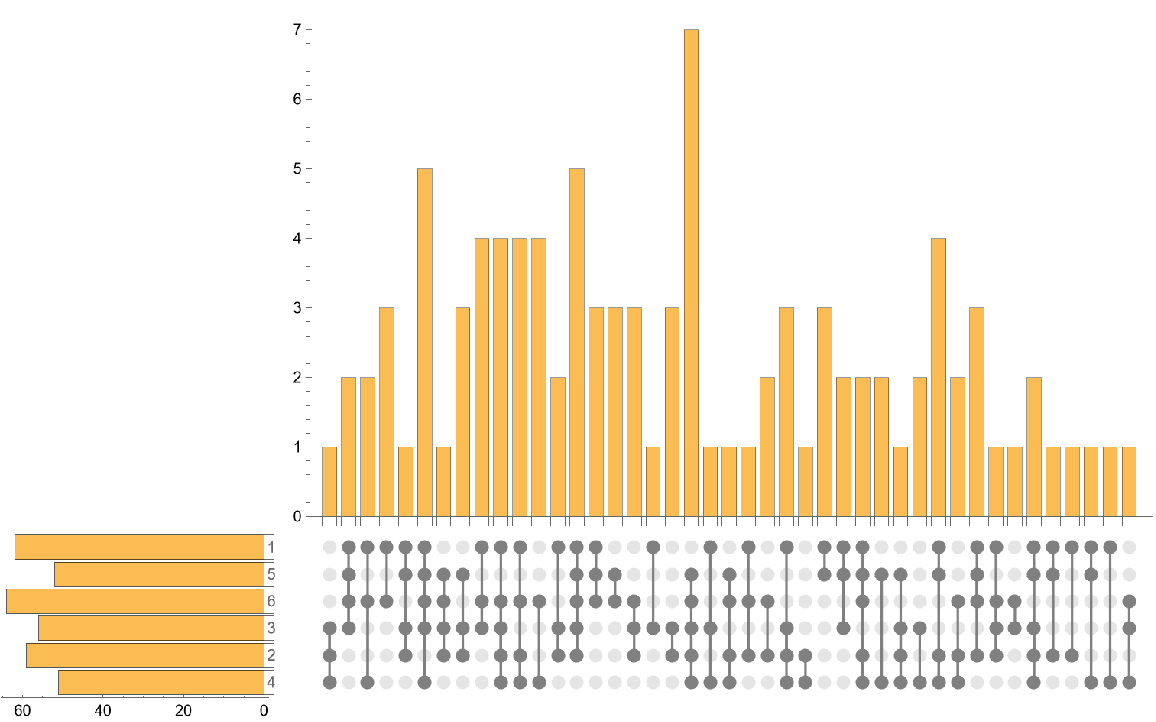 |
Create example data:
| In[20]:= | ![SeedRandom[567];
tuples = RandomSample[Range[4], #] & /@ RandomVariate[DiscreteUniformDistribution[{1, 4}], 20];](https://www.wolframcloud.com/obj/resourcesystem/images/56a/56a25f7a-e2ec-4d11-bd8d-31b8131ad798/1e00e483100a875e.png) |
Set the shape of combination matrix plot markers:
| In[21]:= | ![ResourceFunction["UpSetChart"][
tuples
, PlotMarkers -> Graphics@Disk[{0, 0}, Scaled[{.025, .01}]]
] // Rasterize](https://www.wolframcloud.com/obj/resourcesystem/images/56a/56a25f7a-e2ec-4d11-bd8d-31b8131ad798/69f32f4bce00ad47.png) |
| Out[21]= | 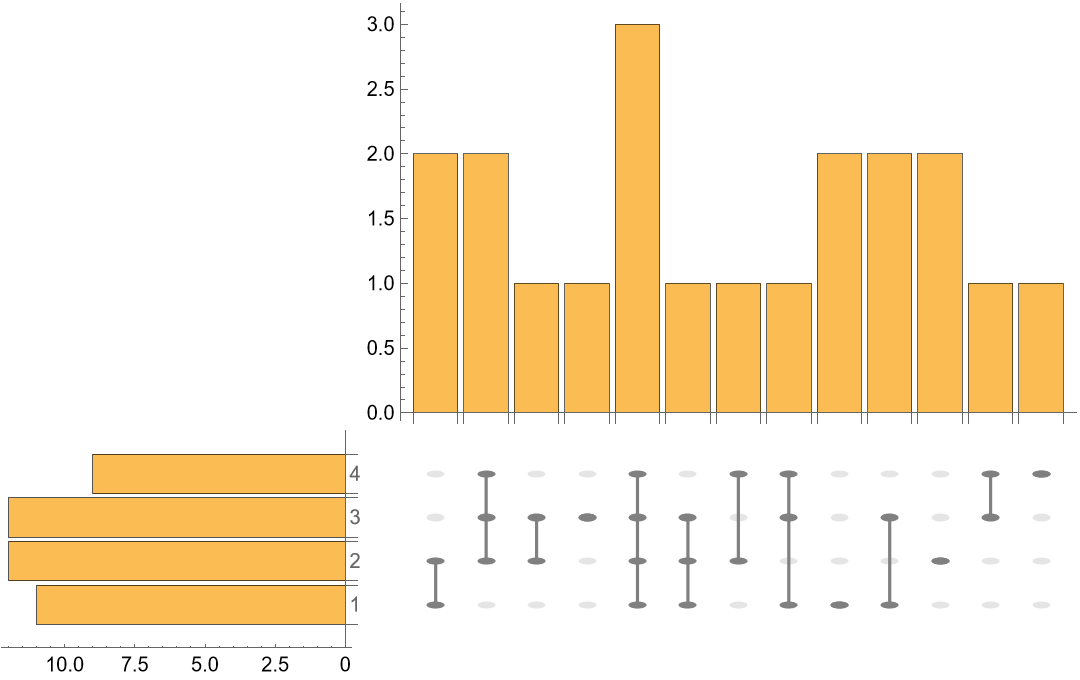 |
Set PlotStyle of combination matrix plot markers:
| In[22]:= | ![SeedRandom[567];
tuples = RandomSample[Range[4], #] & /@ RandomVariate[DiscreteUniformDistribution[{1, 4}], 20];](https://www.wolframcloud.com/obj/resourcesystem/images/56a/56a25f7a-e2ec-4d11-bd8d-31b8131ad798/6735de18f034de0c.png) |
View with PlotStyle specification:
| In[23]:= | ![ResourceFunction["UpSetChart"][
tuples
, PlotStyle -> {Brown}
]](https://www.wolframcloud.com/obj/resourcesystem/images/56a/56a25f7a-e2ec-4d11-bd8d-31b8131ad798/78073d30f09b9a1f.png) |
| Out[23]= |  |
Create example data:
| In[26]:= | ![SeedRandom[567];
tuples = Partition[
RandomSample[Range[4], #] & /@ RandomVariate[DiscreteUniformDistribution[{1, 4}], 40], 20];](https://www.wolframcloud.com/obj/resourcesystem/images/56a/56a25f7a-e2ec-4d11-bd8d-31b8131ad798/2bb6c2291a99b570.png) |
Unsorted elements and subsets are listed as they appear in the data:
| In[27]:= | ![ResourceFunction["UpSetChart"][
tuples
]](https://www.wolframcloud.com/obj/resourcesystem/images/56a/56a25f7a-e2ec-4d11-bd8d-31b8131ad798/31cfe2b0e5d67763.png) |
| Out[27]= | 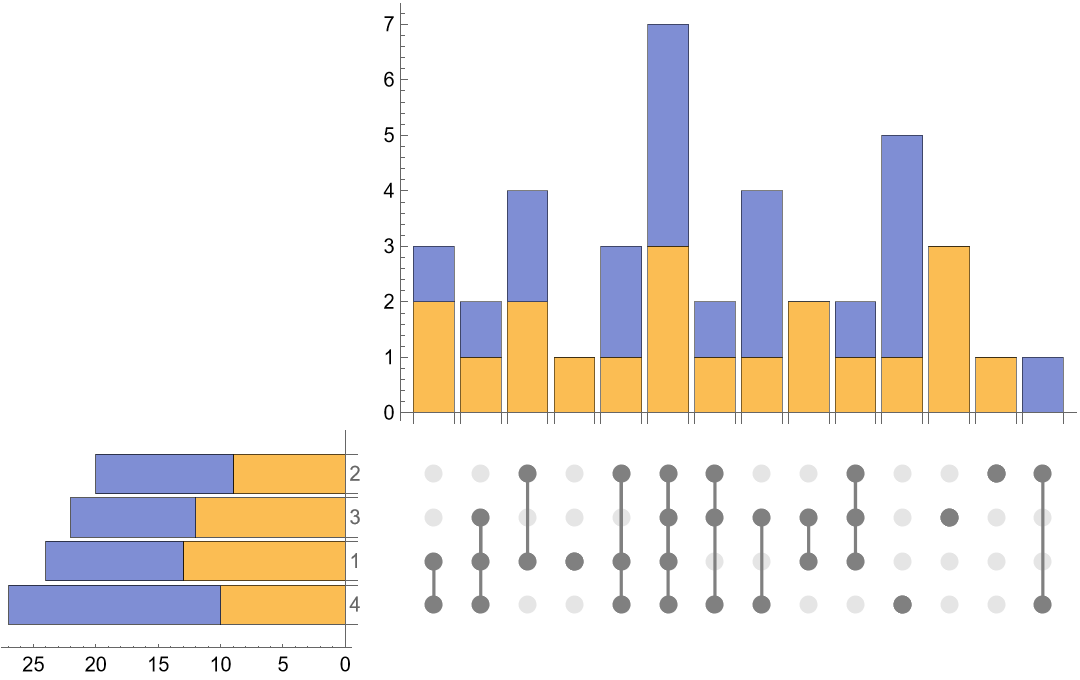 |
Sort the set menu sub-chart by its labels and the cardinality sub-chart by the total across all sets in reverse order:
| In[28]:= | ![ResourceFunction["UpSetChart"][
tuples
, "SortingFunctions" -> {KeySort, ReverseSortBy[Total]}
]](https://www.wolframcloud.com/obj/resourcesystem/images/56a/56a25f7a-e2ec-4d11-bd8d-31b8131ad798/0d44c07ed9cfceae.png) |
| Out[28]= | 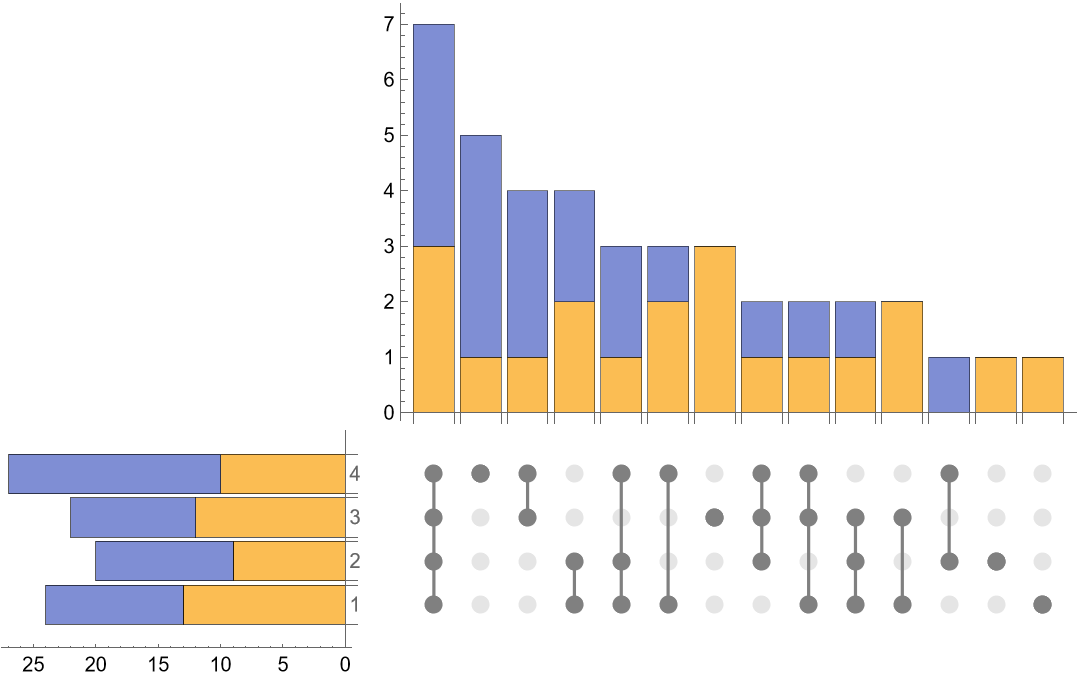 |
Both the ChartStyle and ChartLegends options must be supplied to return a legend:
| In[29]:= | ![SeedRandom[567];
tuples = RandomSample[Range[4], #] & /@ RandomVariate[DiscreteUniformDistribution[{1, 4}], 20];](https://www.wolframcloud.com/obj/resourcesystem/images/56a/56a25f7a-e2ec-4d11-bd8d-31b8131ad798/4285f40b8a3d3e99.png) |
Without both options:
| In[30]:= | ![ResourceFunction["UpSetChart"][
tuples
, ChartLegends -> {"Group 1"}
]](https://www.wolframcloud.com/obj/resourcesystem/images/56a/56a25f7a-e2ec-4d11-bd8d-31b8131ad798/7008619867186b46.png) |
| Out[30]= | 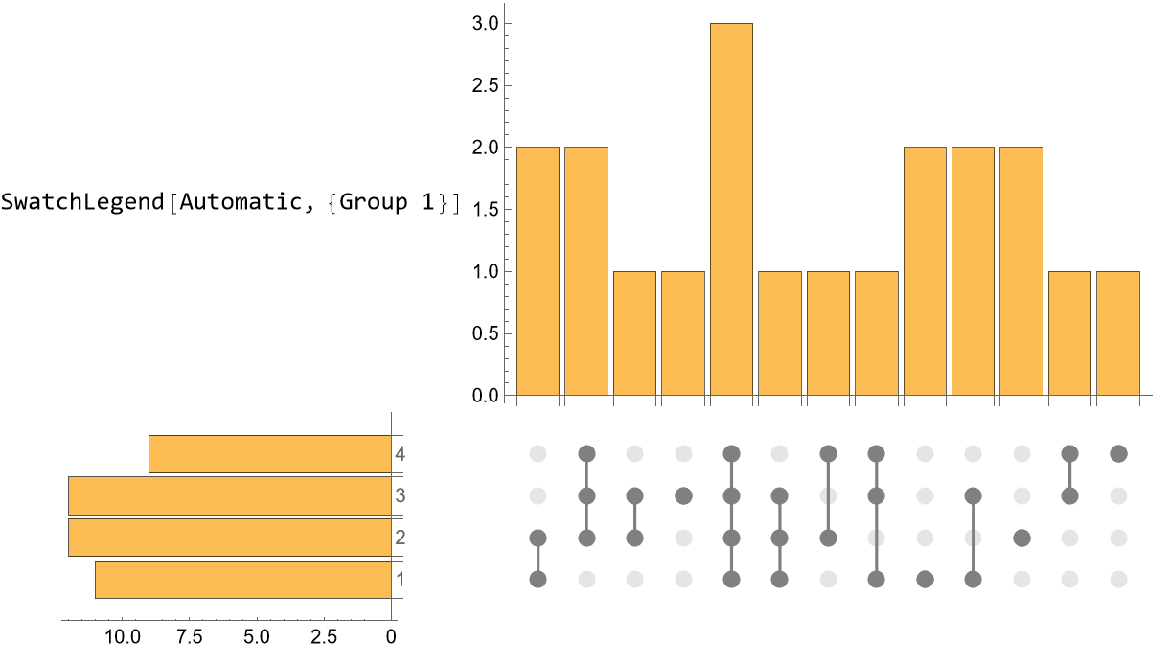 |
With both options:
| In[31]:= | ![ResourceFunction["UpSetChart"][
tuples
, ChartStyle -> {Gray}
, ChartLegends -> {"Group 1"}
]](https://www.wolframcloud.com/obj/resourcesystem/images/56a/56a25f7a-e2ec-4d11-bd8d-31b8131ad798/618b23c55caff44d.png) |
| Out[31]= | 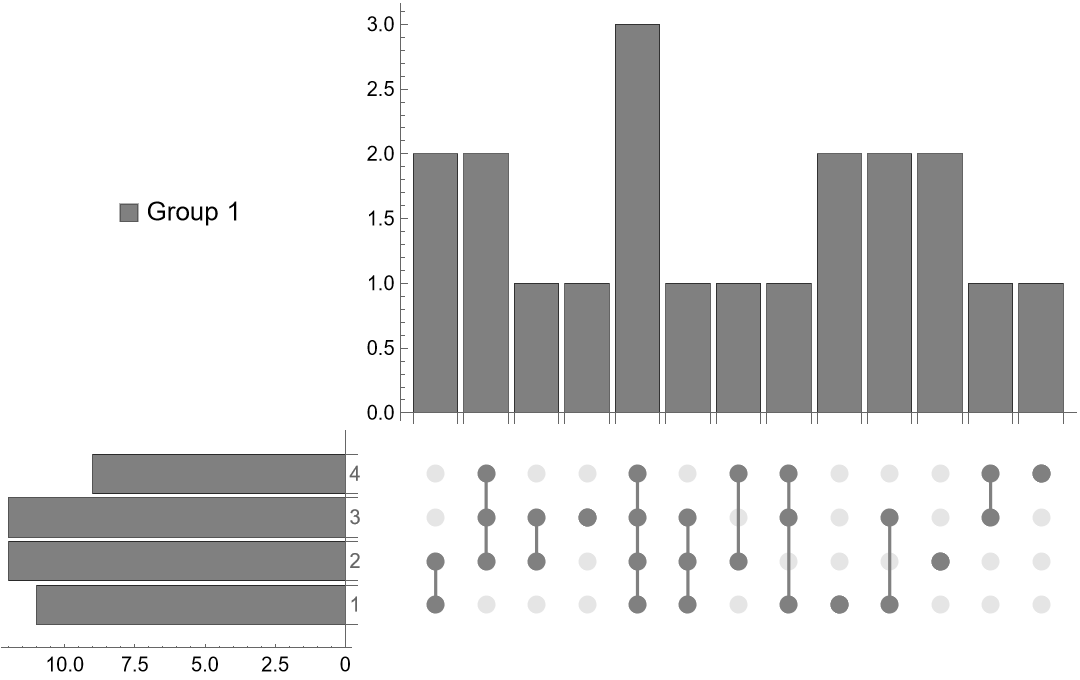 |
Explore the intersecting sets of class, sex and survived in the Titanic dataset:
| In[32]:= | ![DynamicModule[
{
data = Query[All, {"class", "sex", "survived"}]@
ExampleData[{"Dataset", "Titanic"}, "RawData"]
, schema = ExampleData[{"Dataset", "Titanic"}, "Schema"]
, groupedData
, groupList = {"class", "sex", "survived"}
, sorting = {KeySort -> "Labels", SortBy[Total] -> "Total", ReverseSortBy[Total] -> "Reverse Total"}
, chartStyles =
AssociationThread[
{"1st", "2nd", "3rd", "male", "female", True, False} ->
ColorData["Crayola"] /@ {"Gold", "Silver", "Copper", "PurpleHeart", "MangoTango", "Sunglow", "OuterSpace"}
]
}
, Manipulate[
groupedData = Query[GroupBy[#[groupBy] &], All, Complement[groupList, {groupBy}]/*Values]@data;
ResourceFunction["UpSetChart"][
Values[groupedData]
, ChartStyle -> Lookup[chartStyles, Keys[groupedData]]
, ChartLegends -> Keys[groupedData]
, "SortingFunctions" -> {elementSort, setSort}
]
, {{groupBy, First@groupList, "Group By"}, groupList}
, {{elementSort, KeySort, "Sort Elements"}, Insert[sorting, KeySortBy[Position[schema, #] &] -> "Schema", 2], ControlType -> PopupMenu}
, {{setSort, KeySort, "Sort Sets"}, sorting, ControlType -> PopupMenu}
, TrackedSymbols :> True
]
, SaveDefinitions -> True
, TrackedSymbols :> {}
]](https://www.wolframcloud.com/obj/resourcesystem/images/56a/56a25f7a-e2ec-4d11-bd8d-31b8131ad798/6c4350e4aa945461.png) |
| Out[32]= | 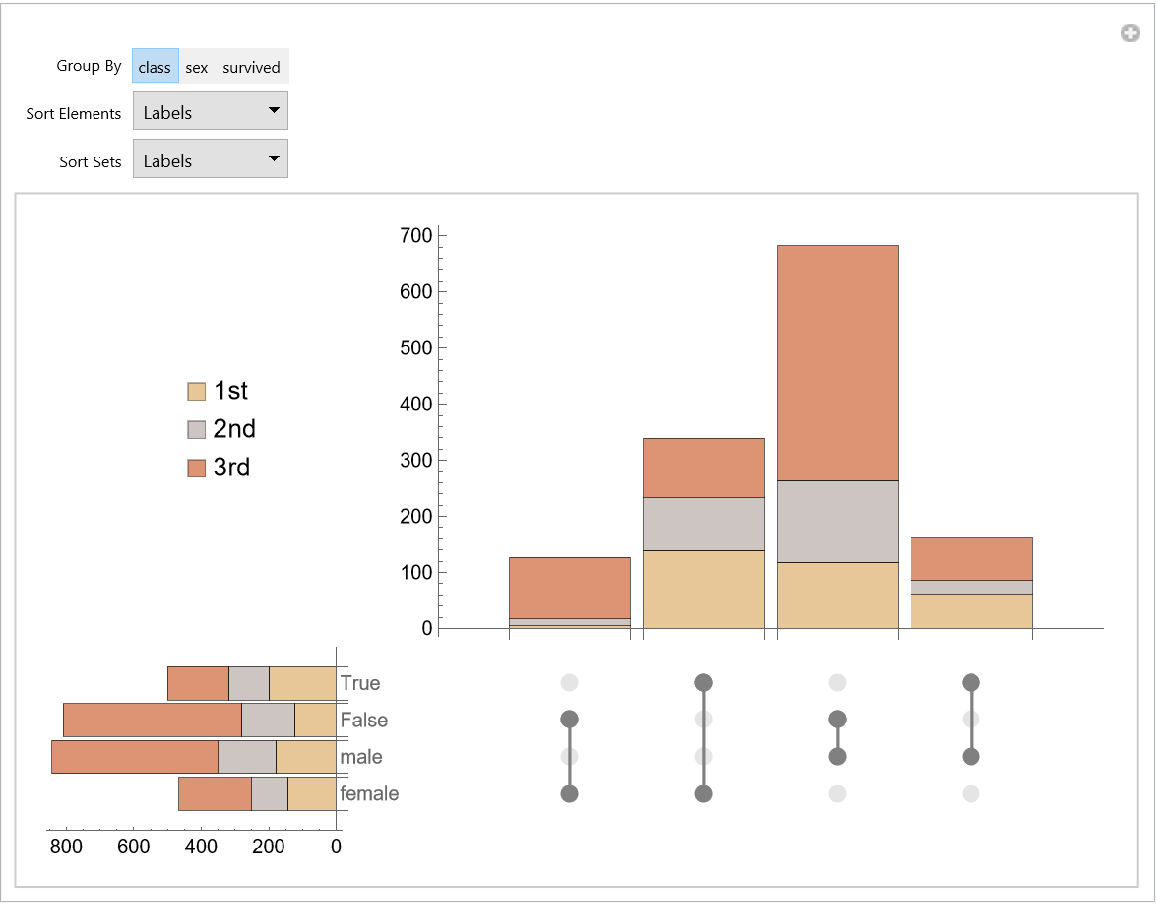 |
This work is licensed under a Creative Commons Attribution 4.0 International License
![SeedRandom[567];
tuples = Partition[
RandomSample[Range[4], #] & /@ RandomVariate[DiscreteUniformDistribution[{1, 4}], 40], 20];](https://www.wolframcloud.com/obj/resourcesystem/images/56a/56a25f7a-e2ec-4d11-bd8d-31b8131ad798/0909928eff94289d.png)
![ResourceFunction["UpSetChart"][
tuples
, PlotTheme -> "Detailed"
]](https://www.wolframcloud.com/obj/resourcesystem/images/56a/56a25f7a-e2ec-4d11-bd8d-31b8131ad798/3673a3040e911cbb.png)