Wolfram Function Repository
Instant-use add-on functions for the Wolfram Language
Function Repository Resource:
Chart changing weights over time
ResourceFunction["AlluvialChart"][{{w11,w12,… }, {w21,w22,…},…}] generates a chart of changing values wij over time. | |
ResourceFunction["AlluvialChart"][{g1,g2,… }] generates a chart changing vertex weights over a sequence of graphs gi. |
| "CenteredMidline" | False | whether to vertically center the columns |
| "ColorList" | Automatic | list of colors to use for the vertices |
| "EdgeForm" | White | specify the EdgeForm for the filled curves |
| "HorizontalLabels" | None | specify the labels on graphs |
| "Spacings" | Automatic | how much to space the bands |
| "VerticalLabels" | None | specify the labels for the vertices |
Construct a simple alluvial diagram from lists of numeric values:
| In[1]:= |
| Out[1]= | 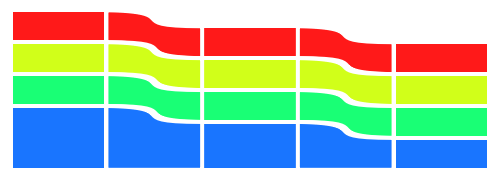 |
Construct a simple alluvial diagram from vertex weights:
| In[2]:= |
| Out[2]= |  |
Construct an alluvial chart using edge weights instead (by taking the dual of a Graph):
| In[3]:= |
| Out[4]= | 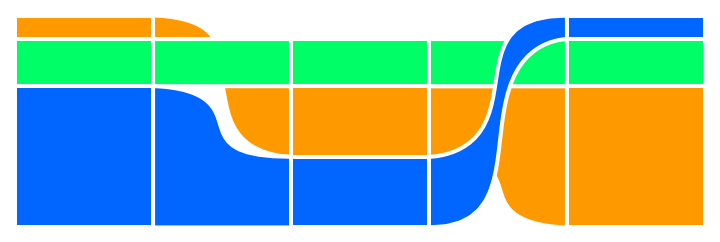 |
Create an alluvial chart and specify the labels and colors:
| In[5]:= | ![gs = Graph[{1 \[UndirectedEdge] 2, 2 \[UndirectedEdge] 3, 3 \[UndirectedEdge] 1, 2 \[DirectedEdge] 4}, VertexWeight -> #] & /@ {{4, 1, 1, 2}, {3, 2, 1, 3}, {2, 1, 2, 2}, {1.5, 1, 3, 1}, {2.5, 4, 2, 2}, {2, 2.3, 1.2, 1}};
vlbls = Table[Subscript["v", i], {i, 4}]; hlbls = Table[Subscript["g", i], {i, 6}];
cols = ResourceFunction["SampleColors"]["BrightBands", 4];
ResourceFunction["AlluvialChart"][gs, "HorizontalLabels" -> hlbls, "VerticalLabels" -> vlbls, ImageSize -> 400, "ColorList" -> cols]](https://www.wolframcloud.com/obj/resourcesystem/images/2c6/2c6bf76a-fc13-4e34-964d-5c896b7329b3/2a3eabf80f711900.png) |
| Out[5]= | 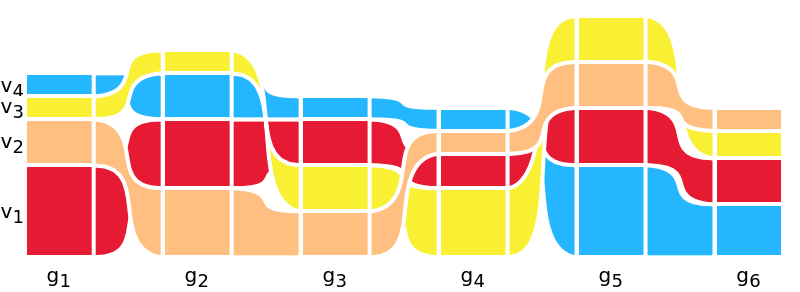 |
Create a random alluvial chart:
| In[6]:= | ![gs = Graph[Range[10], {}, VertexWeight -> #] & /@ RandomReal[{0, 10}, {20, 10}]; ResourceFunction["AlluvialChart"][gs,
ImageSize -> 400, "ColorList" -> ColorData[96, "ColorList"], "EdgeForm" -> {Black, Thickness[0.001]}]](https://www.wolframcloud.com/obj/resourcesystem/images/2c6/2c6bf76a-fc13-4e34-964d-5c896b7329b3/0aab0616b11b09ff.png) |
| Out[6]= | 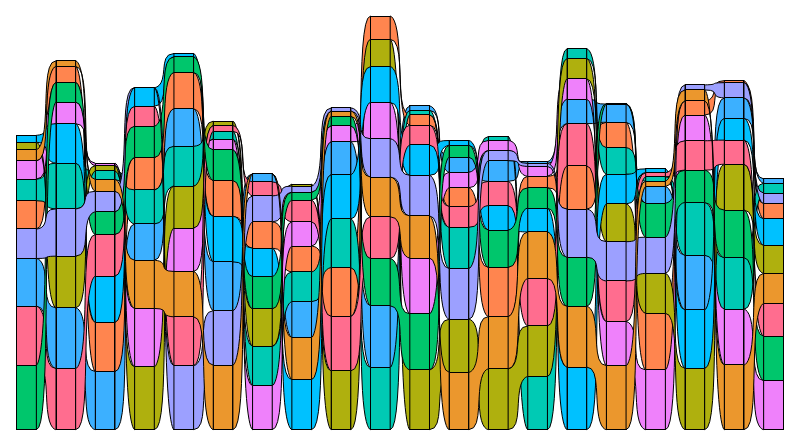 |
Specify that the vertical-midline should be centered:
| In[7]:= |
| In[8]:= | ![Labeled[ResourceFunction["AlluvialChart"][gs, ImageSize -> 200, "CenteredMidline" -> #, "HorizontalLabels" -> {"\!\(\*SubscriptBox[\(g\), \(1\)]\)", "\!\(\*SubscriptBox[\(g\), \(2\)]\)", "\!\(\*SubscriptBox[\(g\), \(3\)]\)"}], "\"CenteredMidline\"" -> #] & /@ {True, False}](https://www.wolframcloud.com/obj/resourcesystem/images/2c6/2c6bf76a-fc13-4e34-964d-5c896b7329b3/16f3a78b94db1ae7.png) |
| Out[8]= |  |
This work is licensed under a Creative Commons Attribution 4.0 International License