Details and Options
The sequence alignment method used is global-alignment or Needleman-Wunsch alignment.
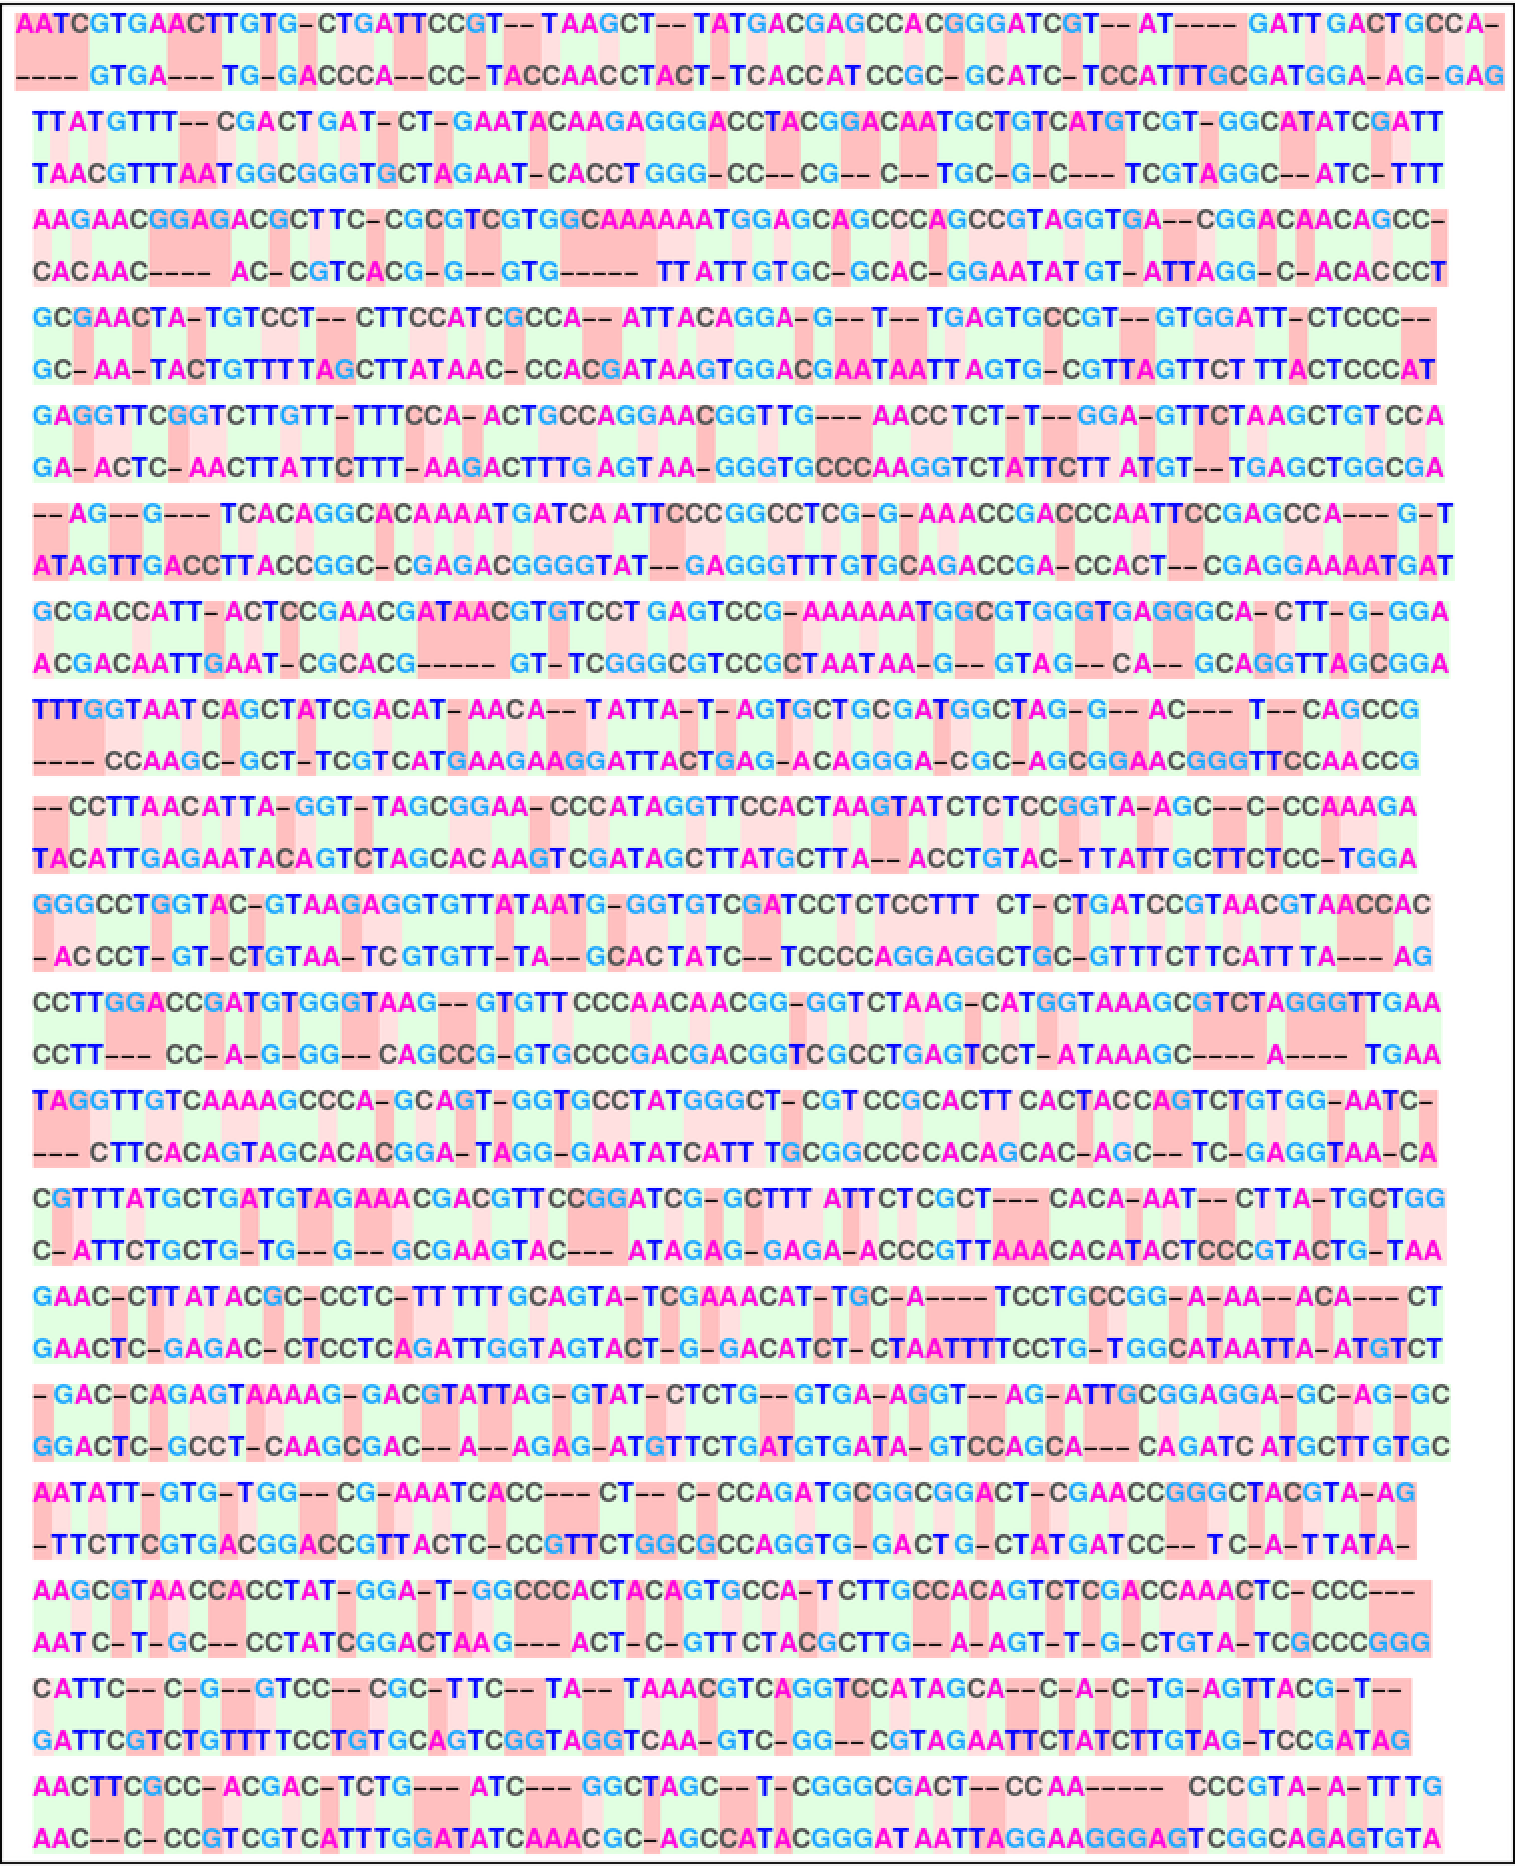
By default, if the sequences are less than 1000 bases, it produces a one-to-one alignment visual, where the red symbolizes a mismatch and the green symbolizes a match after the sequences are aligned. A hyphen takes the place of deletion mutations, the darker red. The lighter red represents a substitution. Each base, ATGC, has its own color for easier viewing.
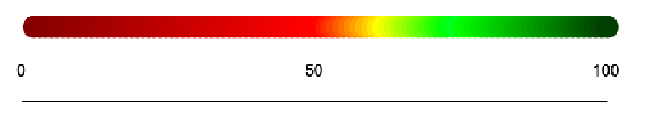
By default, if the sequences are greater than 1000, it produces a color chain. which describes the alignment in groupings of 100 when less than 10,000 and groupings of 1000 above 10,000. After the sequences are partitioned into sections, the same alignment method is performed and the number of common bases is counted.
The scale for the color chain has red representing less similarity and green representing more similarity. It can also be seen as the percent of bases that are similar after alignment in that section of the sequences.
ResourceFunction["DNAAlignmentPlot"] accepts the following options:
| Method | Automatic | specify whether to use a one-on-one or ColorChain approach |
| "GroupSize" | Automatic | specify the group size of a grouped plot |
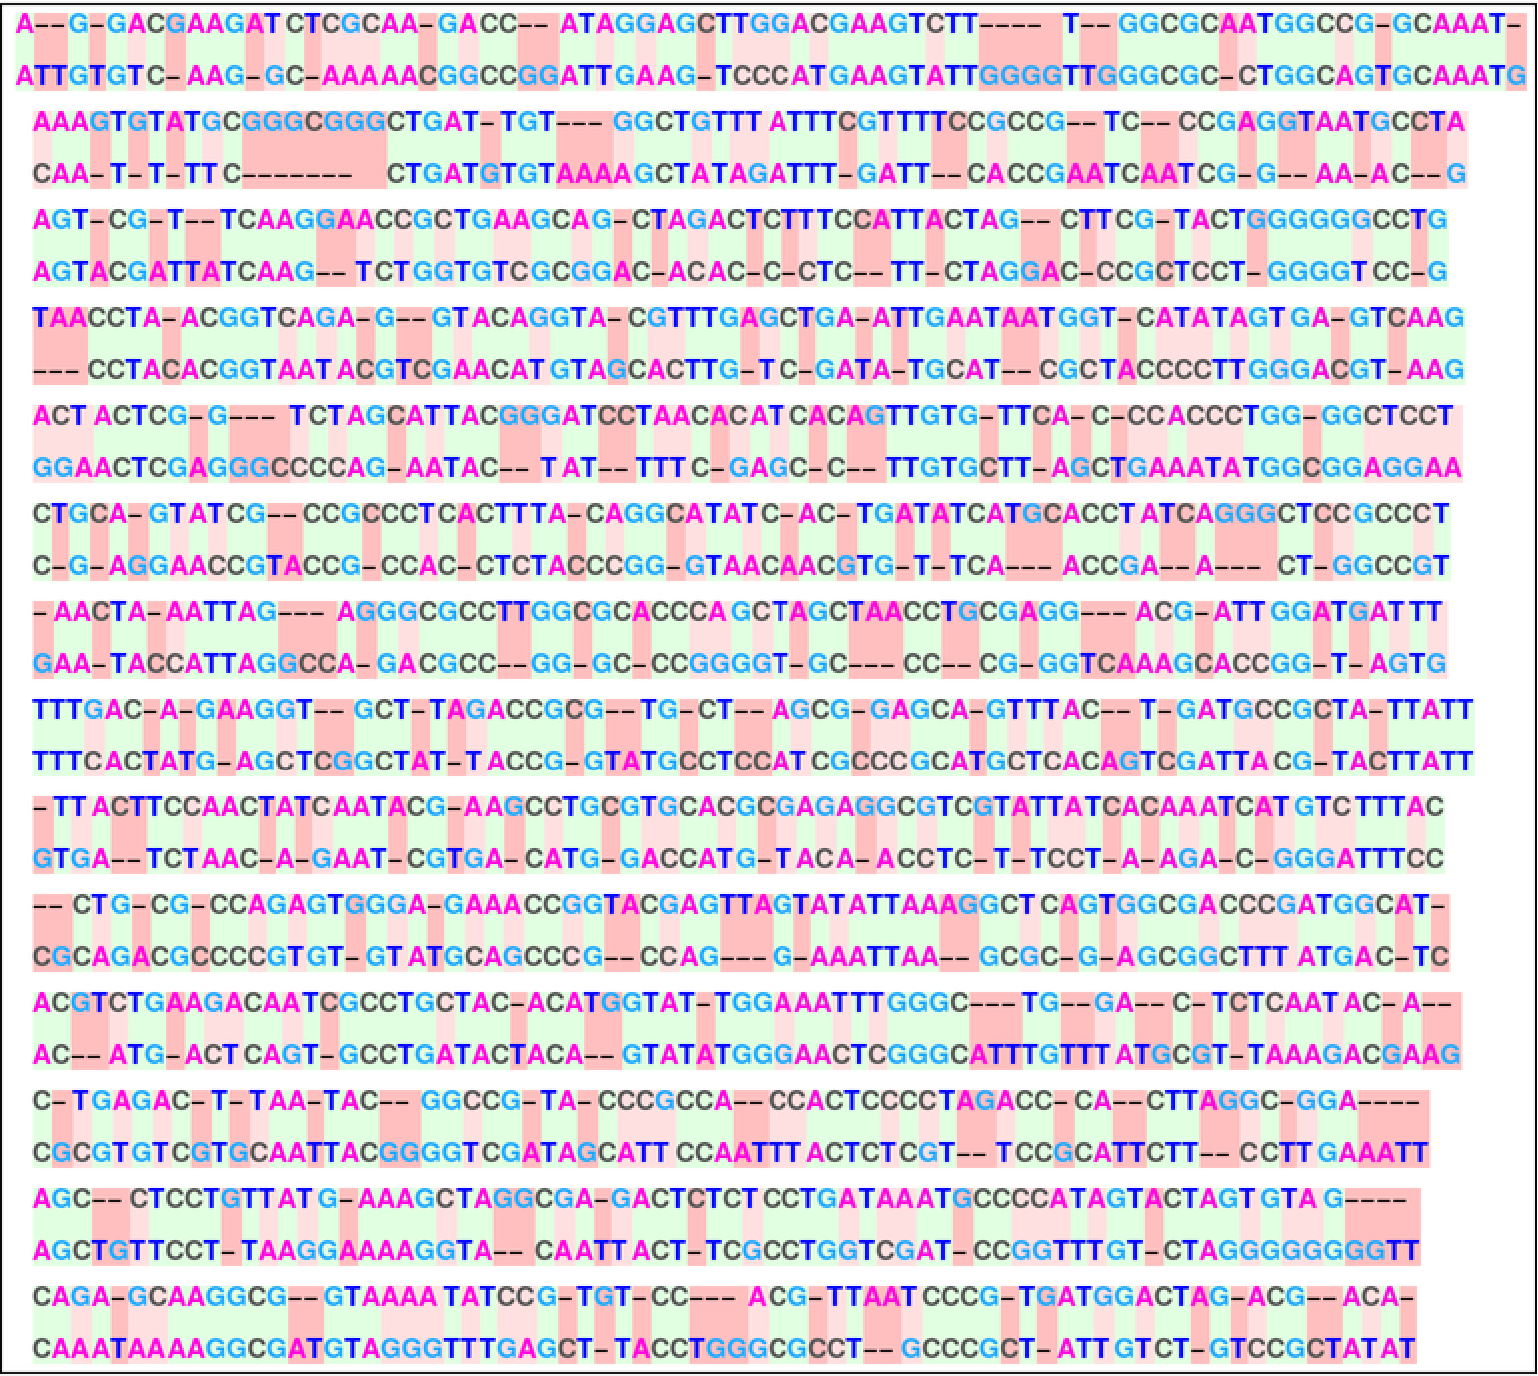
![ResourceFunction["DNAAlignmentPlot"][
Entity["Gene", {"INS", {"Species" -> "HomoSapiens"}}][
"ReferenceSequence"], \!\(\*
NamespaceBox["LinguisticAssistant",
DynamicModuleBox[{Typeset`query$$ = "chimp insulin gene", Typeset`boxes$$ = TemplateBox[{"\"insulin\"",
RowBox[{"Entity", "[",
RowBox[{"\"Gene\"", ",",
RowBox[{"{",
RowBox[{"\"INS\"", ",",
RowBox[{"{",
RowBox[{"\"Species\"", "->", "\"PanTroglodytes\""}], "}"}]}], "}"}]}],
"]"}], "\"Entity[\\\"Gene\\\", {\\\"INS\\\", {\\\"Species\\\" -> \\\"PanTroglodytes\\\"}}]\"", "\"gene\""}, "Entity"], Typeset`allassumptions$$ = {}, Typeset`assumptions$$ = {}, Typeset`open$$ = {1, 2}, Typeset`querystate$$ = {"Online" -> True, "Allowed" -> True, "mparse.jsp" -> 0.504462, "Messages" -> {}}},
DynamicBox[ToBoxes[
AlphaIntegration`LinguisticAssistantBoxes["", 4, Automatic,
Dynamic[Typeset`query$$],
Dynamic[Typeset`boxes$$],
Dynamic[Typeset`allassumptions$$],
Dynamic[Typeset`assumptions$$],
Dynamic[Typeset`open$$],
Dynamic[Typeset`querystate$$]], StandardForm],
ImageSizeCache->{112.25, {8.125, 17.125}},
TrackedSymbols:>{Typeset`query$$, Typeset`boxes$$, Typeset`allassumptions$$, Typeset`assumptions$$, Typeset`open$$, Typeset`querystate$$}],
DynamicModuleValues:>{},
UndoTrackedVariables:>{Typeset`open$$}],
BaseStyle->{"Deploy"},
DeleteWithContents->True,
Editable->False,
SelectWithContents->True]\)["ReferenceSequence"]]](https://www.wolframcloud.com/obj/resourcesystem/images/0d4/0d48e3b9-eb38-4264-ad69-2f923925d24e/5a8e691dab614115.png)
![ResourceFunction["DNAAlignmentPlot"][
Entity["Gene", {"LALBA", {"Species" -> "BosTaurus"}}][
"ReferenceSequence"], Entity["Gene", {"LALBA", {"Species" -> "CanisLupusFamiliaris"}}][
"ReferenceSequence"]]](https://www.wolframcloud.com/obj/resourcesystem/images/0d4/0d48e3b9-eb38-4264-ad69-2f923925d24e/1cc67282aa179eb5.png)