Wolfram Function Repository
Instant-use add-on functions for the Wolfram Language
Function Repository Resource:
Create a chart showing diminishing quantities surviving stages of a process
ResourceFunction["FunnelChart"][data] shows a list of the numerical values in data as a funnel. | |
ResourceFunction["FunnelChart"][<|"lbl1"→val1,"lbl2"→val2,…|>] shows values vali as a funnel labeled with the lbli. |
| "EdgeStyle" | Black | style for the EdgeForm of the funnel |
| "ProportionTextStyle" | Automatic | style for appearance element "Proportion" |
| "SpacingStyle" | GrayLevel[0.9] | style for transitions between funnel stages |
| "StepProportionTextStyle" | Automatic | style for appearance element "StepProportion" |
| "ValueTextStyle" | Automatic | style for appearance element "Value" |
| AppearanceElements | None | list of text elements to display on each stage |
| ChartLabels | Automatic | list of labels for each stage of the funnel |
| ColorFunction | Automatic | function giving the color of each funnel stage |
| InterpolationOrder | 1 | shape of the funnel stages |
| Spacings | 0.04 | space to allow for transitions between stages |
Display a funnel chart for a process where 10 items entered the process, but only 1 completed it:
| In[1]:= |
| Out[1]= | 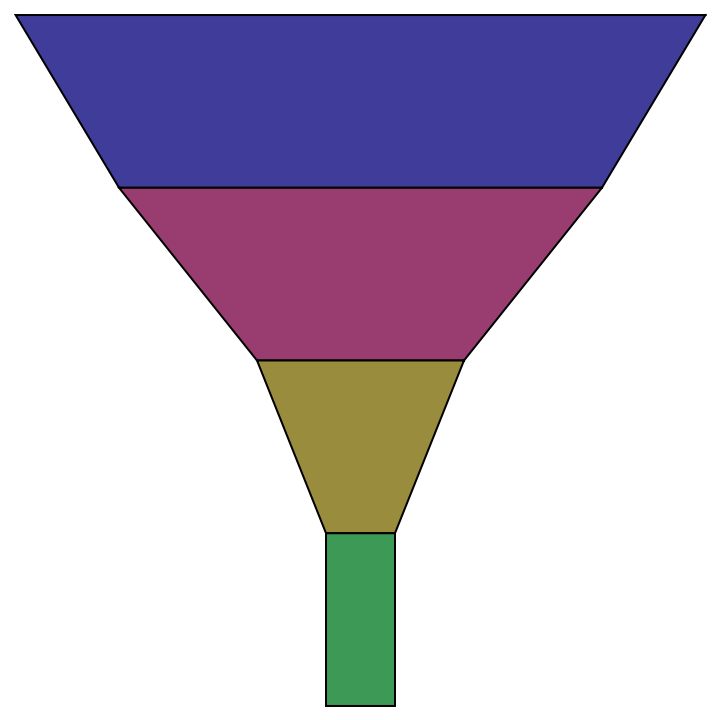 |
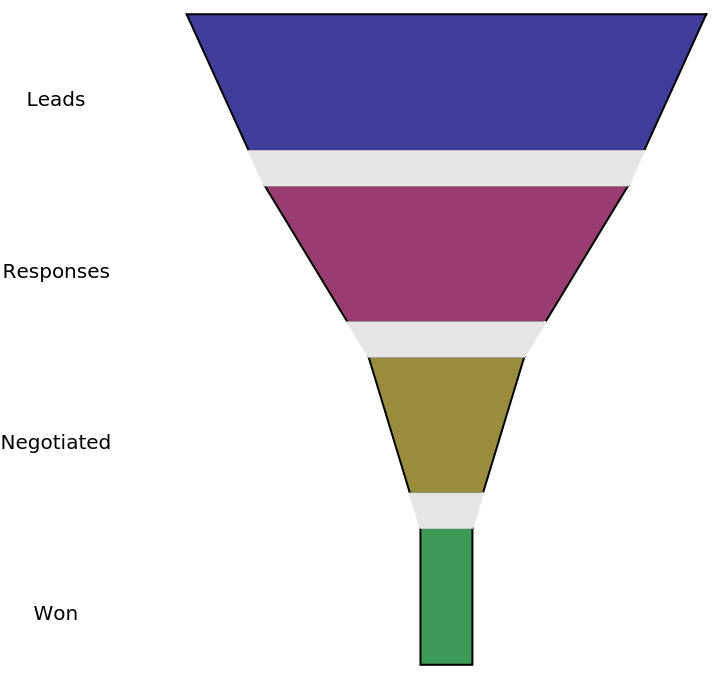
Funnel charts are often used to describe business processes where there is a loss between stages. For example, sales leads being developed into sales:
| In[2]:= |
| Out[2]= |  |
While it is not the typical usage, it is possible to give use data that is not monotonically decreasing:
| In[3]:= |
| Out[3]= | 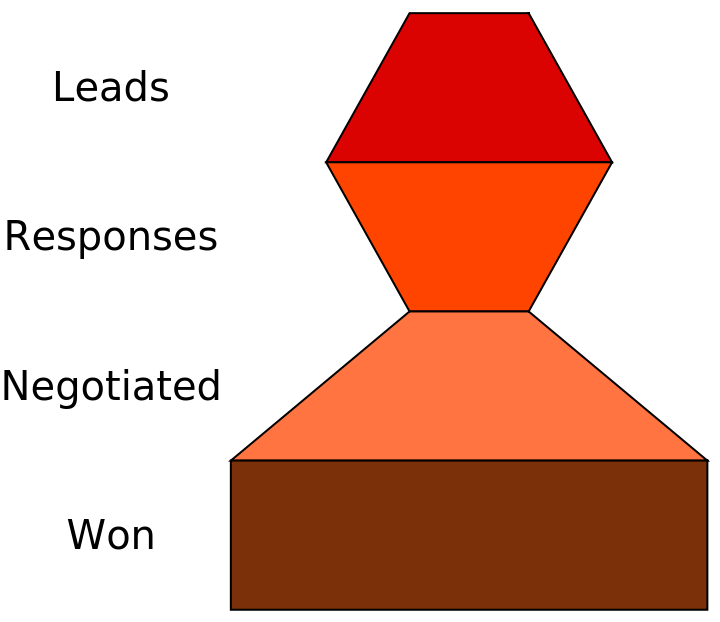 |
AppearanceElements controls which numbers are displayed on the FunnelChart. There are three choices. "Values" displays the raw data:
| In[4]:= |
| Out[4]= | 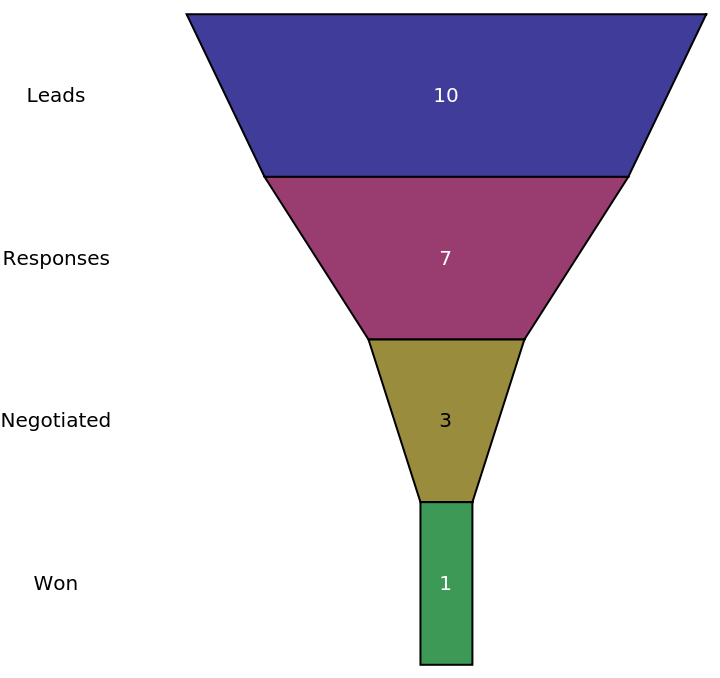 |
"Proportion" displays the data as a proportion of the first value in the funnel:
| In[5]:= |
| Out[5]= | 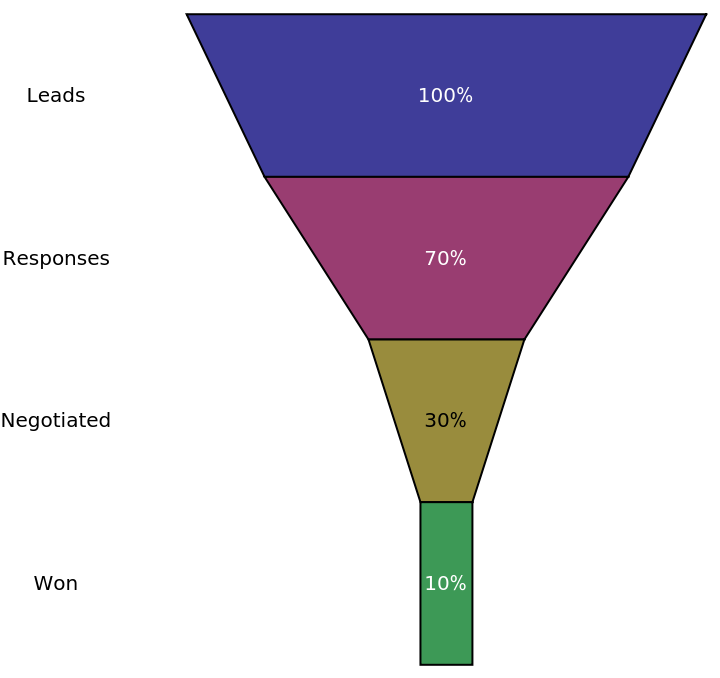 |
"StepProportion" displays the data as a proportion of the previous stage of the process:
| In[6]:= |
| Out[6]= |  |
Multiple AppearanceElements can be given as a list or by using the value All:
| In[7]:= |
| Out[7]= | 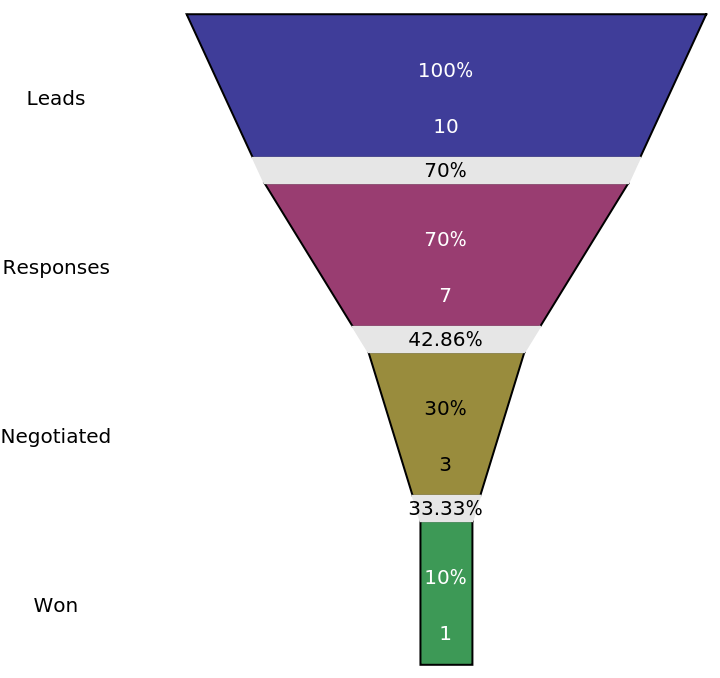 |
All text contents are subject to styles given with BaseStyle. AppearanceElements can be individually styled with "ValueTextStyle", "ProportionTextStyle" and "StepProportionTextStyle":
| In[8]:= | ![ResourceFunction[
"FunnelChart"][<|"Leads" -> 10, "Responses" -> 7, "Negotiated" -> 3, "Won" -> 1|>,
AppearanceElements -> All, Spacings -> 0.15,
"ValueTextStyle" -> Directive[LightGray, FontSize -> 20], "ProportionTextStyle" -> Directive[White, FontSize -> 20] , "StepProportionTextStyle" -> Directive[Red, FontSize -> 9], BaseStyle -> {30, Gray}]](https://www.wolframcloud.com/obj/resourcesystem/images/39f/39fcda15-ff2f-47b2-ac5d-e86f8f5bd6bf/4761cbb757ad8708.png) |
| Out[8]= | 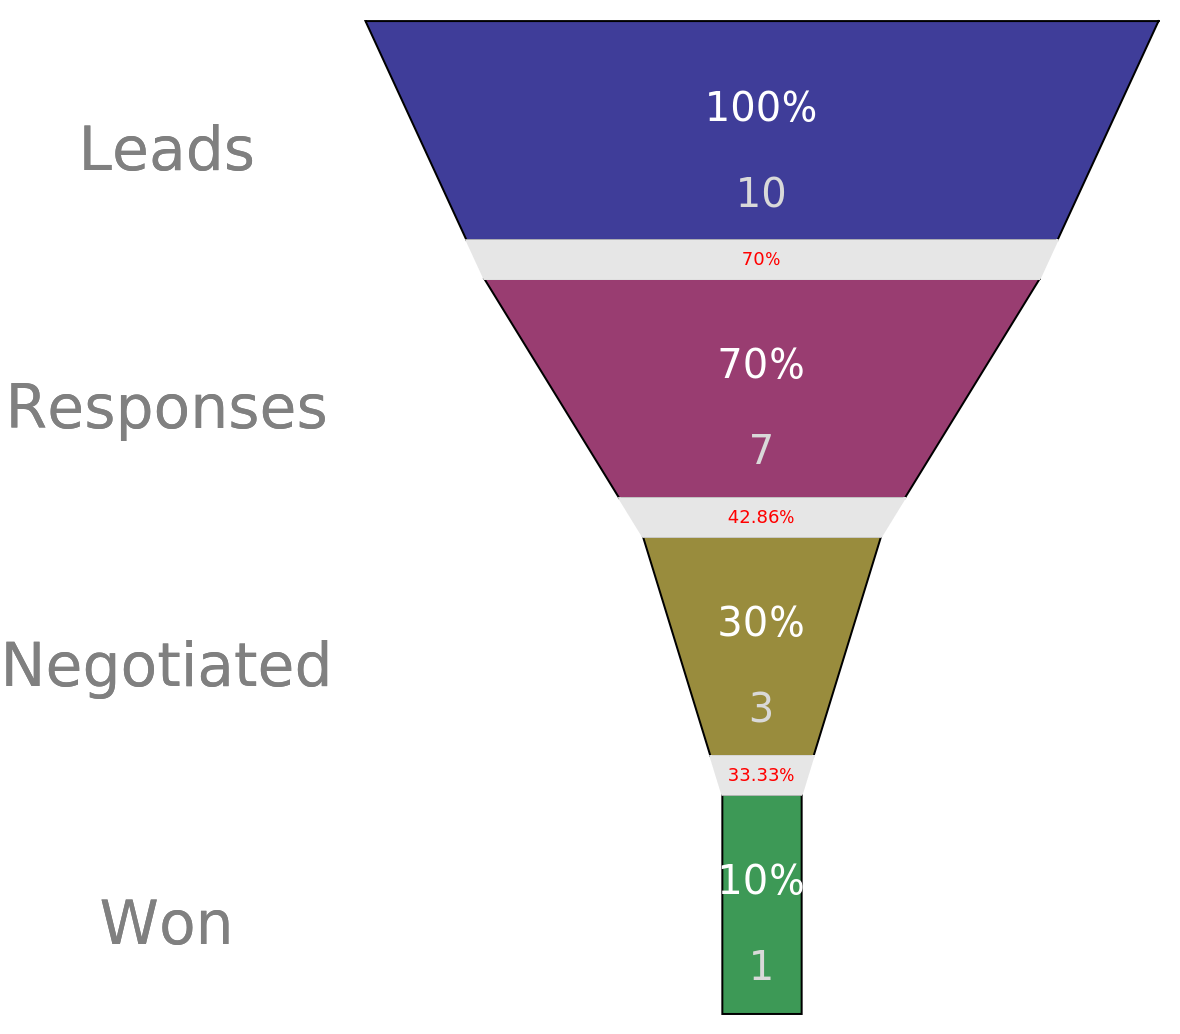 |
Funnel colors can be given with any ColorFunction that accepts integer values from 1 to the number of stages:
| In[9]:= |
| Out[9]= | 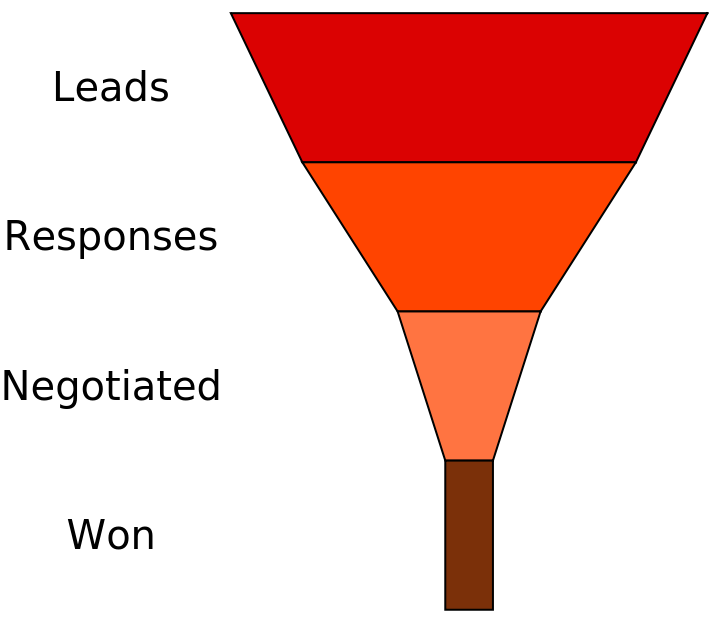 |
InterpolationOrder controls the shape of the funnel stages. Typical values are 0, 1 or 2:
| In[10]:= |
| Out[10]= | 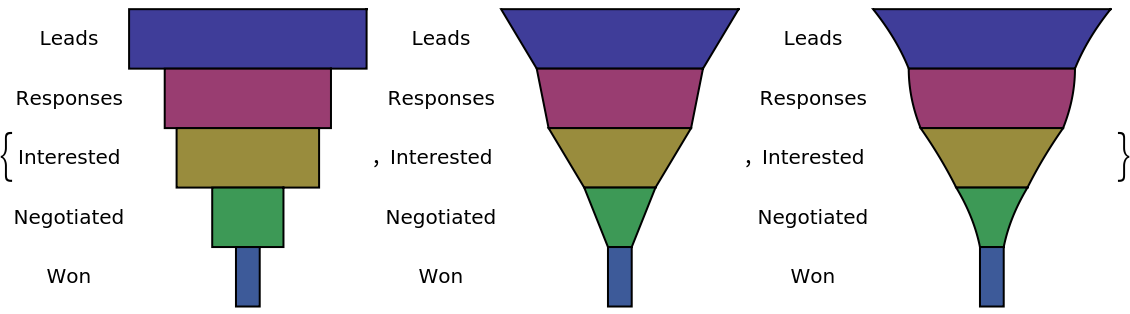 |
Control the style of spacings with "SpacingStyle":
| In[12]:= |
| Out[12]= | 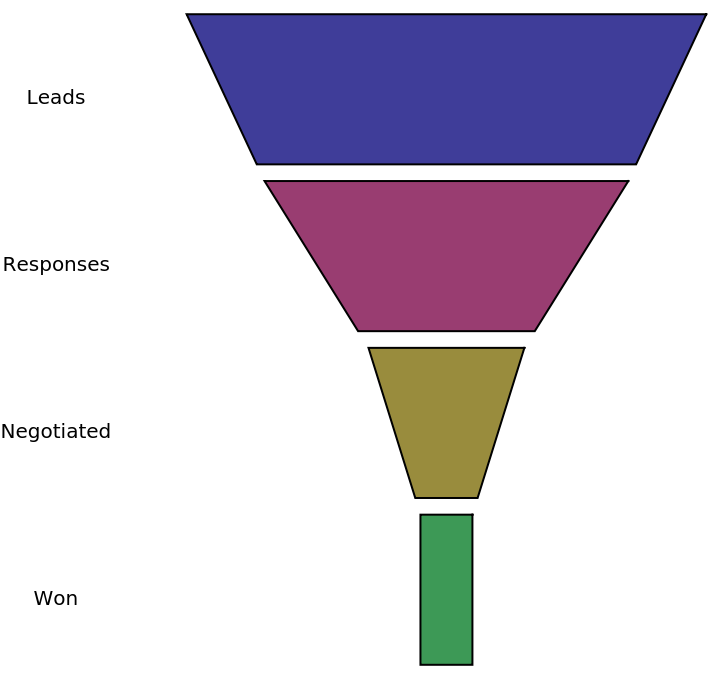 |
This work is licensed under a Creative Commons Attribution 4.0 International License