Wolfram Function Repository
Instant-use add-on functions for the Wolfram Language
Function Repository Resource:
Display a chart with steps of a process that repeats
ResourceFunction["CircleFlowChart"][labels] creates a chart displaying repeating steps of a process. |
| "AngleOrigin" | angle of first item in chart | |
| "ArrowLength" | 0.9 | proportion of gap between items filled by arrows |
| "ArrowStyles" | Arrowheads[{{0.1,0.5}}] | style directives for arrows |
| "CircleBackground" | None | background color for interior of chart |
Create a basic CircleFlowChart of three items:
| In[1]:= |
| Out[1]= |  |
The first item is placed at the angle given by "AngleOrigin" and other items are spaced equally:
| In[2]:= |
| Out[2]= |  |
"ArrowLength" can be used to shorten the arrows, providing more room for the items:
| In[3]:= |
| Out[3]= |  |
"CircleBackground" can be controlled separately from the graphics Background:
| In[4]:= |
| Out[4]= | 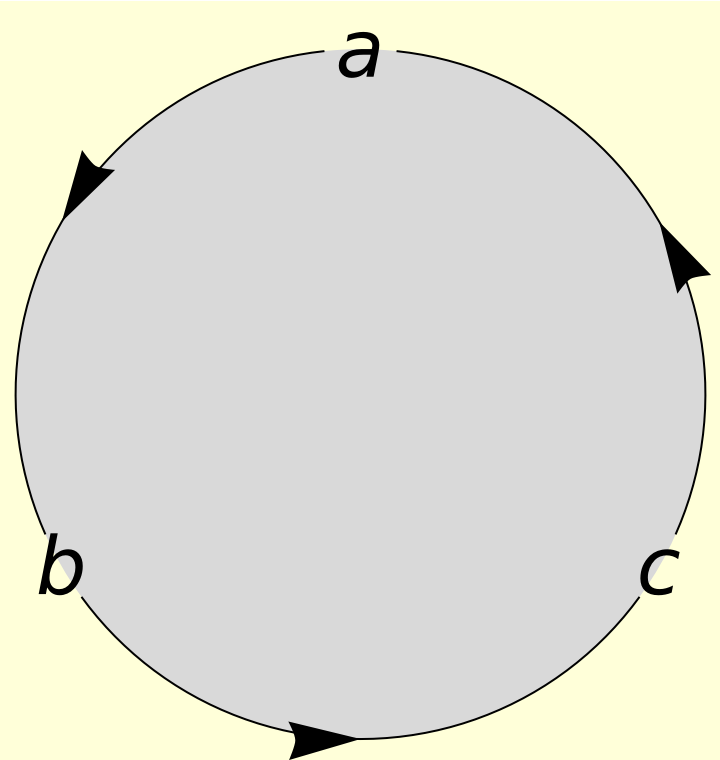 |
Arrows can be styled with "ArrowStyles" for example to reverse the direction of flow:
| In[5]:= |
| Out[5]= |  |
Design an icon suitable for an organization:
| In[6]:= | ![ResourceFunction[
"CircleFlowChart"][{"Define", "Abstract", "Compute", "Interpret"}, BaseStyle -> 20, Epilog -> Inset[Import[
"https://www.computerbasedmath.org/assets/img/about/cbm-logo@2x.png"]], "ArrowLength" -> 0.6]](https://www.wolframcloud.com/obj/resourcesystem/images/a46/a46ee530-1209-4d12-8ec3-d8ec03a08264/0ff011246eb7c0f5.png) |
| Out[6]= |  |
This work is licensed under a Creative Commons Attribution 4.0 International License