Wolfram Function Repository
Instant-use add-on functions for the Wolfram Language
Function Repository Resource:
Display a chart of scaled counts of elements in a list
ResourceFunction["ScaledRankChart"][list] displays a chart of ranked counts of elements in a given list. |
| ImageSize | Automatic | how big the chart should be |
| LabelStyle | None | style to apply to label texts |
| "Logarithmic" | True | whether chart area is a linear or logarithmic function of frequency |
| LogPower | 1/2 | power p to use in pie-chart area formula: Log[1+count]*countp |
| MaxItems | 40 | max number of items beyond which they are lumped in the category “other” |
| "MinCount" | None | minimum count, beyond which they are lumped in category “other” |
| "NumberExamples" | 10 | number of examples to use in 2-argument form |
| "OtherChart" | False | whether to allow mousing-over the “other” category to see next section of distribution |
| "Rotation" | Automatic | how much to rotate the starting sector axis |
| "ShowCounts" | True | whether to show counts next to each chart element |
| "Tooltips" | None | rules mapping elements to tooltips |
| "Type" | PieChart | the type of chart displayed (BarChart or PieChart) |
| "UseLegend" | False | whether to show a separate legend box |
Show a chart of the distribution of random variables:
| In[1]:= |
| In[2]:= |
| Out[2]= |
| In[3]:= |
| Out[3]= | 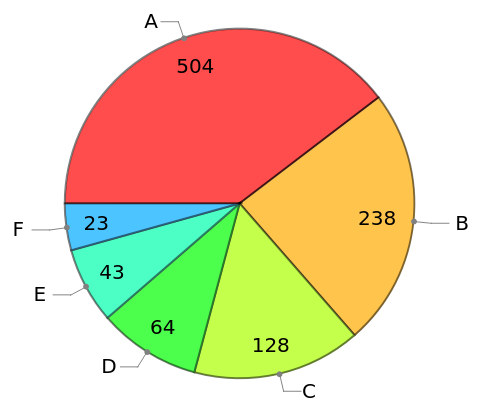 |
Rapidly-dwindling distributions are still legible:
| In[4]:= |
| Out[5]= |
| In[6]:= | ![ResourceFunction["ScaledRankChart"][data, MaxItems -> 10, "UseLegend" -> True, LabelStyle -> Directive[FontColor -> GrayLevel[.2], FontWeight -> Normal, FontSize -> 16], ImageSize -> 300]](https://www.wolframcloud.com/obj/resourcesystem/images/7b7/7b7f02c3-5349-48bb-9143-c2efed5ad056/562acd09ca64884c.png) |
| Out[6]= | 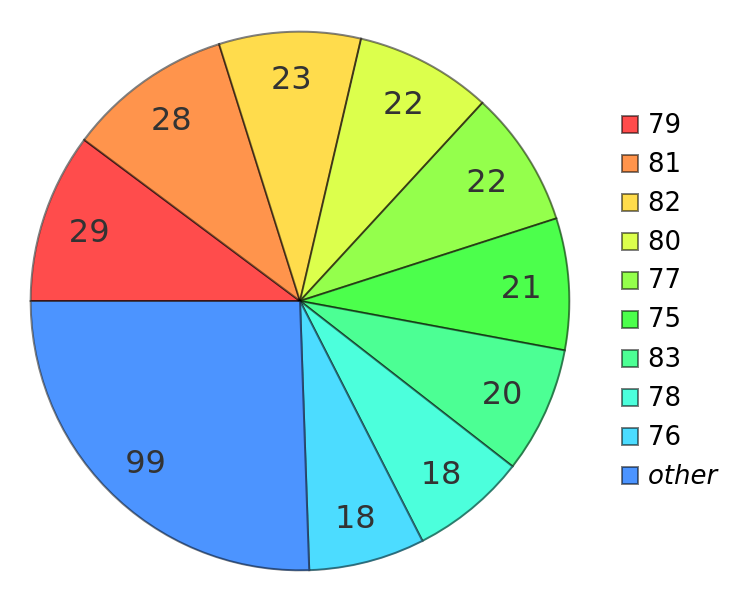 |
Chart the ranked distribution of random variables:
| In[7]:= |
| Out[7]= | 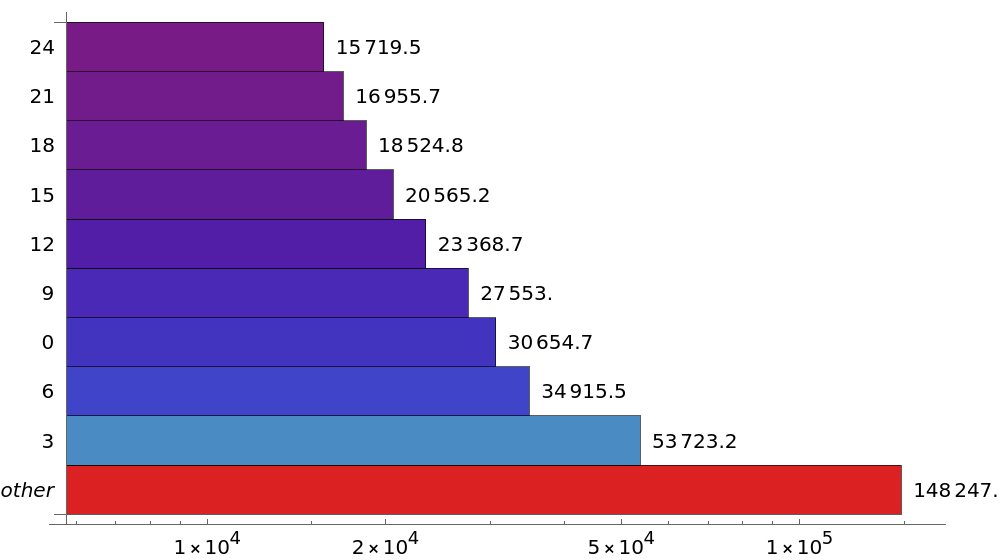 |
Tokenize the text of Alice in Wonderland:
| In[8]:= | ![text = ExampleData[{"Text", "AliceInWonderland"}];
words = DeleteStopwords@
ToLowerCase[
StringSplit[text, Alternatives @@ Characters[" ,|.!?;\"-()"]]]~
DeleteCases~""; Take[words, 5]](https://www.wolframcloud.com/obj/resourcesystem/images/7b7/7b7f02c3-5349-48bb-9143-c2efed5ad056/45acb1d02f417eea.png) |
| Out[9]= |
Display the distribution of words in the text, grouping elements making up less than 1% under the category “other”:
| In[10]:= | ![Manipulate[
ResourceFunction["ScaledRankChart"][words, "MinCount" -> minCount, ImageSize -> 300], {{minCount, .006}, 0.004, 0.0086}, ControlPlacement -> Top]](https://www.wolframcloud.com/obj/resourcesystem/images/7b7/7b7f02c3-5349-48bb-9143-c2efed5ad056/3153f0049ae508f5.png) |
| Out[10]= | 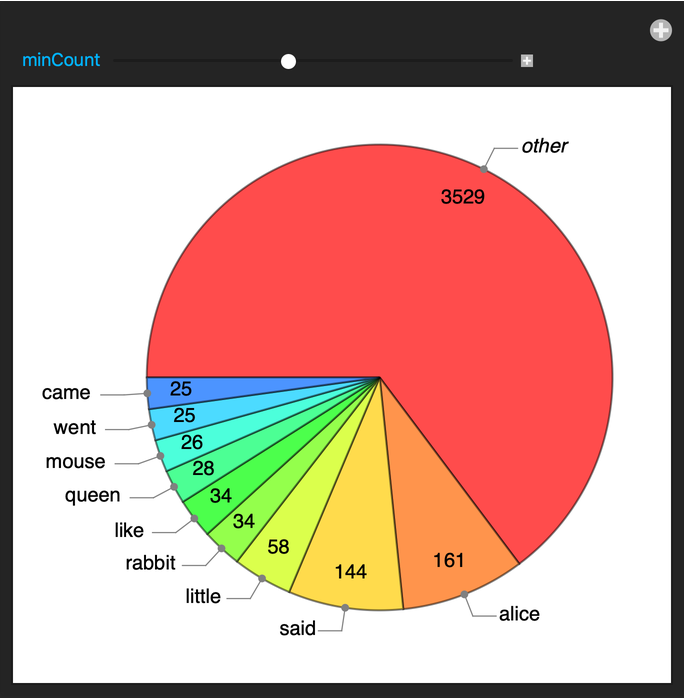 |
This work is licensed under a Creative Commons Attribution 4.0 International License