Examples
Basic Examples (1)
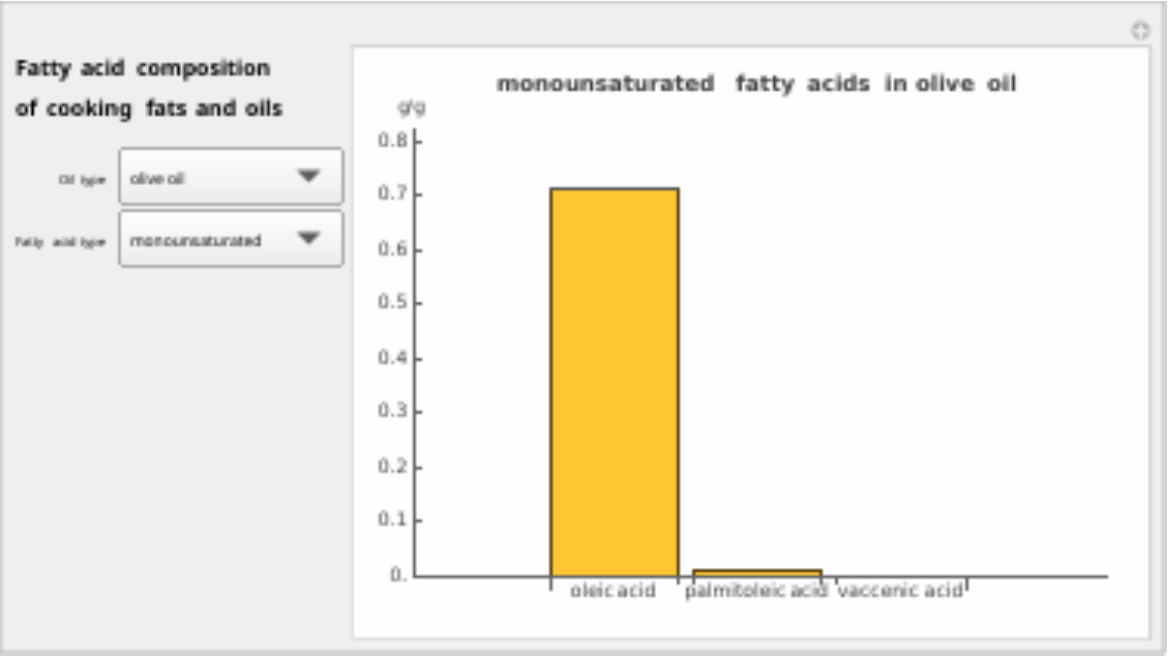
Display the interactive BarChart to select an oil type and fatty acid type:
Scope (3)
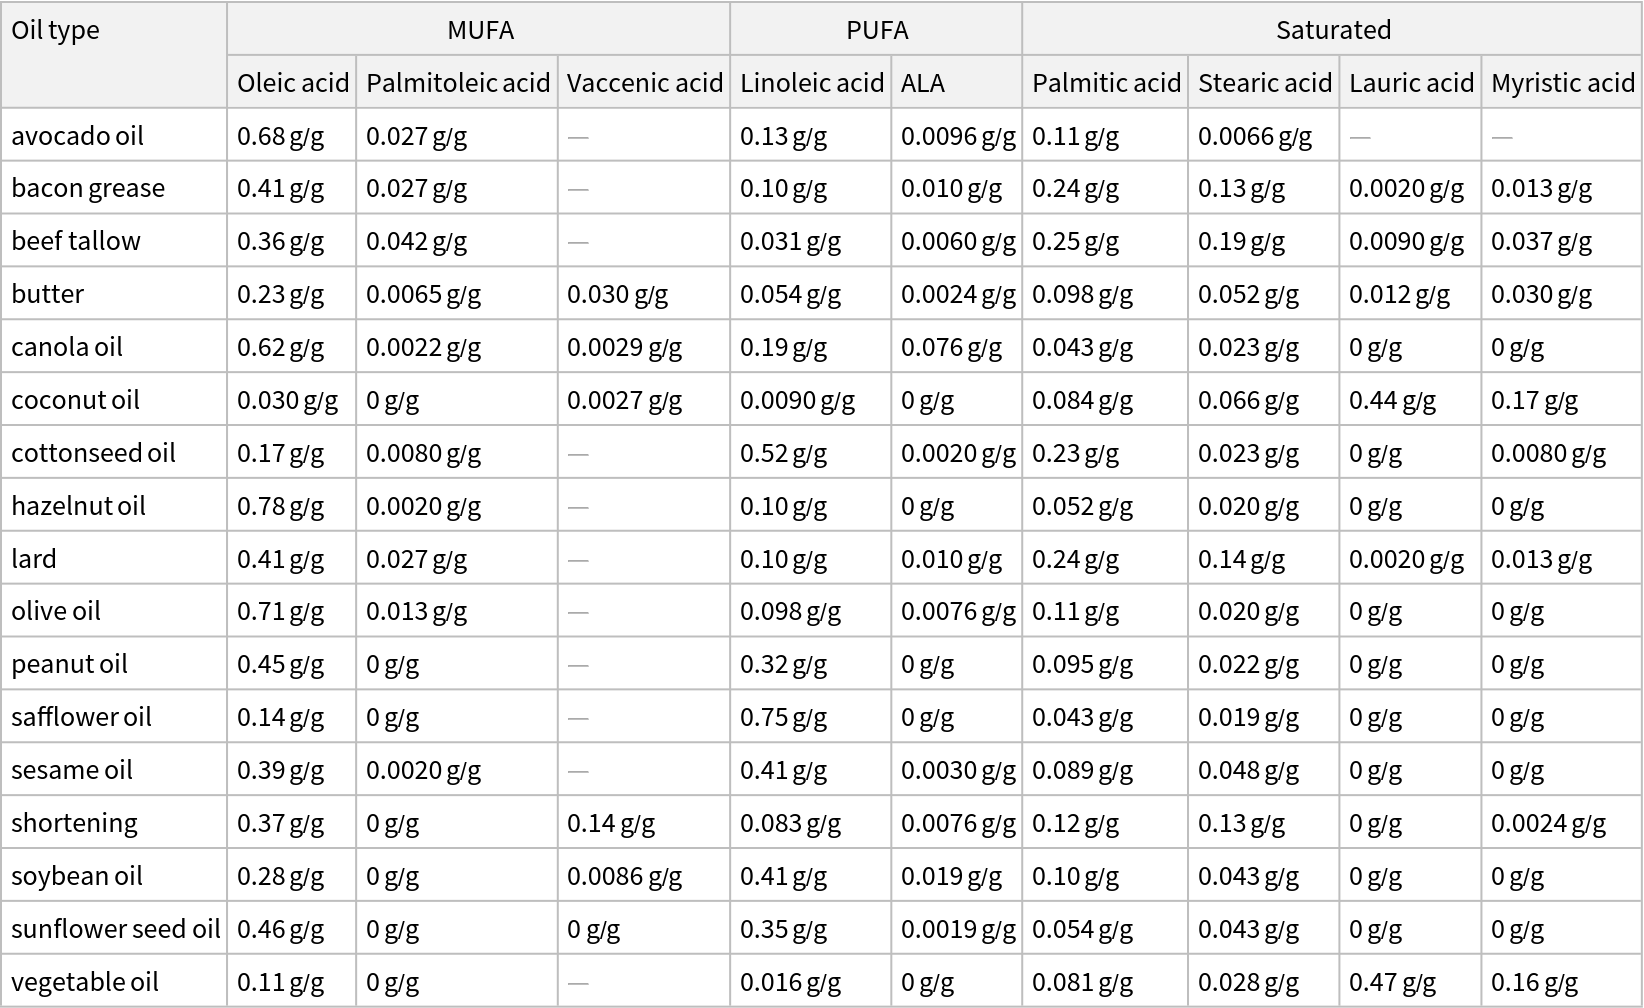
Display the categorized fatty acids data as a Dataset:
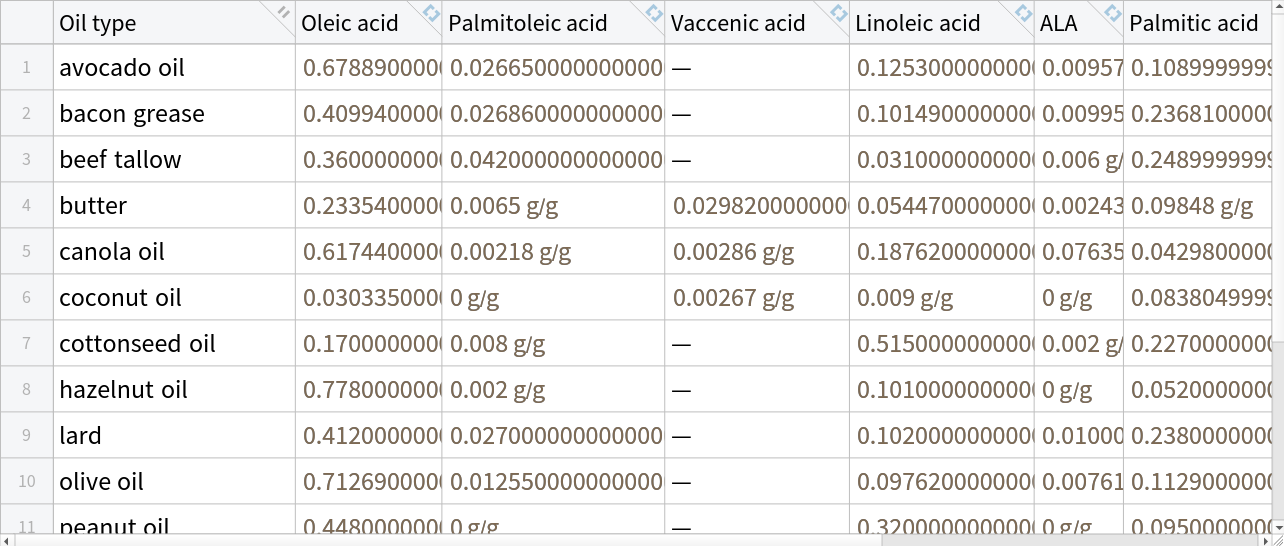
Display the data as a Tabular object:
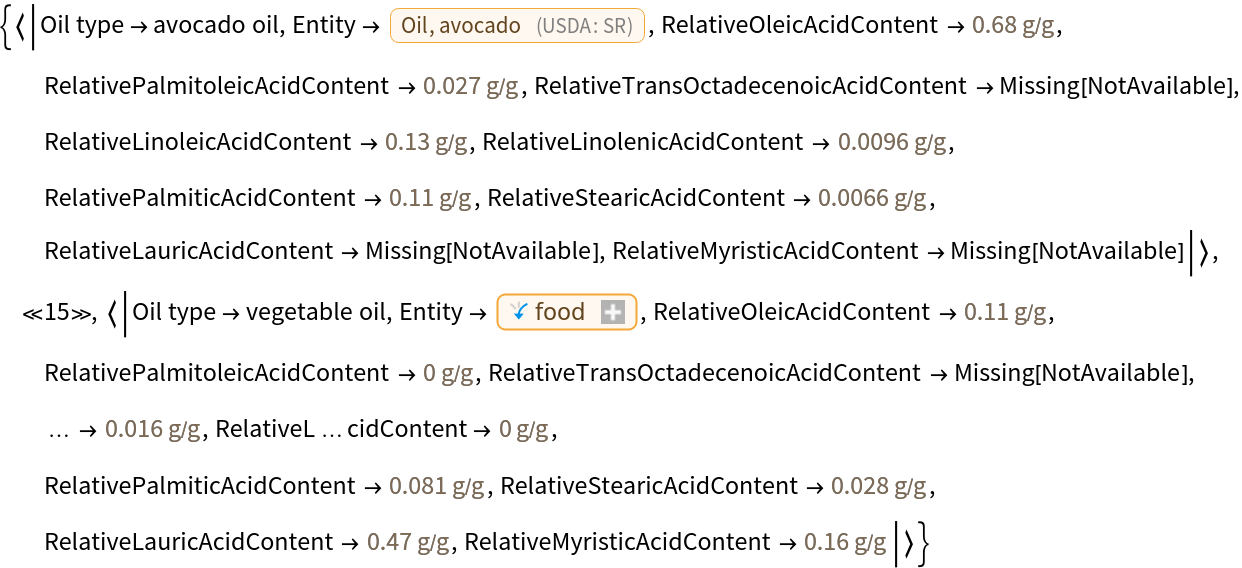
Display associations of the complete data, including food entities and full property names:
Applications (1)
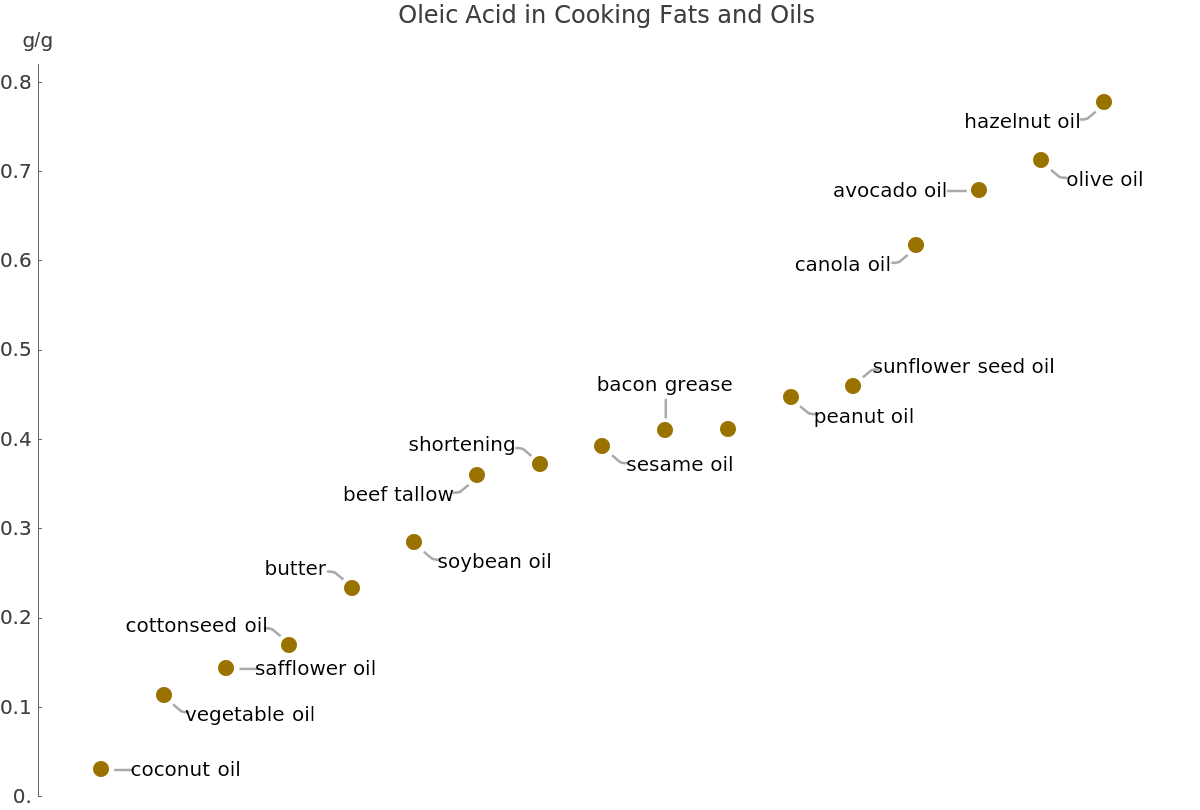
Sort the Tabular data according to the monounsaturated oleic acid content with SortBy, then display the oleic acid in all of the cooking fats and oils with ListPlot:
Neat Examples (4)
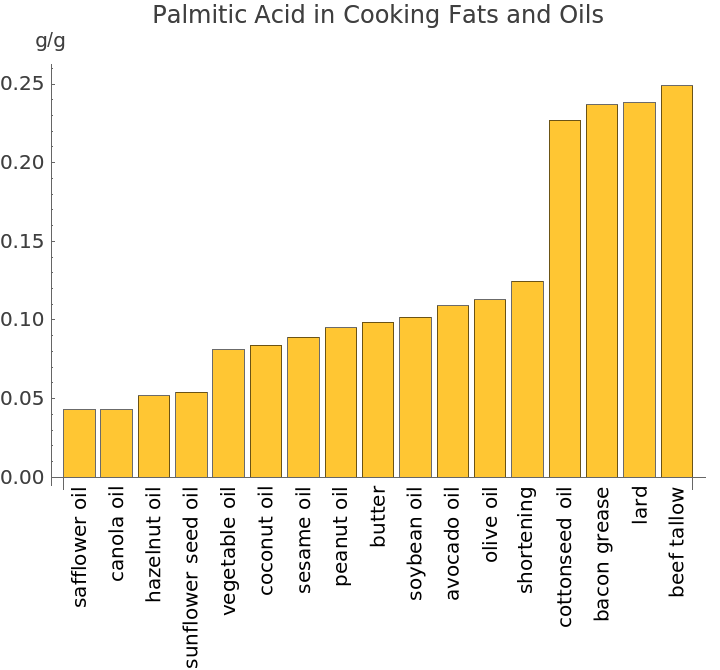
BarChart is another effective way to visualize the fatty acids data. In this case, the data is sorted according to the amount of saturated palmitic acid:
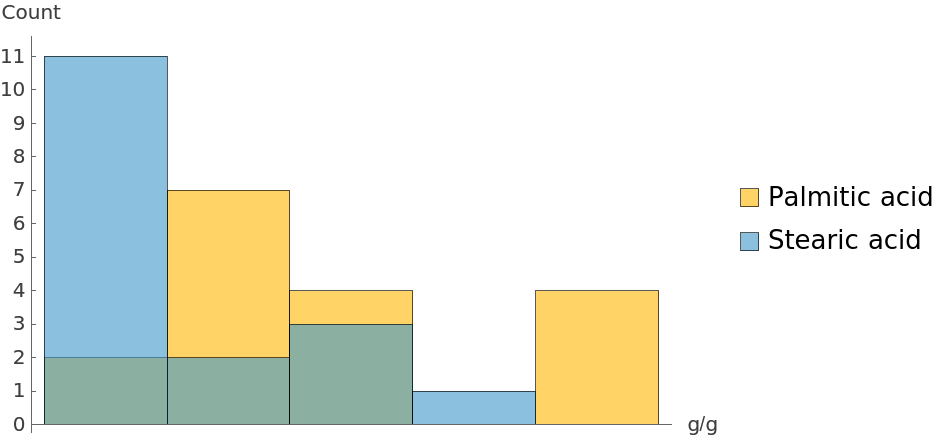
Use Histogram to group the values for two saturated fatty acids (palmitic acid and stearic acid) into bins and see how frequently they occur:
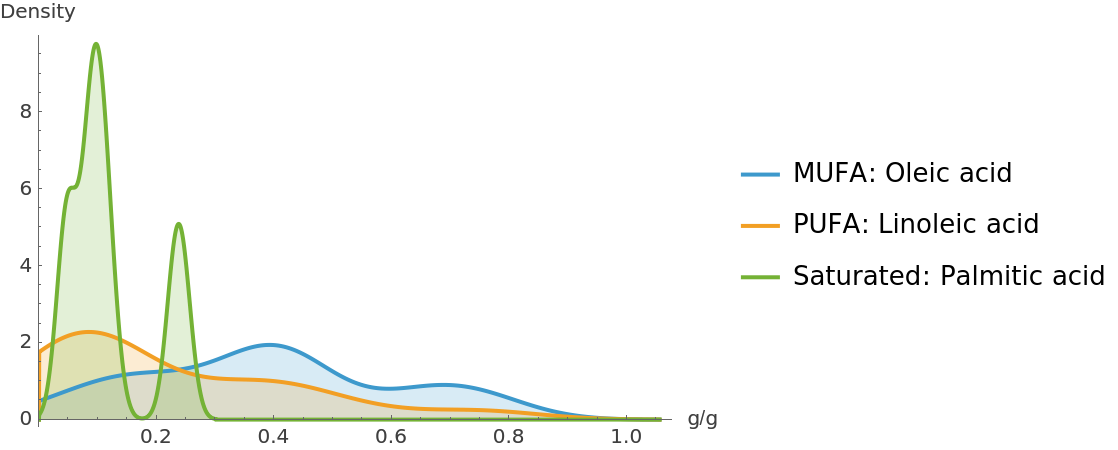
Visualize and compare the distribution of values for the most dominant fatty acid in each category—a MUFA, a PUFA and a saturated fatty acid. SmoothHistogram replaces the discrete bins of Histogram with a continuous curve to show the shape and overlap of the distributions. The curve represents the probability density, rather than a raw count:
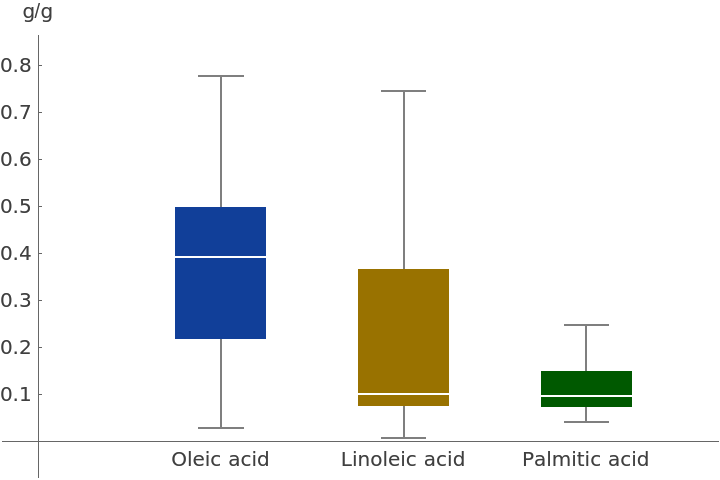
BoxWhiskerChart displays the minimum, median and maximum values for the three dominant fatty acids, as well as the interquartile range:
Requirements
Wolfram Language 13.0
(December 2021) or above
Version History
-
1.1.0
– 01 May 2026
-
1.0.0
– 25 March 2026
Related Resources
![tabularData = ResourceFunction["FattyAcidsExplorer"]["Tabular"];
sortedOleicAcid = SortBy[tabularData, "Oleic acid"];
ListPlot[sortedOleicAcid -> "Oleic acid", Sequence[
Axes -> {False, True}, AxesLabel -> "g/g", Ticks -> {None,
Range[0, 0.8, 0.1]}, PlotRange -> {0, 0.8 + 0.02}, PlotLabel -> "Oleic Acid in Cooking Fats and Oils", PlotStyle -> DarkYellow, LabelingFunction -> (sortedOleicAcid[
Part[#2, 2], "Oil type"]& )]]](https://www.wolframcloud.com/obj/resourcesystem/images/2be/2be9fd14-e24c-4022-848d-6c9d72592878/1-0-0/6e0ead5abac29ed5.png)
![tabularData = ResourceFunction["FattyAcidsExplorer"]["Tabular"];
sortedPalmiticAcid = SortBy[tabularData, "Palmitic acid"];
palmiticAcidValues = sortedPalmiticAcid[All, "Palmitic acid"];
oilTypes = sortedPalmiticAcid[All, "Oil type"];
BarChart[palmiticAcidValues, Sequence[ChartLabels -> Placed[
Map[Rotate[#, Pi/2]& , oilTypes], Below], AxesLabel -> {Automatic, "g/g"}, PlotLabel -> "Palmitic Acid in Cooking Fats and Oils"]]](https://www.wolframcloud.com/obj/resourcesystem/images/2be/2be9fd14-e24c-4022-848d-6c9d72592878/1-0-0/795f99374a783300.png)