Wolfram Function Repository
Instant-use add-on functions for the Wolfram Language
Function Repository Resource:
Explore the fatty acid composition of cooking fats and oils
ResourceFunction["FattyAcidsExplorer"][] creates an interactive BarChart for exploring the fatty acid content in 18 cooking fats and oils. | |
ResourceFunction["FattyAcidsExplorer"][format] returns the fatty acid content for all oil types in the data in the specified format. | |
ResourceFunction["FattyAcidsExplorer"][oil type] returns a full fatty acid profile for the specified oiltype. | |
ResourceFunction["FattyAcidsExplorer"][oil type,category] returns the fatty acid content for the specified category of the specified oiltype. |
| "Dataset" | returns a Dataset of the fatty acids content in 18 cooking fats and oils |
| "Tabular" | returns the oil types and associated fatty acids content as a Tabular object |
| "Data" | returns associations of the complete data, including food entities and full property names |
Display the interactive BarChart to select an oil type and fatty acid type:
| In[1]:= |
| Out[1]= | 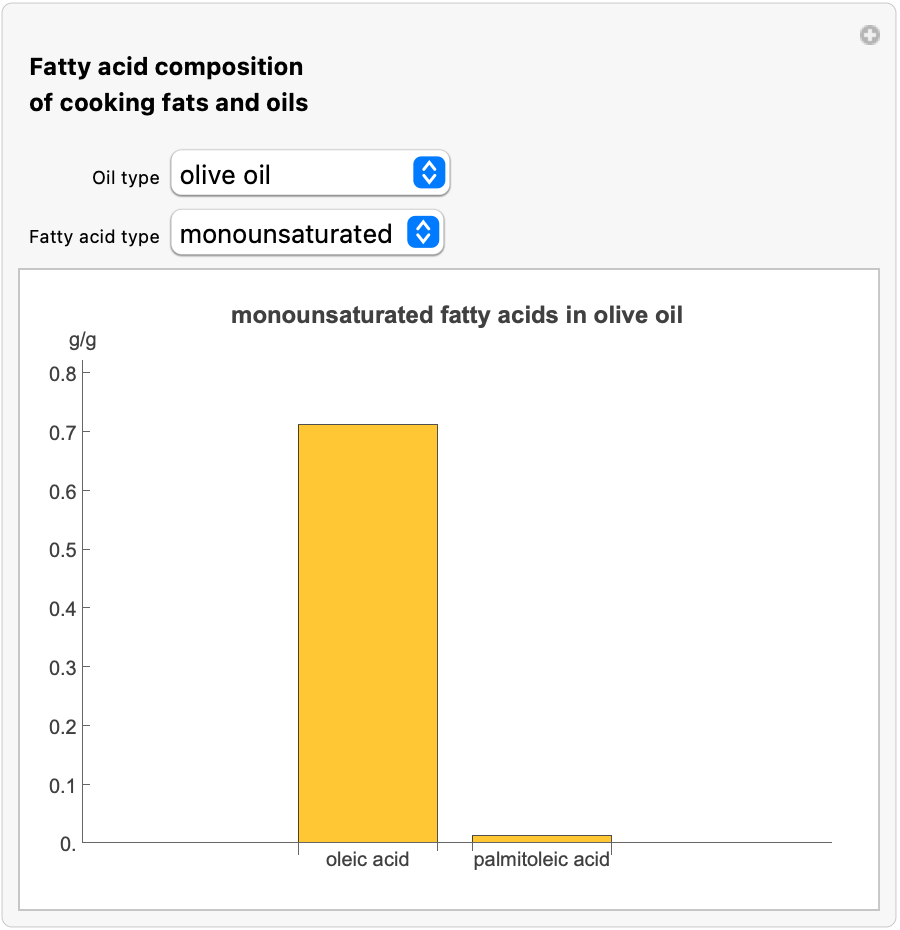 |
Get the full fatty acid profile for a single fat or oil type:
| In[2]:= |
| Out[2]= | 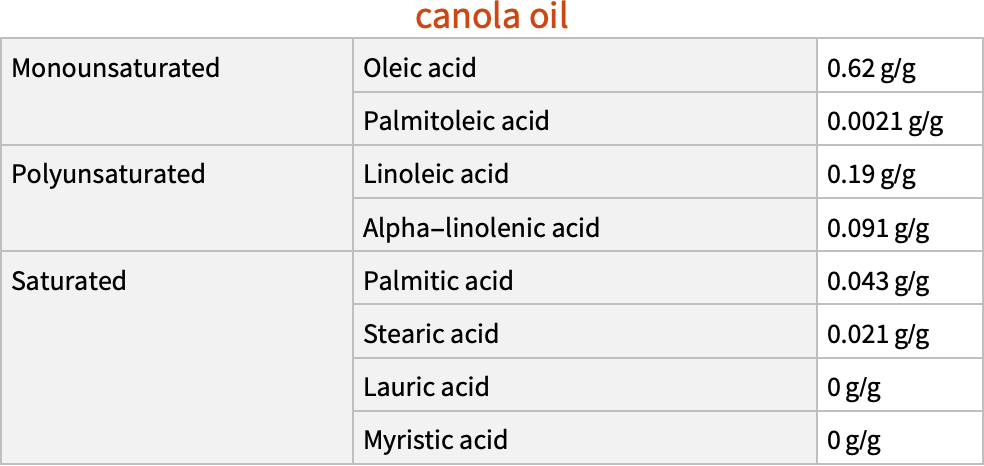 |
Get a single fatty acid category for a specified fat or oil type:
| In[3]:= |
| Out[3]= | 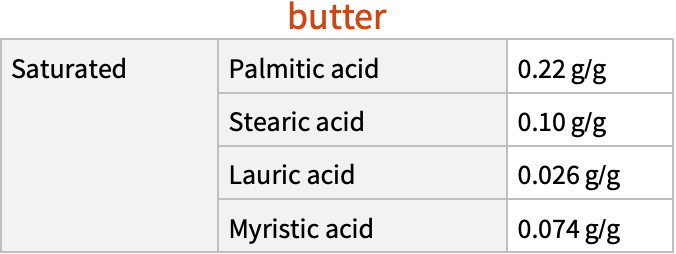 |
Display the categorized fatty acids data as a Dataset:
| In[4]:= |
| Out[4]= | 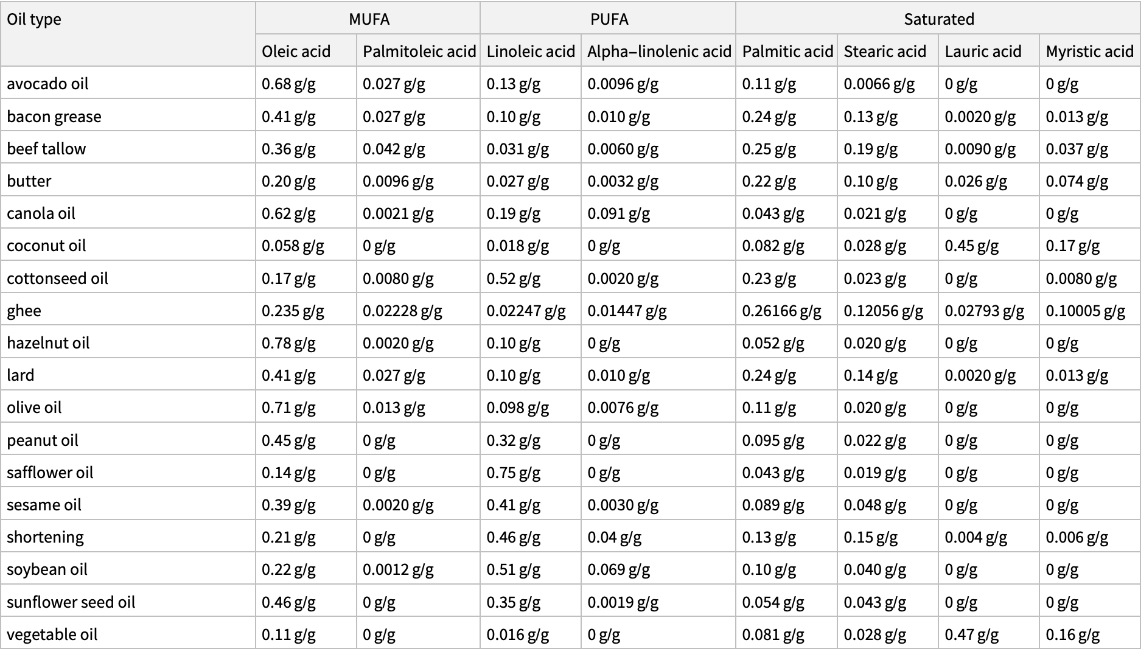 |
Display the data as a Tabular object:
| In[5]:= |
| Out[5]= | 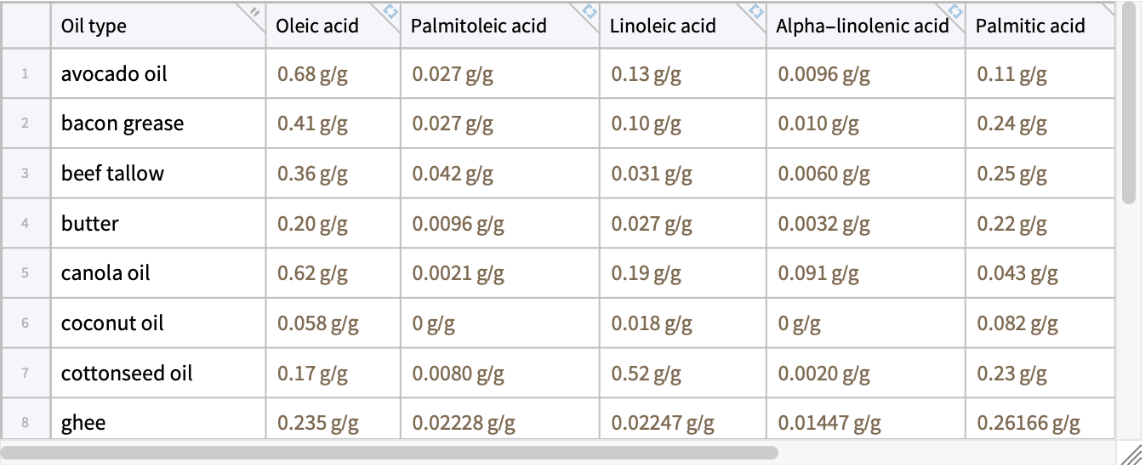 |
Display associations of the complete data, including food entities and full property names:
| In[6]:= |
| Out[6]= | 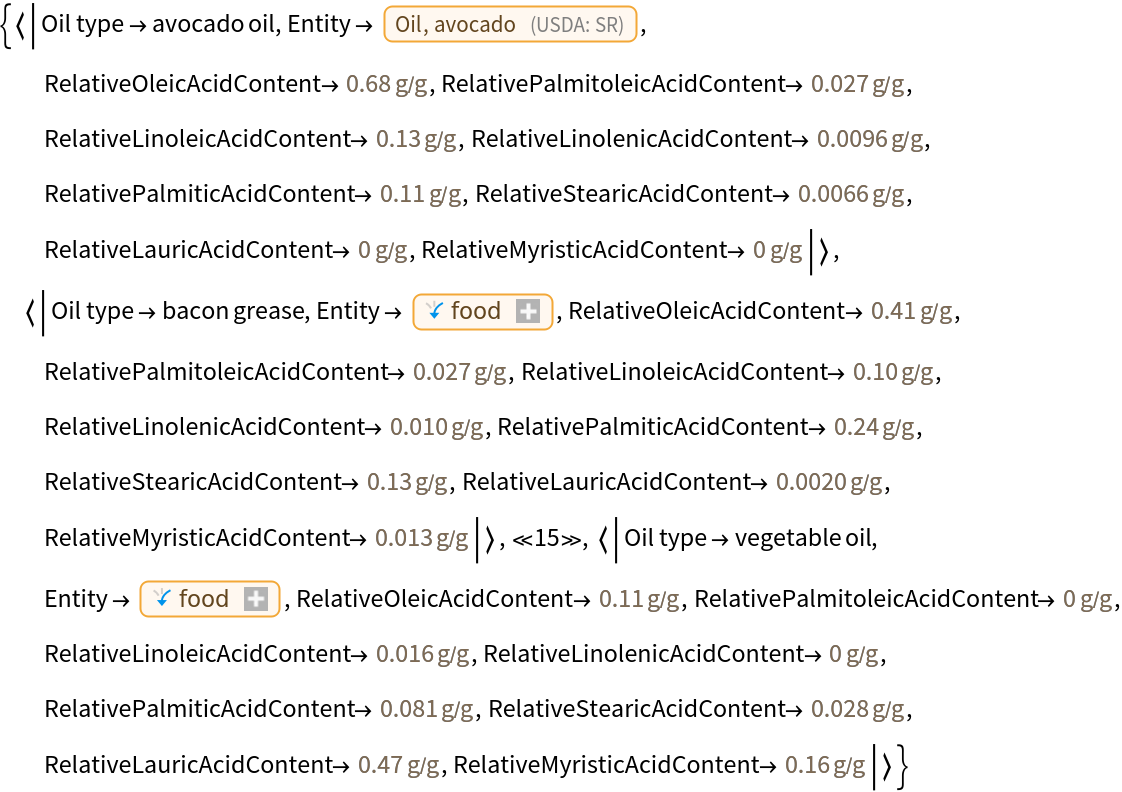 |
Sort the Tabular data according to the monounsaturated oleic acid content with SortBy, then display the oleic acid in all of the cooking fats and oils with ListPlot:
| In[7]:= | ![tabularData = ResourceFunction["FattyAcidsExplorer"]["Tabular"];
sortedOleicAcid = SortBy[tabularData, "Oleic acid"];
ListPlot[sortedOleicAcid -> "Oleic acid", Sequence[
Axes -> {False, True}, AxesLabel -> "g/g", Ticks -> {None,
Range[0, 0.8, 0.1]}, PlotRange -> {0, 0.8 + 0.02}, PlotLabel -> "Oleic Acid in Cooking Fats and Oils", PlotStyle -> DarkYellow, LabelingFunction -> (sortedOleicAcid[
Part[#2, 2], "Oil type"]& )]]](https://www.wolframcloud.com/obj/resourcesystem/images/2be/2be9fd14-e24c-4022-848d-6c9d72592878/277e00f1ddacfbce.png) |
| Out[8]= | 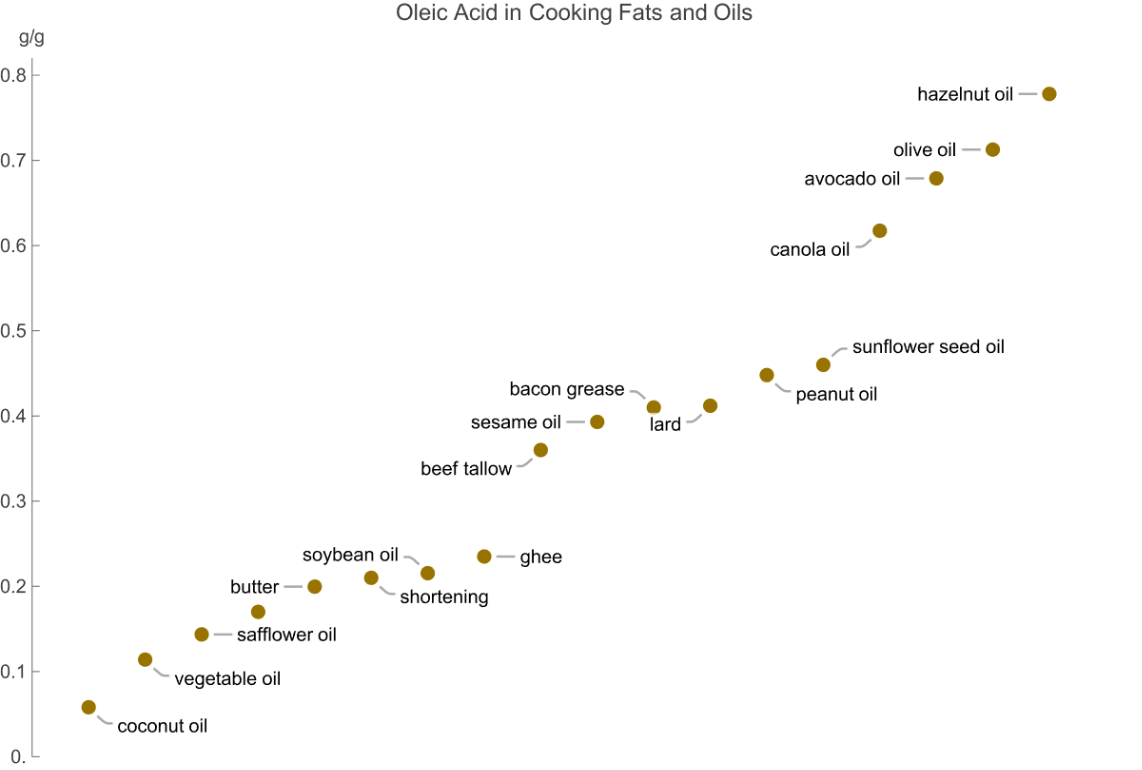 |
The requested oil type or fatty acid category may not be available in the dataset:
| In[9]:= |
| Out[9]= |
| In[10]:= |
| Out[10]= |
BarChart is another effective way to visualize the fatty acids data. In this case, the data is sorted according to the amount of saturated palmitic acid:
| In[11]:= | ![tabularData = ResourceFunction["FattyAcidsExplorer"]["Tabular"];
sortedPalmiticAcid = SortBy[tabularData, "Palmitic acid"];
palmiticAcidValues = sortedPalmiticAcid[All, "Palmitic acid"];
oilTypes = sortedPalmiticAcid[All, "Oil type"];
BarChart[palmiticAcidValues, Sequence[ChartLabels -> Placed[
Map[Rotate[#, Pi/2]& , oilTypes], Below], AxesLabel -> {Automatic, "g/g"}, PlotLabel -> "Palmitic Acid in Cooking Fats and Oils"]]](https://www.wolframcloud.com/obj/resourcesystem/images/2be/2be9fd14-e24c-4022-848d-6c9d72592878/55c4701686fe011e.png) |
| Out[12]= | 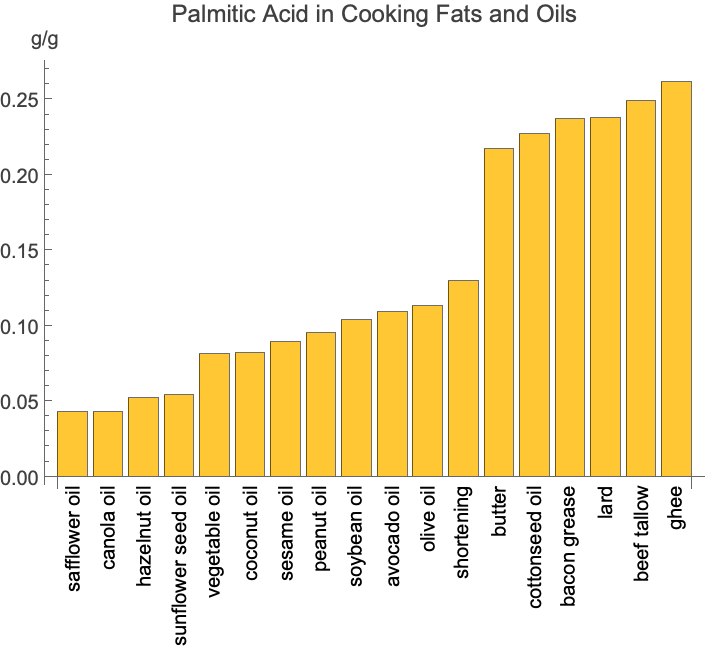 |
Use Histogram to group the values for two saturated fatty acids (palmitic acid and stearic acid) into bins and see how frequently they occur:
| In[13]:= |
| Out[13]= | 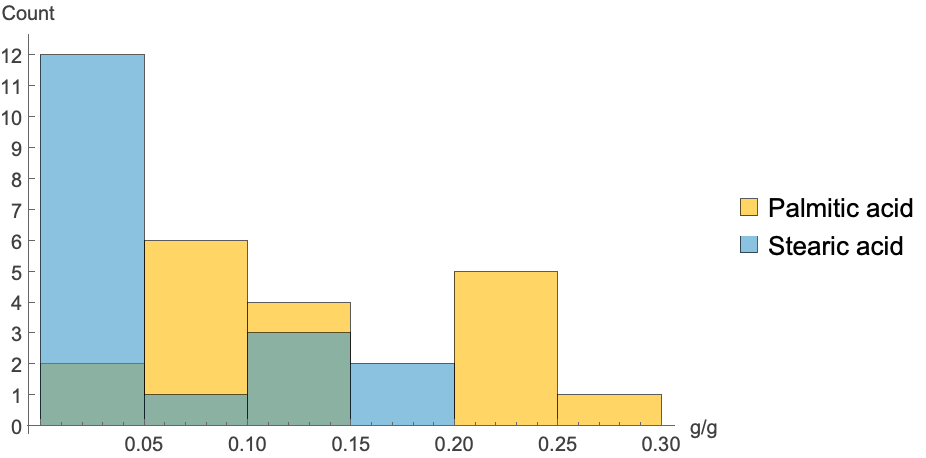 |
Visualize and compare the distribution of values for the most dominant fatty acid in each category—a MUFA, a PUFA and a saturated fatty acid. SmoothHistogram replaces the discrete bins of Histogram with a continuous curve to show the shape and overlap of the distributions. The curve represents the probability density, rather than a raw count:
| In[14]:= |
| Out[14]= | 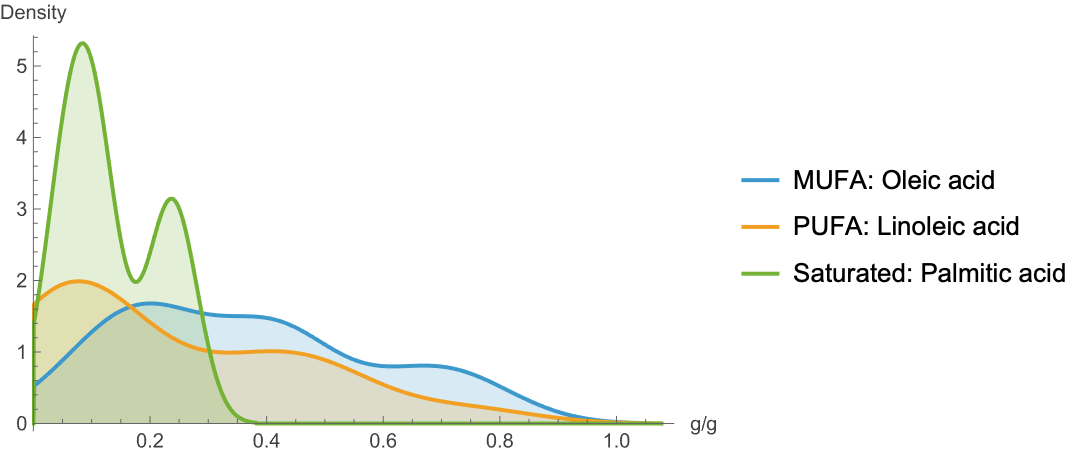 |
BoxWhiskerChart displays the minimum, median and maximum values for the three dominant fatty acids, as well as the interquartile range:
| In[15]:= |
| Out[15]= | 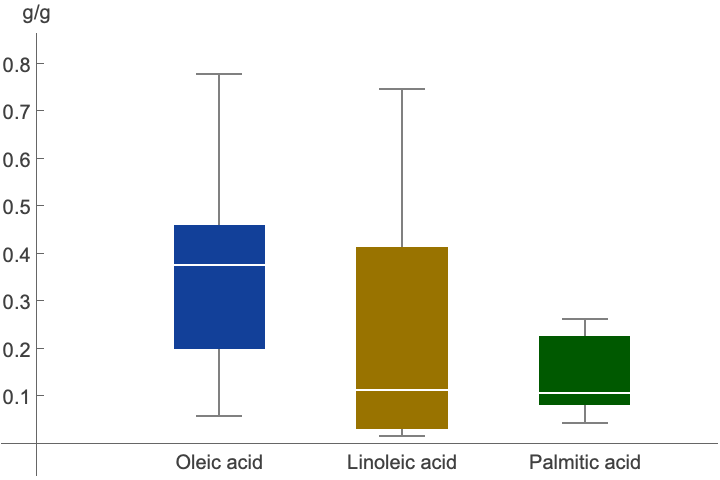 |
Wolfram Language 13.0 (December 2021) or above
This work is licensed under a Creative Commons Attribution 4.0 International License