Wolfram Function Repository
Instant-use add-on functions for the Wolfram Language
Function Repository Resource:
Create a dual bar chart comparing the calories and macronutrients in a list of foods
ResourceFunction["NutrientComparisonBarChart"][foods] returns calories and macronutrient information in BarChart form for a list of foods. | |
ResourceFunction["NutrientComparisonBarChart"][foods,format] returns calories and macronutrient information in the specified format. |
| ChartLabels | Before | placement of food names |
| ChartStyle | Automatic | graphics style for charts |
| ChartLegends | Below | placement of nutrient properties |
| BarOrigin | Left | origin placement for bars |
| BarSpacing | Automatic | spacing between bars and bar groups |
| FontSize | 10 | font size of chart labels and legends |
| PlotLabel | "" | optional overall label for both charts |
| ImageSize | 600 | overall image size expressed in points |
| ImageMargins | Automatic | absolute margins around image |
| Background | Automatic | background color for the charts |
| "Dataset" | returns a Dataset of the calories and macronutrient content in the foods |
| "Data" | returns associations of the foods and their calories and macronutrient content |
Compare the relative calories and macronutrients of raw fruits:
| In[1]:= | ![ResourceFunction[
"NutrientComparisonBarChart"][{"raw apple", "raw banana", "raw pear",
"raw papaya", "raw raspberry", "raw strawberry"}]](https://www.wolframcloud.com/obj/resourcesystem/images/7b5/7b5b3d4c-3535-47fe-9145-577cdba91b98/3982b0d18a730f4f.png) |
| Out[1]= | 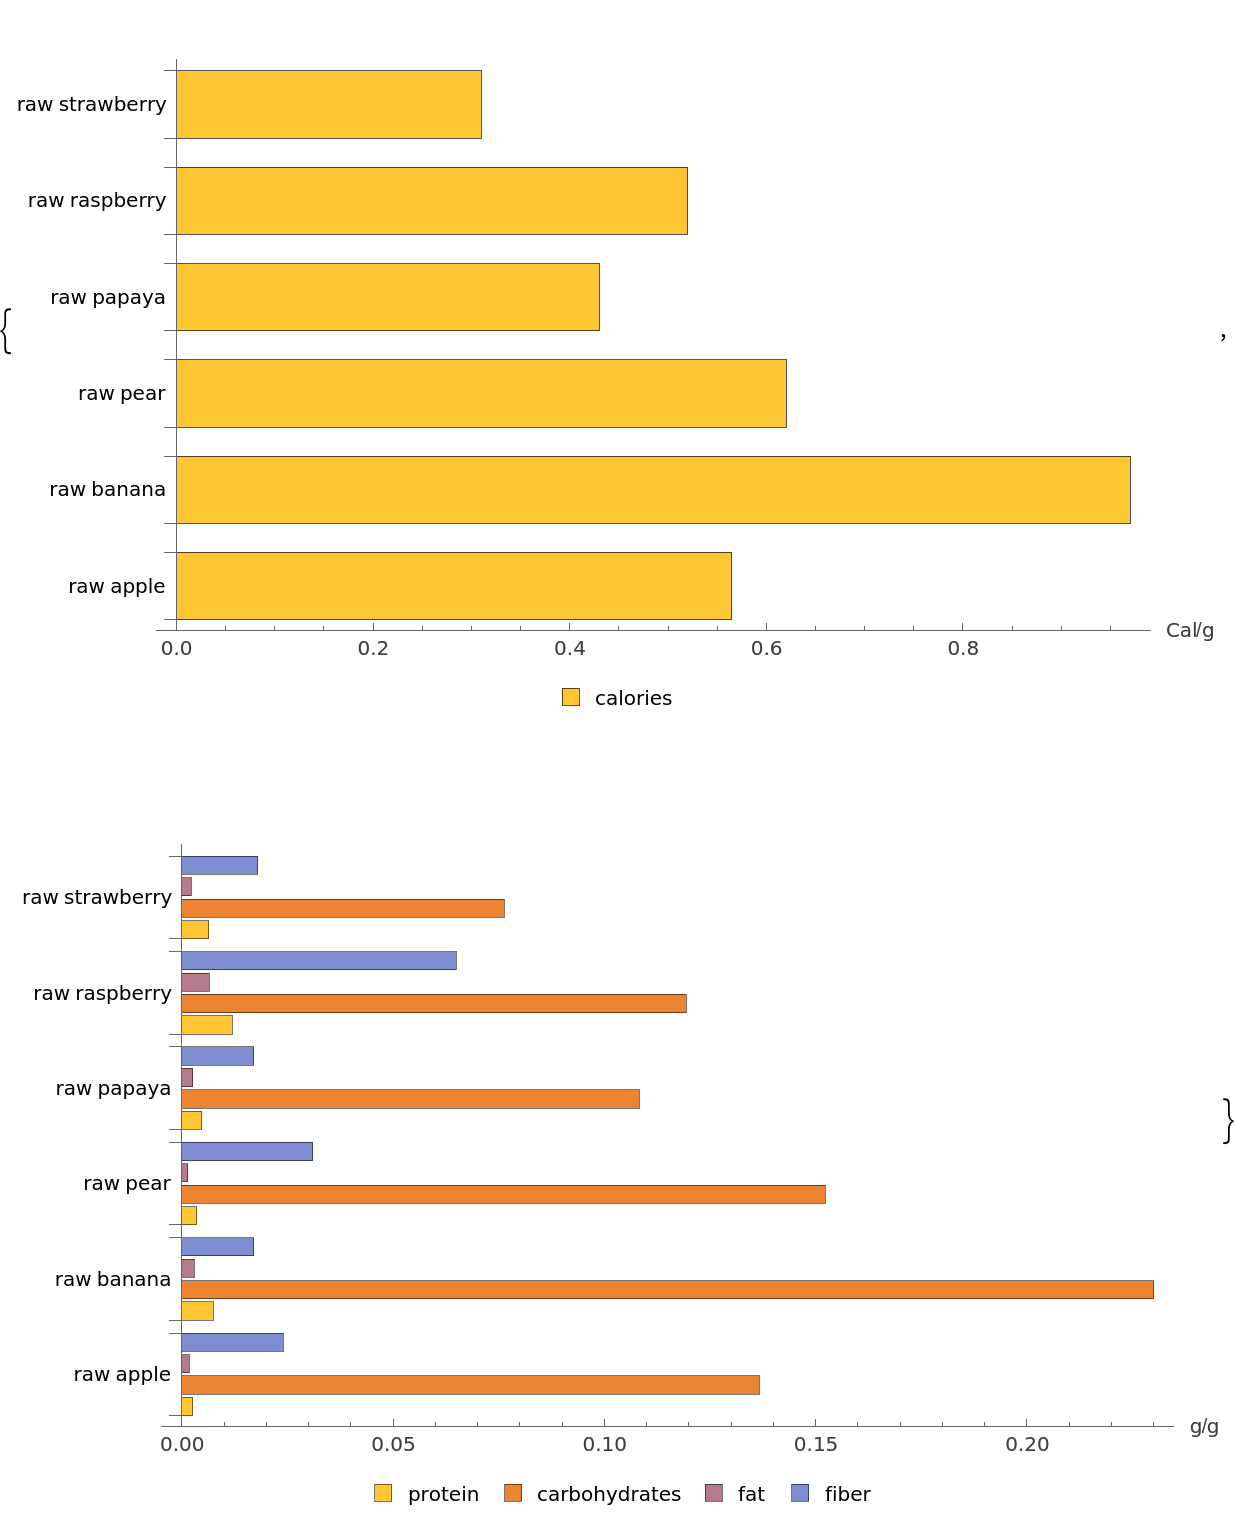 |
Visualize the nutrients in high-protein foods with a customized chart design:
| In[2]:= | ![ResourceFunction[
"NutrientComparisonBarChart"][{"braised beef", "cooked lentils", "boiled eggs", "peanut butter", "fried tofu", "grilled chicken"}, ChartStyle -> "Pastel", BarSpacing -> "None", PlotLabel -> "High-Protein Foods", FontSize -> 12]](https://www.wolframcloud.com/obj/resourcesystem/images/7b5/7b5b3d4c-3535-47fe-9145-577cdba91b98/644f98ebe3d91026.png) |
| Out[2]= | 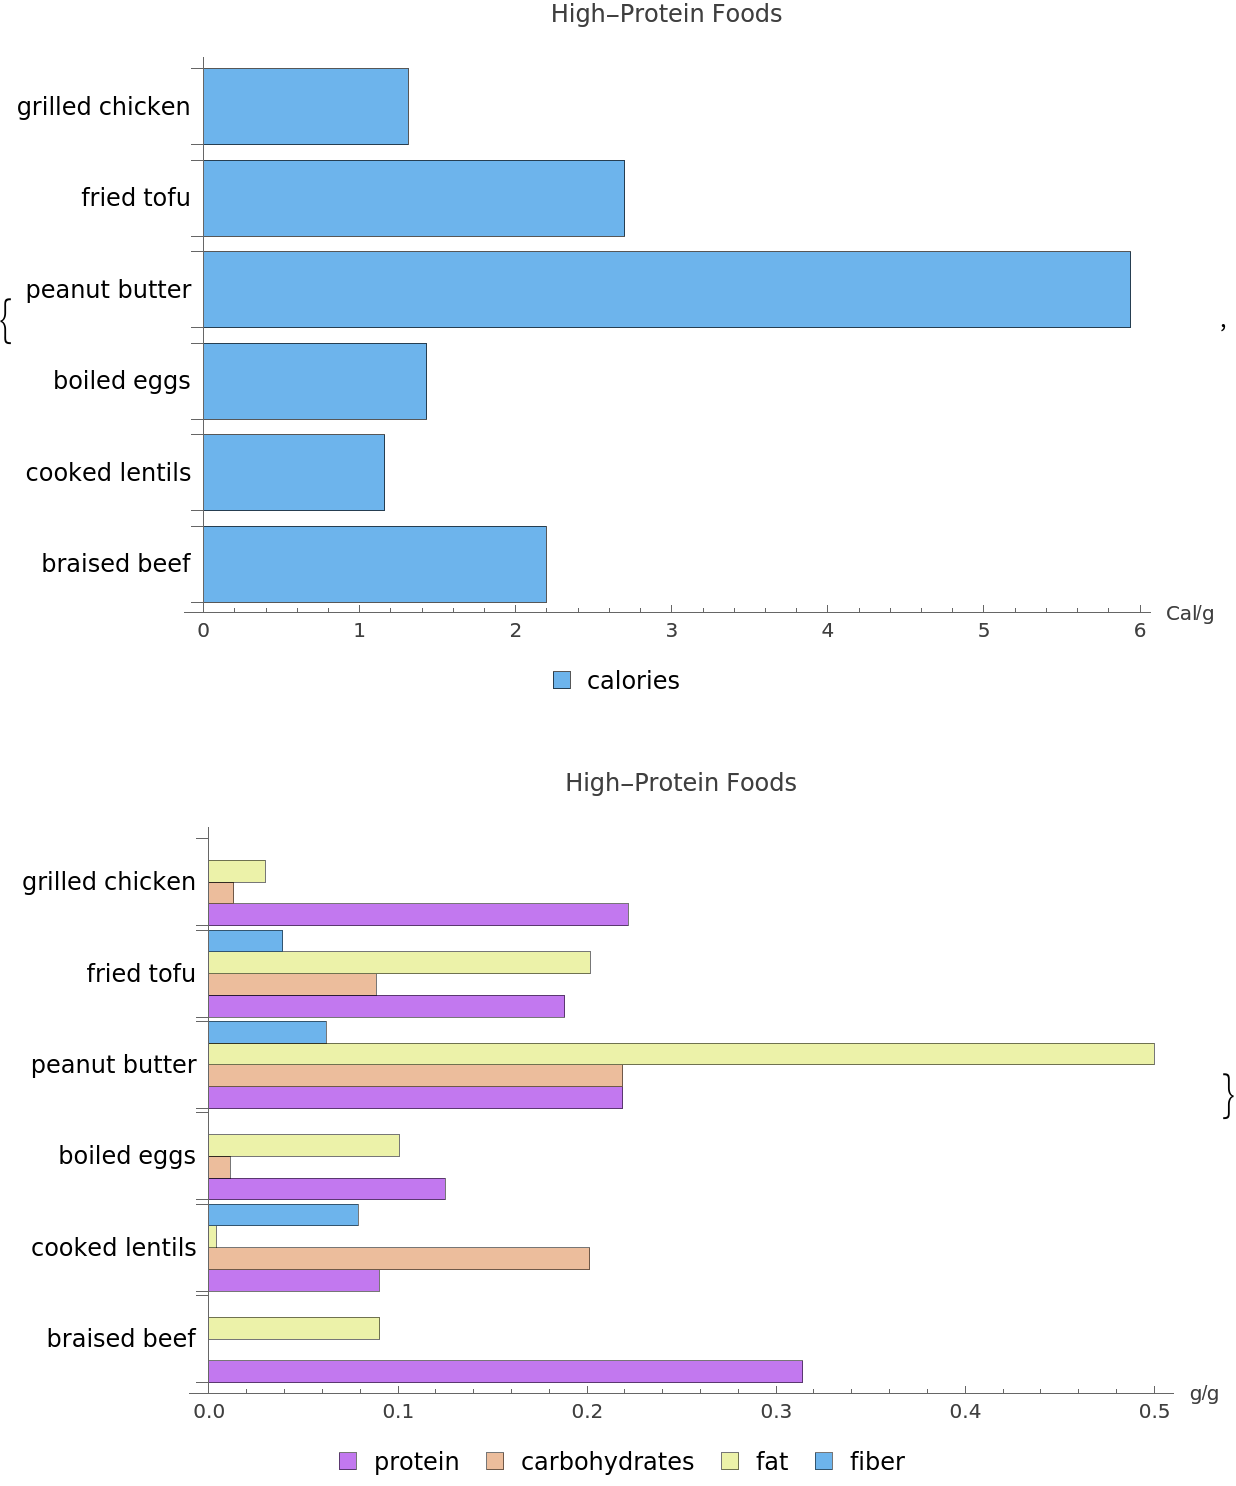 |
Display the nutrients data as a Dataset:
| In[3]:= | ![ResourceFunction[
"NutrientComparisonBarChart"][{"braised beef", "cooked lentils", "boiled eggs", "peanut butter", "fried tofu", "grilled chicken"}, "Dataset"]](https://www.wolframcloud.com/obj/resourcesystem/images/7b5/7b5b3d4c-3535-47fe-9145-577cdba91b98/2f631296be6eb287.png) |
| Out[3]= | 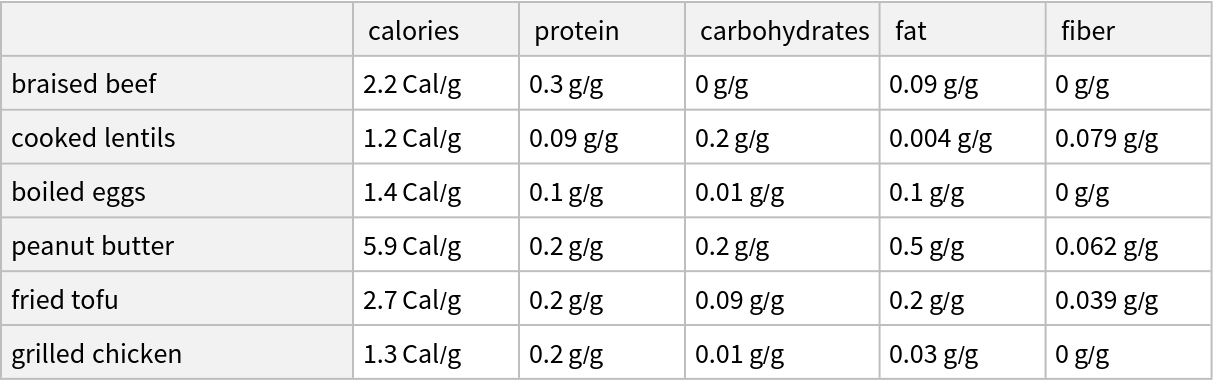 |
Display the data as associations:
| In[4]:= | ![ResourceFunction[
"NutrientComparisonBarChart"][{"braised beef", "cooked lentils", "boiled eggs", "peanut butter", "fried tofu", "grilled chicken"}, "Data"]](https://www.wolframcloud.com/obj/resourcesystem/images/7b5/7b5b3d4c-3535-47fe-9145-577cdba91b98/42c4123336c41e38.png) |
| Out[4]= | 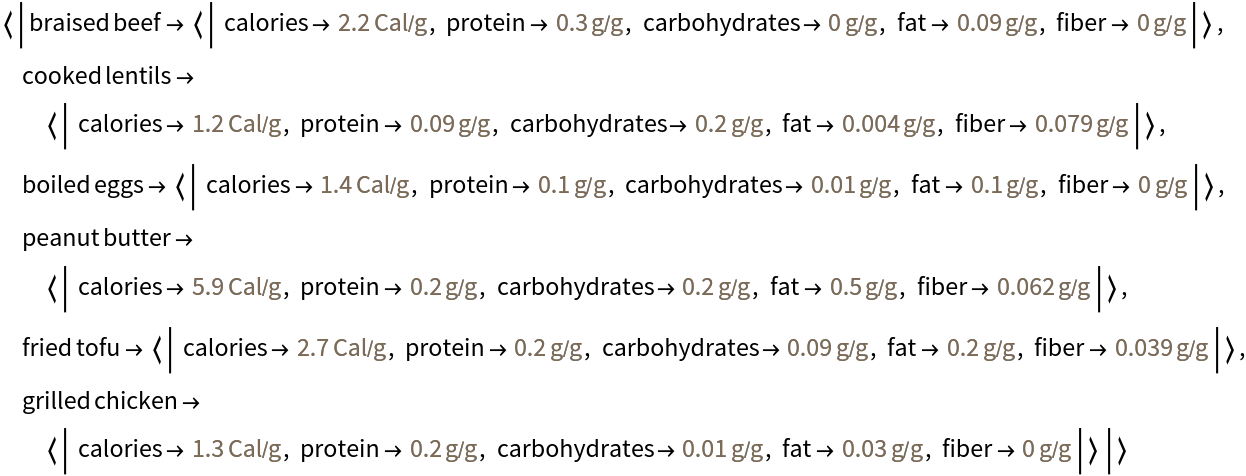 |
Use Wolfram Language food entities instead of text strings:
| In[5]:= | ![foodEntities = {Entity[
"Food", {EntityProperty["Food", "FoodType"] -> ContainsExactly[{
Entity["FoodType", "Spinach"]}], EntityProperty["Food", "AddedFoodTypes"] -> ContainsExactly[{}], EntityProperty["Food", "Preparation"] -> Entity[
"FoodPreparation", "Raw"]}], Entity[
"Food", {EntityProperty["Food", "FoodType"] -> ContainsExactly[{
Entity["FoodType", "Quinoa"]}], EntityProperty["Food", "AddedFoodTypes"] -> ContainsExactly[{}], EntityProperty["Food", "Preparation"] -> Entity[
"FoodPreparation", "Cooked"]}], Entity[
"Food", {EntityProperty["Food", "FoodType"] -> ContainsExactly[{
Entity["FoodType", "Salmon"]}], EntityProperty["Food", "AddedFoodTypes"] -> ContainsExactly[{}], EntityProperty["Food", "Preparation"] -> Entity[
"FoodPreparation", "Grilled"]}], Entity[
"Food", {EntityProperty["Food", "FoodType"] -> ContainsExactly[{
Entity["FoodType", "Carrot"]}], EntityProperty["Food", "AddedFoodTypes"] -> ContainsExactly[{}], EntityProperty["Food", "Preparation"] -> Entity[
"FoodPreparation", "Boiled"]}]};](https://www.wolframcloud.com/obj/resourcesystem/images/7b5/7b5b3d4c-3535-47fe-9145-577cdba91b98/182552f93dbbda2f.png) |
| In[6]:= |
| Out[6]= | 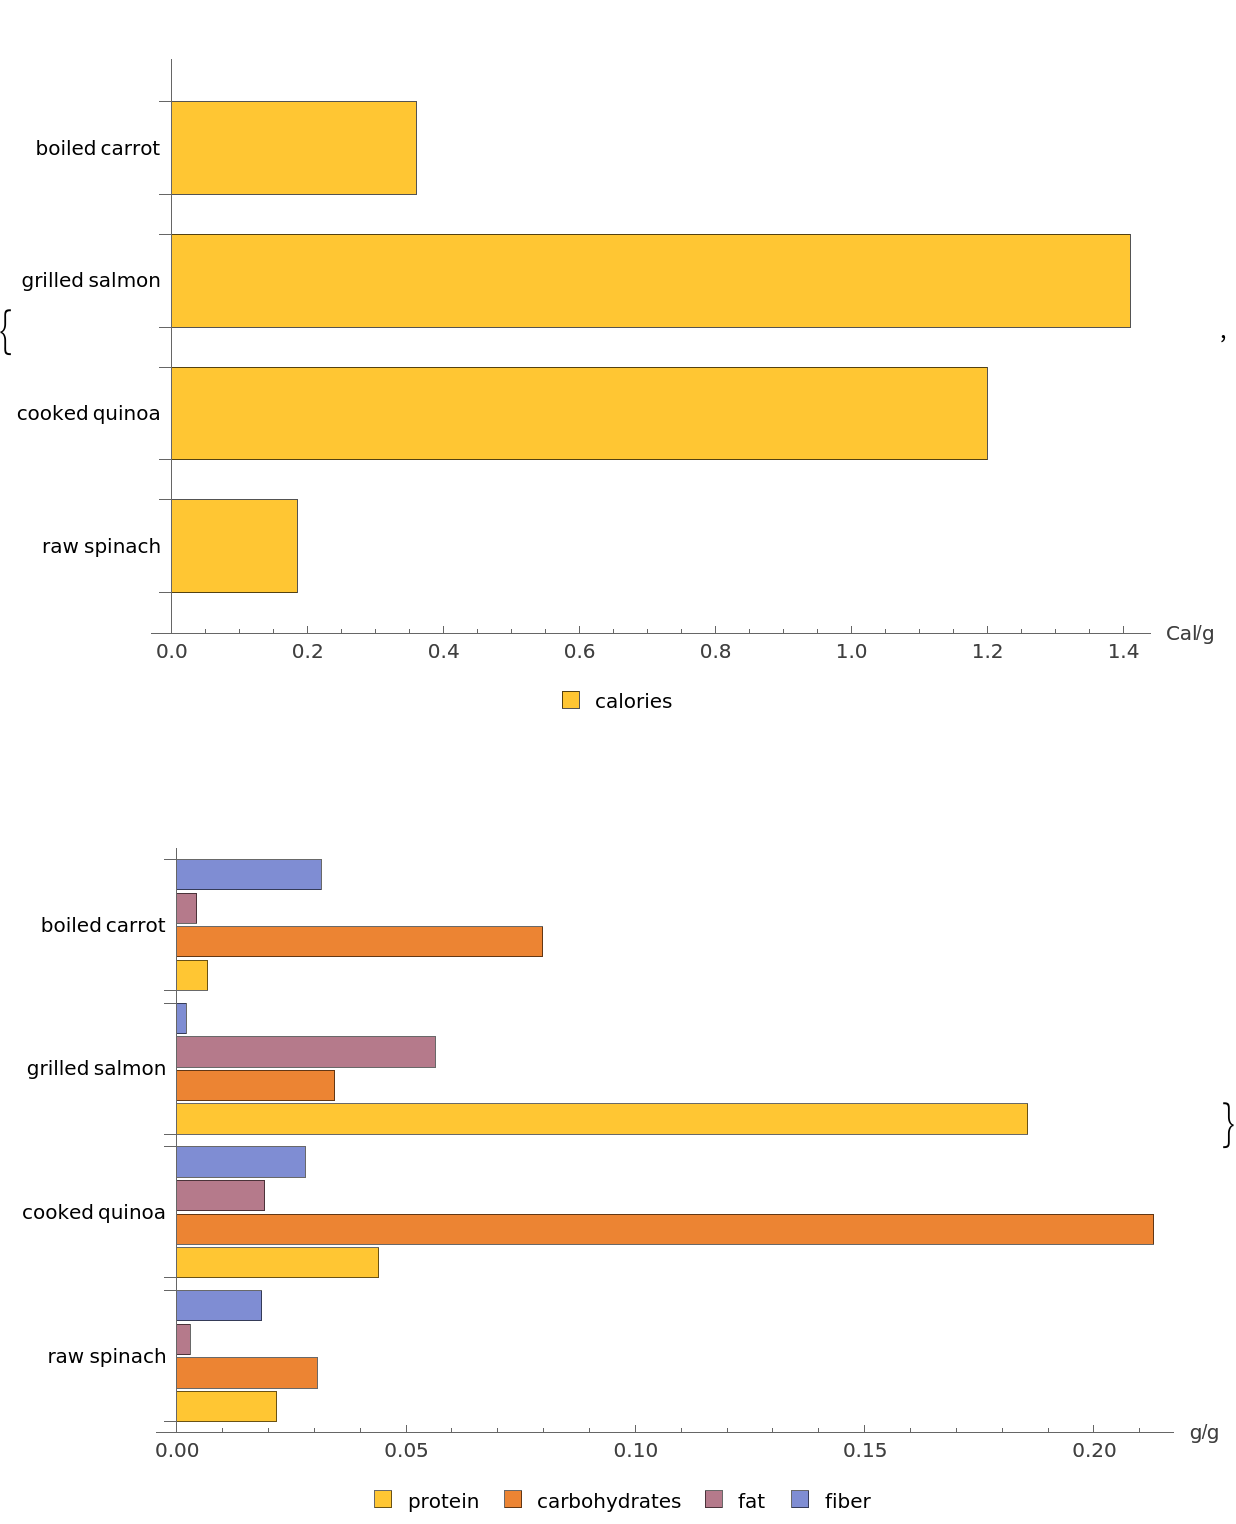 |
| In[7]:= |
| Out[7]= | 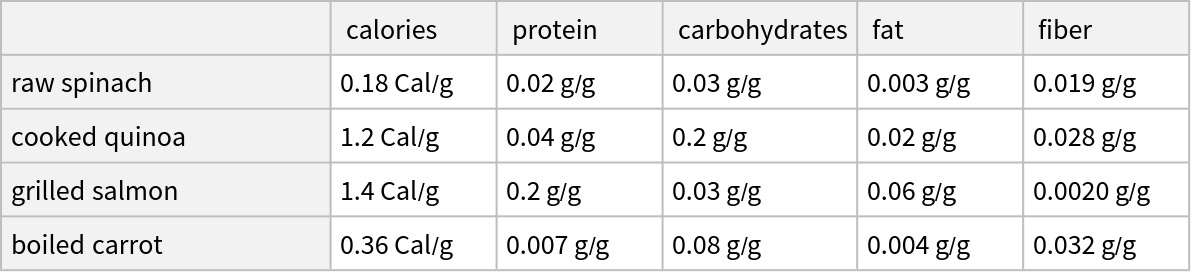 |
| In[8]:= |
| Out[8]= | 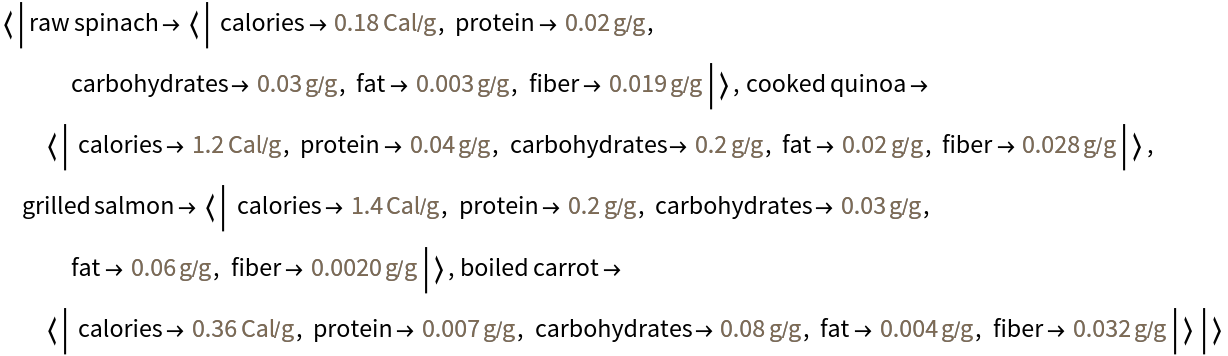 |
Create a vertical bar chart of grains with specified image size and labels:
| In[9]:= | ![ResourceFunction[
"NutrientComparisonBarChart"][{"wheat", "rolled oats", "rye grain", "raw barley", "dry bulgur", "raw millet"}, BarOrigin -> Bottom, ChartLabels -> Below, ChartLegends -> Above, ImageSize -> Medium]](https://www.wolframcloud.com/obj/resourcesystem/images/7b5/7b5b3d4c-3535-47fe-9145-577cdba91b98/0ecd04299fa75de5.png) |
| Out[9]= | 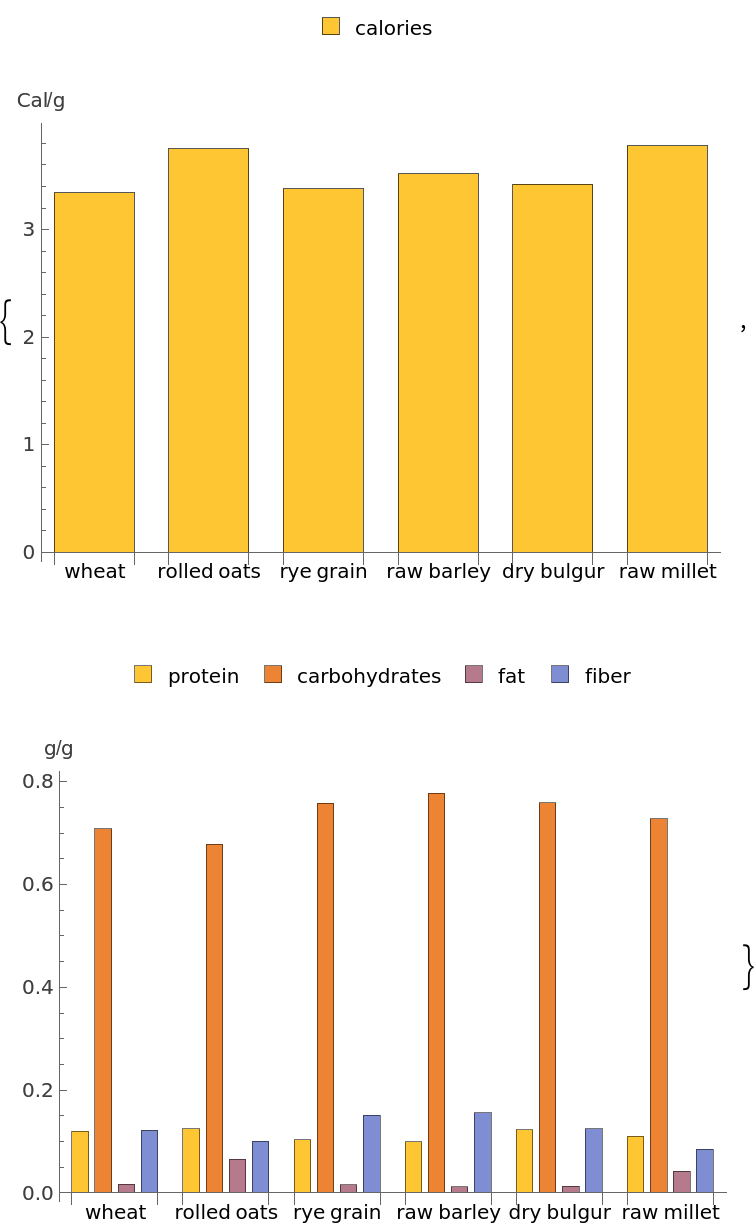 |
Have fun with the ChartStyle options named for foods, such as AvocadoColors, CandyColors, CherryTones, CoffeeTones, FruitPunchColors, MintColors, PlumColors and WatermelonColors:
| In[10]:= |
| Out[10]= | 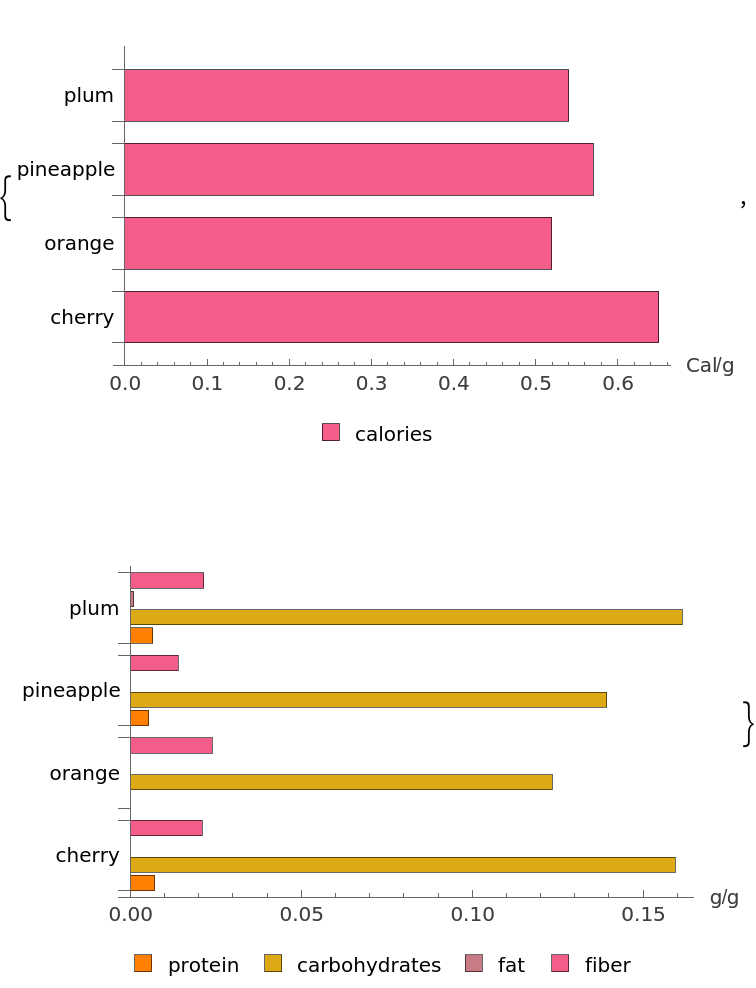 |
| In[11]:= | ![ResourceFunction[
"NutrientComparisonBarChart"][{"brussel sprouts", "broccoli", "kale",
"avocado"}, ImageSize -> Medium, ChartStyle -> "AvocadoColors"]](https://www.wolframcloud.com/obj/resourcesystem/images/7b5/7b5b3d4c-3535-47fe-9145-577cdba91b98/611ad0a6625565be.png) |
| Out[11]= | 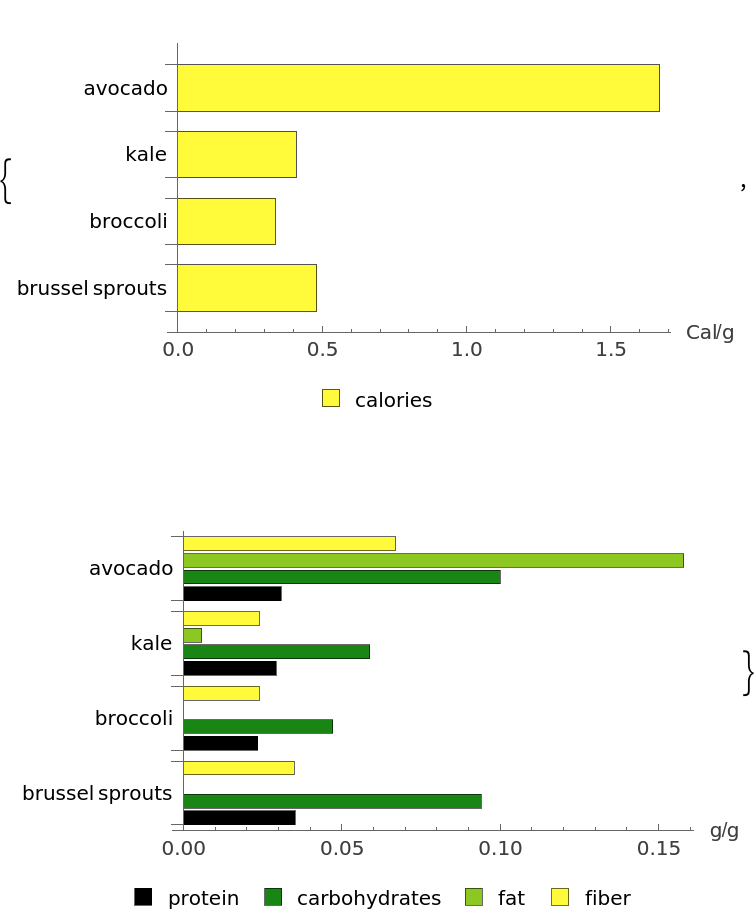 |
Wolfram Language 13.0 (December 2021) or above
This work is licensed under a Creative Commons Attribution 4.0 International License