Wolfram Function Repository
Instant-use add-on functions for the Wolfram Language
Function Repository Resource:
Map the argument of a complex number to a color
ResourceFunction["ArgHue"][arg] returns Hue[h,1,1] where h depends on the value of arg. | |
ResourceFunction["ArgHue"][arg,abs] creates a Hue based on the argument arg and magnitude abs of a complex value. |
| ZeroColor | White | approach this color as the parameter abs approaches zero |
When arg is a real number, ArgHue[arg] returns a hue with full saturation and full brightness:
| In[1]:= |
| Out[1]= |
Display the above colors in a way that indicates the direction in the complex plane they represent:
| In[2]:= | ![Graphics[
Flatten[{Transpose@{colors, Table[Disk[{0, 0}, 1, {\[Theta] - \[Pi]/50, \[Theta] + \[Pi]/
50}], {\[Theta], -\[Pi], \[Pi], \[Pi]/4}]},
White, Disk[{0, 0}, 0.5], Black, Line[{{-0.5, 0}, {0.5, 0}}], Line[{{0, -0.5}, {0, 0.5}}]}]]](https://www.wolframcloud.com/obj/resourcesystem/images/a84/a841a39c-72dd-4e37-9f4b-204fde89374a/4b7d5718c0cf4803.png) |
| Out[2]= | 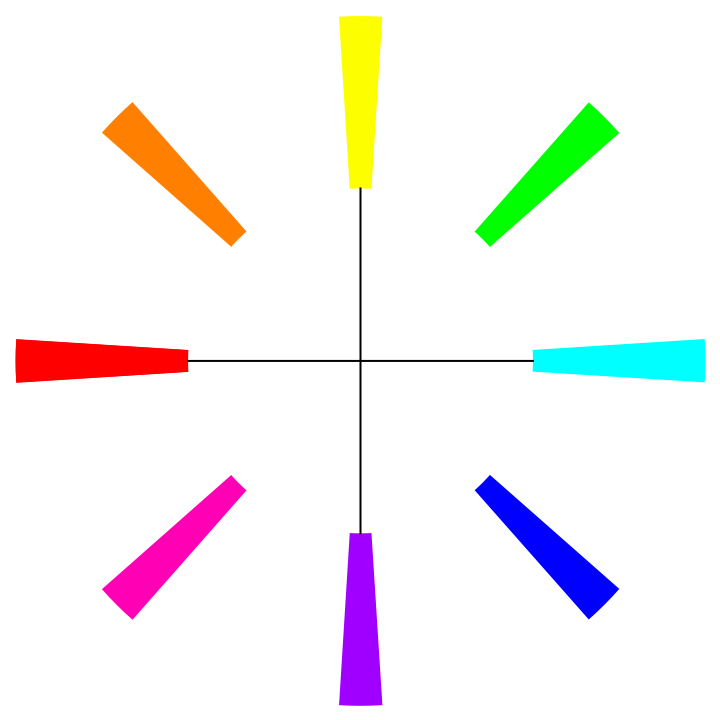 |
Make a color wheel around the origin of the complex plane:
| In[3]:= | ![Graphics[
Flatten@{Table[{ResourceFunction["ArgHue"][arg], Disk[{0, 0}, 1, {arg - \[Pi]/400, arg + \[Pi]/400}]}, {arg, -\[Pi], \[Pi], \[Pi]/210}],
White, Disk[{0, 0}, 0.7]}, Axes -> True, AxesLabel -> {"Re", "Im"},
Ticks -> None]](https://www.wolframcloud.com/obj/resourcesystem/images/a84/a841a39c-72dd-4e37-9f4b-204fde89374a/4eacef7a18a79cfc.png) |
| Out[3]= | 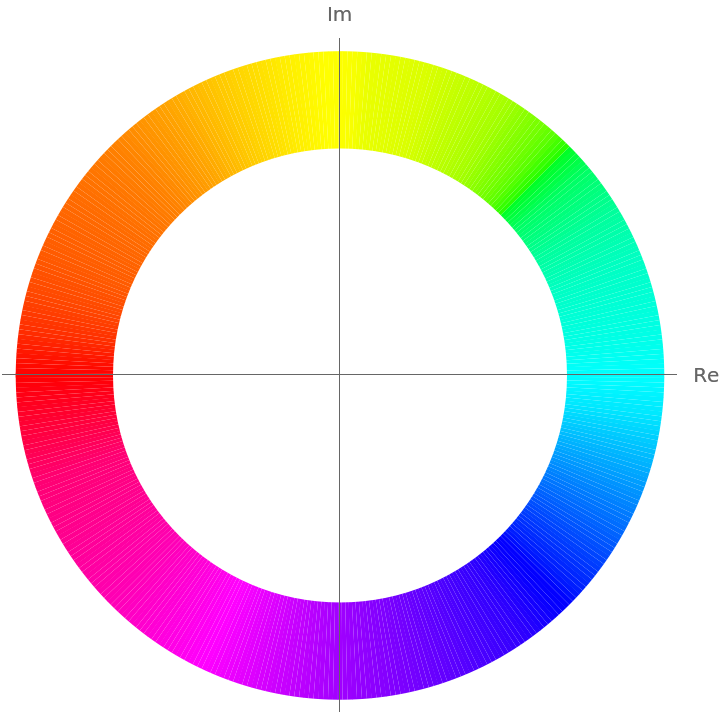 |
When the ZeroColor setting is White, ArgHue[arg,abs] returns a color that approaches White as abs approaches 0:
| In[4]:= | ![SetOptions[ResourceFunction["ArgHue"], ZeroColor -> White];
Table[ResourceFunction["ArgHue"][arg, abs], {abs, {0.15, 0.3, 0.6, 1}}, {arg, -\[Pi], \[Pi], \[Pi]/
8}] // TableForm](https://www.wolframcloud.com/obj/resourcesystem/images/a84/a841a39c-72dd-4e37-9f4b-204fde89374a/5ca785d6efbe1fba.png) |
| Out[5]= | 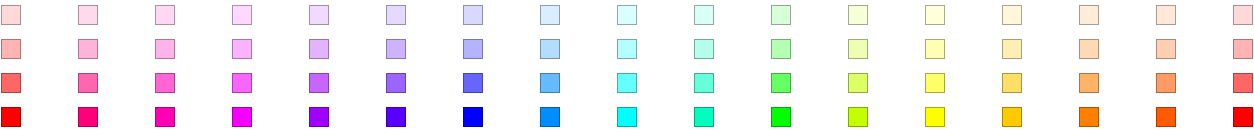 |
When the ZeroColor setting is Black, ArgHue[arg,abs] returns a color that approaches Black as abs approaches 0:
| In[6]:= | ![SetOptions[ResourceFunction["ArgHue"], ZeroColor -> Black];
Table[ResourceFunction["ArgHue"][arg, abs], {abs, {0.55, 0.65, 0.8, 1}}, {arg, -\[Pi], \[Pi], \[Pi]/
8}] // TableForm](https://www.wolframcloud.com/obj/resourcesystem/images/a84/a841a39c-72dd-4e37-9f4b-204fde89374a/502dc33dfcb5e3a4.png) |
| Out[7]= | 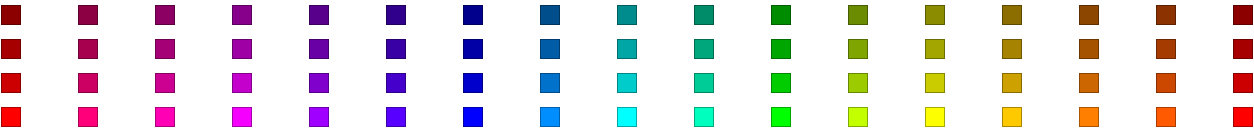 |
Specify that White should be used where the function approaches zero:
| In[8]:= | ![SetOptions[ResourceFunction["ArgHue"], ZeroColor -> White];
ComplexPlot[z, {z, -1 - I, 1 + I}, ColorFunction -> {Function[{re, im, abs, arg}, ResourceFunction["ArgHue"][arg, abs]], None}, ColorFunctionScaling -> False]](https://www.wolframcloud.com/obj/resourcesystem/images/a84/a841a39c-72dd-4e37-9f4b-204fde89374a/6914f53c82cb7bf3.png) |
| Out[9]= | 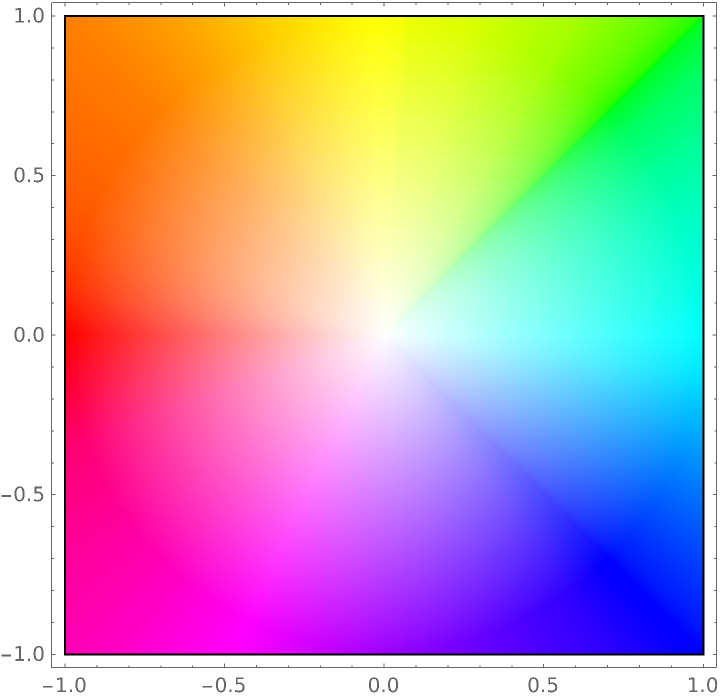 |
Specify that GrayLevel[0.4] should be used where the function approaches zero:
| In[10]:= | ![SetOptions[ResourceFunction["ArgHue"], ZeroColor -> GrayLevel[0.4]];
ComplexPlot[z, {z, -1 - I, 1 + I}, ColorFunction -> {Function[{re, im, abs, arg}, ResourceFunction["ArgHue"][arg, abs]], None}, ColorFunctionScaling -> False]](https://www.wolframcloud.com/obj/resourcesystem/images/a84/a841a39c-72dd-4e37-9f4b-204fde89374a/79a7fb14c6a02c33.png) |
| Out[11]= | 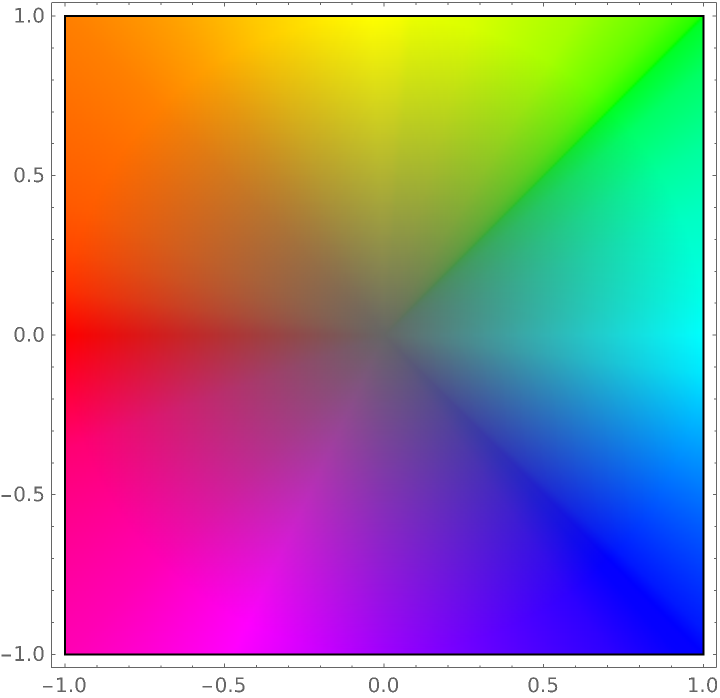 |
Specify that RGBColor[1,0.8,0.8] should be used where the function approaches zero:
| In[12]:= | ![ComplexPlot[z, {z, -1 - I, 1 + I}, ColorFunction -> {Function[{re, im, abs, arg}, ResourceFunction["ArgHue"][arg, abs, ZeroColor -> RGBColor[1, 0.8, 0.8]]], None}, ColorFunctionScaling -> False]](https://www.wolframcloud.com/obj/resourcesystem/images/a84/a841a39c-72dd-4e37-9f4b-204fde89374a/3ad794205191ffd8.png) |
| Out[12]= | 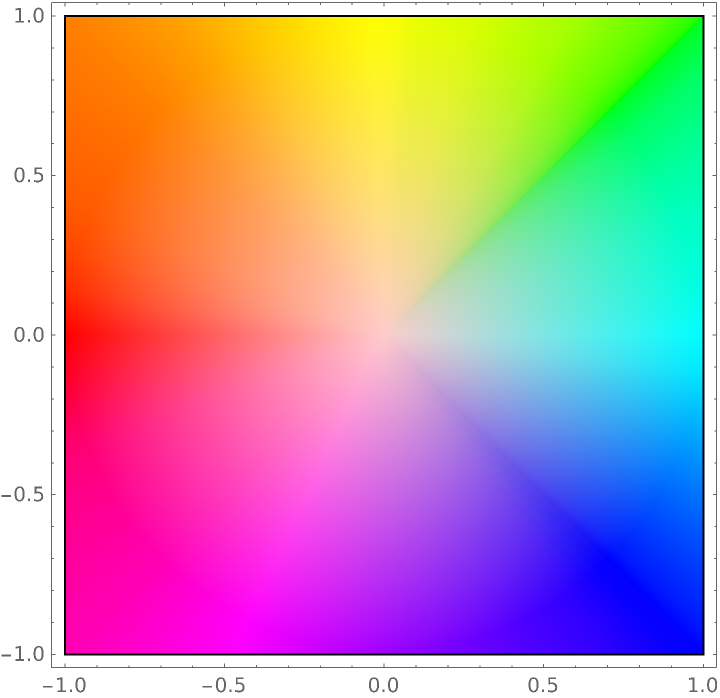 |
Use ArgHue in the ColorFunction setting of ComplexPlot with the hue indicating the argument of the function value:
| In[14]:= | ![ComplexPlot[z, {z, -1 - I, 1 + I}, ColorFunction -> {Function[{re, im, abs, arg}, ResourceFunction["ArgHue"][arg]], None}, ColorFunctionScaling -> False, Exclusions -> None]](https://www.wolframcloud.com/obj/resourcesystem/images/a84/a841a39c-72dd-4e37-9f4b-204fde89374a/1aa0106c3d74131c.png) |
| Out[14]= | 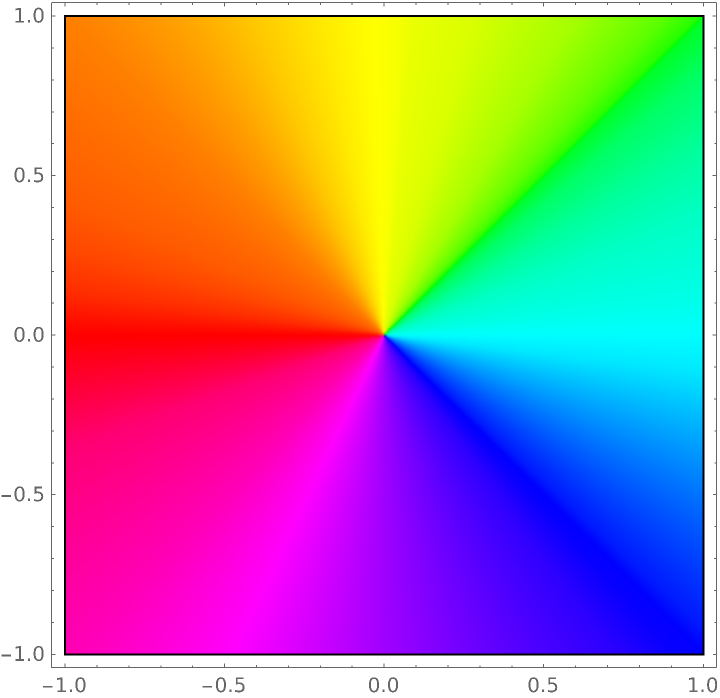 |
Use ArgHue in the ColorFunction setting of ComplexPlot with the hue indicating the argument of the function value and a color that approaches White as the function value approaches zero:
| In[15]:= | ![SetOptions[ResourceFunction["ArgHue"], "ZeroColor" -> White];
ComplexPlot[z, {z, -1 - I, 1 + I}, ColorFunction -> {Function[{re, im, abs, arg}, ResourceFunction["ArgHue"][arg, abs]], None}, ColorFunctionScaling -> False]](https://www.wolframcloud.com/obj/resourcesystem/images/a84/a841a39c-72dd-4e37-9f4b-204fde89374a/7d7814cef6f862b6.png) |
| Out[16]= |  |
Use ArgHue in the ColorFunction setting of ComplexPlot with the hue indicating the argument of the function value and a color that approaches Black as the function value approaches zero:
| In[17]:= | ![SetOptions[ResourceFunction["ArgHue"], "ZeroColor" -> Black];
ComplexPlot[z, {z, -1 - I, 1 + I}, ColorFunction -> {Function[{re, im, abs, arg}, ResourceFunction["ArgHue"][arg, abs]], None}, ColorFunctionScaling -> False]](https://www.wolframcloud.com/obj/resourcesystem/images/a84/a841a39c-72dd-4e37-9f4b-204fde89374a/150cc832d75a6cba.png) |
| Out[18]= | 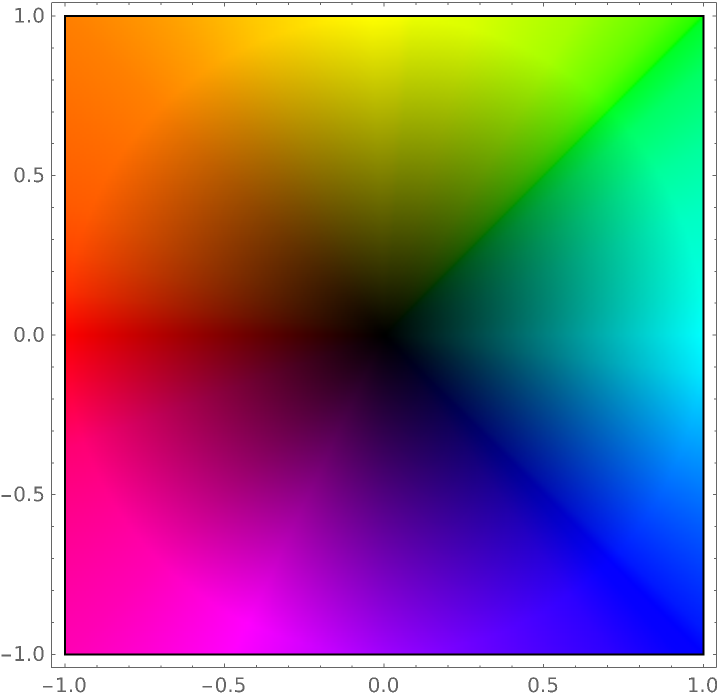 |
Use ArgHue in the ColorFunction setting of ComplexPlot3D with the hue indicating the argument of the function value:
| In[19]:= | ![ComplexPlot3D[z, {z, -1 - I, 1 + I}, ColorFunction -> Function[{re, im, abs, arg}, ResourceFunction["ArgHue"][arg]], ColorFunctionScaling -> False, Exclusions -> None]](https://www.wolframcloud.com/obj/resourcesystem/images/a84/a841a39c-72dd-4e37-9f4b-204fde89374a/2e68aac458638e0d.png) |
| Out[19]= | 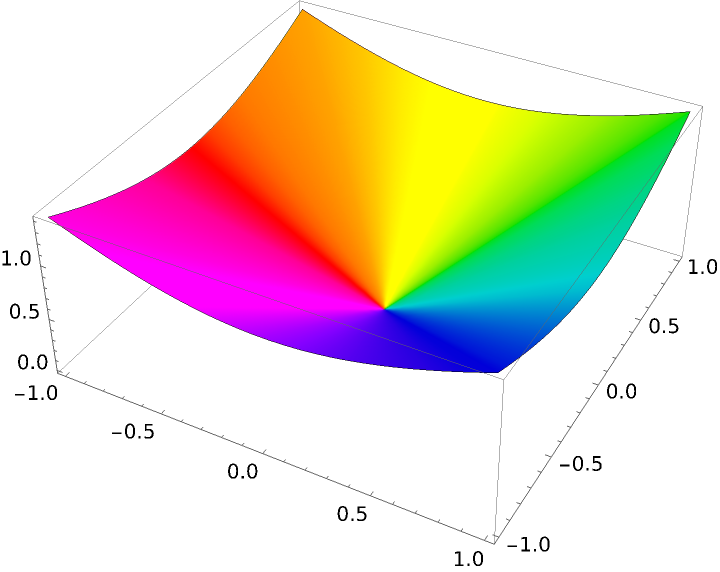 |
Use ArgHue in the ColorFunction setting of ComplexPlot3D with the hue indicating the argument of the function value and a color that approaches White as the function value approaches zero:
| In[20]:= | ![SetOptions[ResourceFunction["ArgHue"], "ZeroColor" -> White];
ComplexPlot3D[z, {z, -1 - I, 1 + I}, ColorFunction -> Function[{re, im, abs, arg}, ResourceFunction["ArgHue"][arg, abs]], ColorFunctionScaling -> False, Exclusions -> None]](https://www.wolframcloud.com/obj/resourcesystem/images/a84/a841a39c-72dd-4e37-9f4b-204fde89374a/1ada2a70b434eeff.png) |
| Out[21]= | 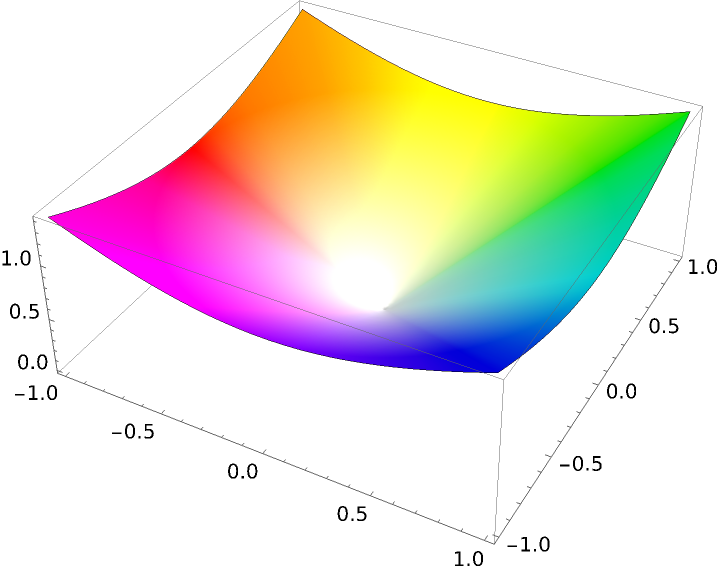 |
Use ArgHue in the ColorFunction setting of ComplexPlot3D with the hue indicating the argument of the function value and a color that approaches Black as the function value approaches zero:
| In[22]:= | ![SetOptions[ResourceFunction["ArgHue"], "ZeroColor" -> Black];
ComplexPlot3D[z, {z, -1 - I, 1 + I}, ColorFunction -> Function[{re, im, abs, arg}, ResourceFunction["ArgHue"][arg, abs]], ColorFunctionScaling -> False, Exclusions -> None]](https://www.wolframcloud.com/obj/resourcesystem/images/a84/a841a39c-72dd-4e37-9f4b-204fde89374a/187f6d6e22dee187.png) |
| Out[23]= | 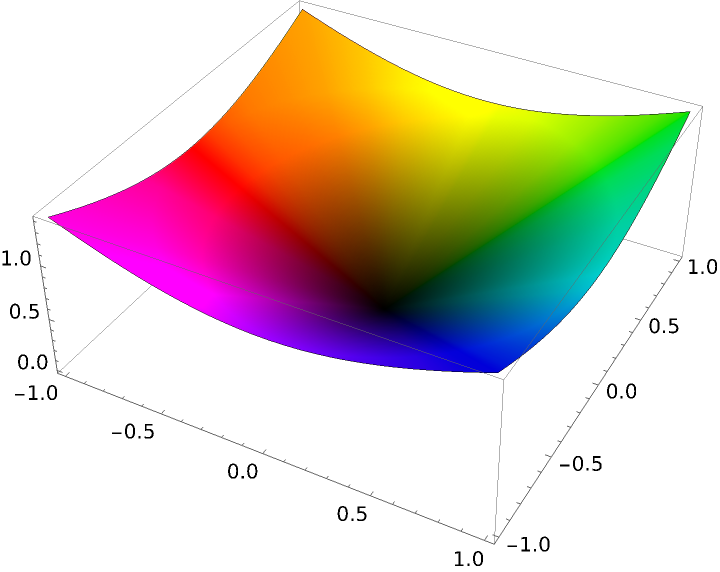 |
Use ArgHue in the ColorFunction setting of ComplexListPlot with the hue indicating the argument of the function value:
| In[24]:= | ![pnts = Table[(1 + \[Theta]) E^(I \[Theta]), {\[Theta], \[Pi]/36, 6 \[Pi], \[Pi]/18}];
ComplexListPlot[pnts, PlotStyle -> AbsolutePointSize[7], ColorFunction -> Function[{re, im, arg, abs}, ResourceFunction["ArgHue"][arg]], ColorFunctionScaling -> False]](https://www.wolframcloud.com/obj/resourcesystem/images/a84/a841a39c-72dd-4e37-9f4b-204fde89374a/6c35398bd0bdaec5.png) |
| Out[25]= | 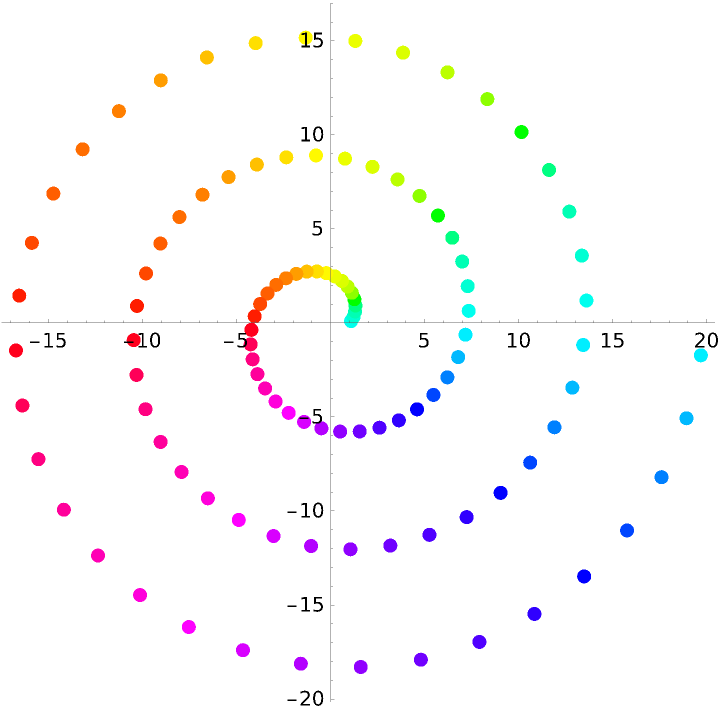 |
Use ArgHue in the ColorFunction setting of ComplexListPlot with the hue indicating the argument of the function value and a color that approaches White as the function value approaches zero:
| In[26]:= | ![SetOptions[ResourceFunction["ArgHue"], "ZeroColor" -> White];
ComplexListPlot[
Table[(1 + \[Theta]) E^(I \[Theta]), {\[Theta], \[Pi]/36, 6 \[Pi], \[Pi]/18}], PlotStyle -> AbsolutePointSize[7], ColorFunction -> Function[{re, im, arg, abs}, ResourceFunction["ArgHue"][arg, abs/15]], ColorFunctionScaling -> False]](https://www.wolframcloud.com/obj/resourcesystem/images/a84/a841a39c-72dd-4e37-9f4b-204fde89374a/7c2a38877e4fefa8.png) |
| Out[3]= | 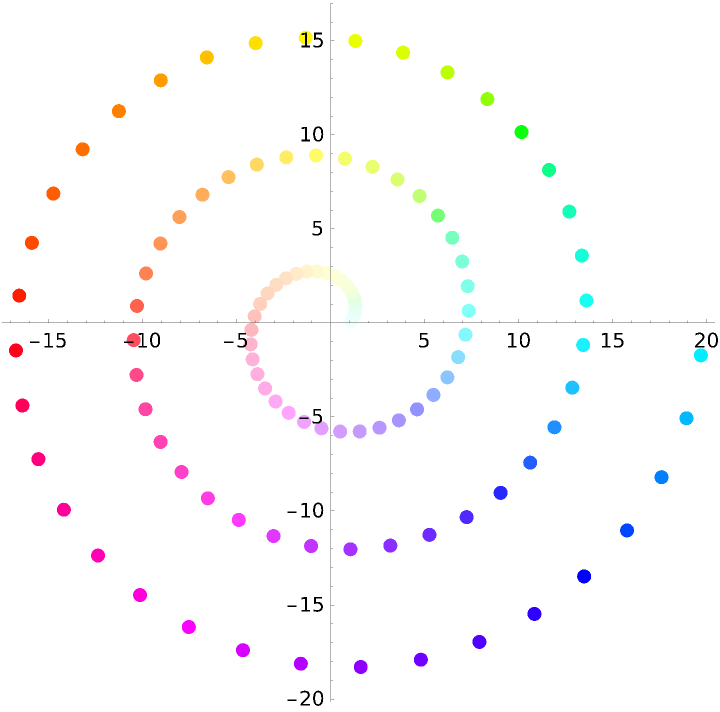 |
Use ArgHue in the ColorFunction setting of ComplexListPlot with the hue indicating the argument of the function value and a color that approaches Black as the function value approaches zero:
| In[27]:= | ![SetOptions[ResourceFunction["ArgHue"], "ZeroColor" -> Black];
ComplexListPlot[
Table[(1 + \[Theta]) E^(I \[Theta]), {\[Theta], \[Pi]/36, 6 \[Pi], \[Pi]/18}], PlotStyle -> AbsolutePointSize[7], ColorFunction -> Function[{re, im, arg, abs}, ResourceFunction["ArgHue"][arg, abs/10]], ColorFunctionScaling -> False]](https://www.wolframcloud.com/obj/resourcesystem/images/a84/a841a39c-72dd-4e37-9f4b-204fde89374a/7fd70ef4aede28b4.png) |
| Out[28]= | 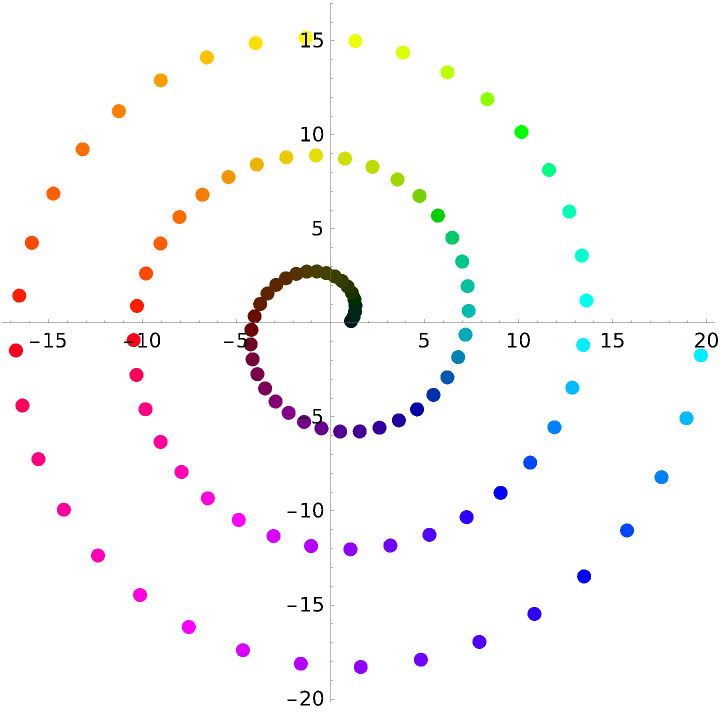 |
Use ArgHue in the ColorFunction setting in ComplexArrayPlot with the hue indicating the argument of the function value:
| In[29]:= | ![pnts = Table[
Sqrt[x^2 + y^2] E^(-I ArcTan[x, y]), {y, -2, 2.21, 0.42}, {x, -2, 2.1, 0.42}];
ComplexArrayPlot[pnts, ColorFunction -> {Function[{re, im, abs, arg}, ResourceFunction["ArgHue"][arg]], None}, ColorFunctionScaling -> False]](https://www.wolframcloud.com/obj/resourcesystem/images/a84/a841a39c-72dd-4e37-9f4b-204fde89374a/6e2af60a7998a07e.png) |
| Out[30]= | 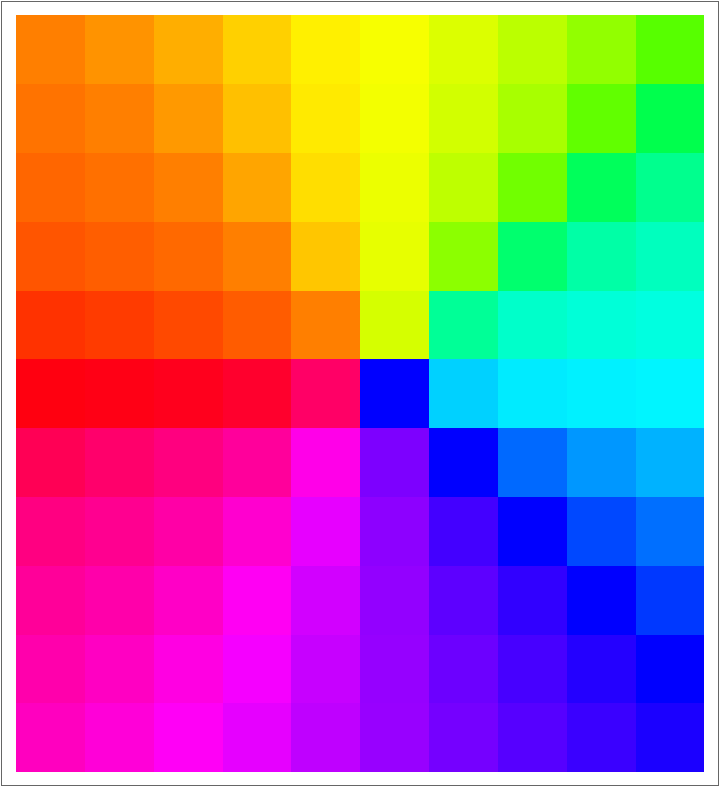 |
Use ArgHue in the ColorFunction setting of ComplexArrayPlot with the hue indicating the argument of the function value and a color that approaches White as the function value approaches zero:
| In[31]:= | ![SetOptions[ResourceFunction["ArgHue"], "ZeroColor" -> White];
ComplexArrayPlot[
Table[Sqrt[x^2 + y^2] E^(-I ArcTan[x, y]), {y, -2, 2.21, 0.42}, {x, -2, 2.1, 0.42}], ColorFunction -> {Function[{re, im, abs, arg}, ResourceFunction["ArgHue"][arg, abs/2]], None}, ColorFunctionScaling -> False]](https://www.wolframcloud.com/obj/resourcesystem/images/a84/a841a39c-72dd-4e37-9f4b-204fde89374a/3a4a42814dfa2f6e.png) |
| Out[32]= | 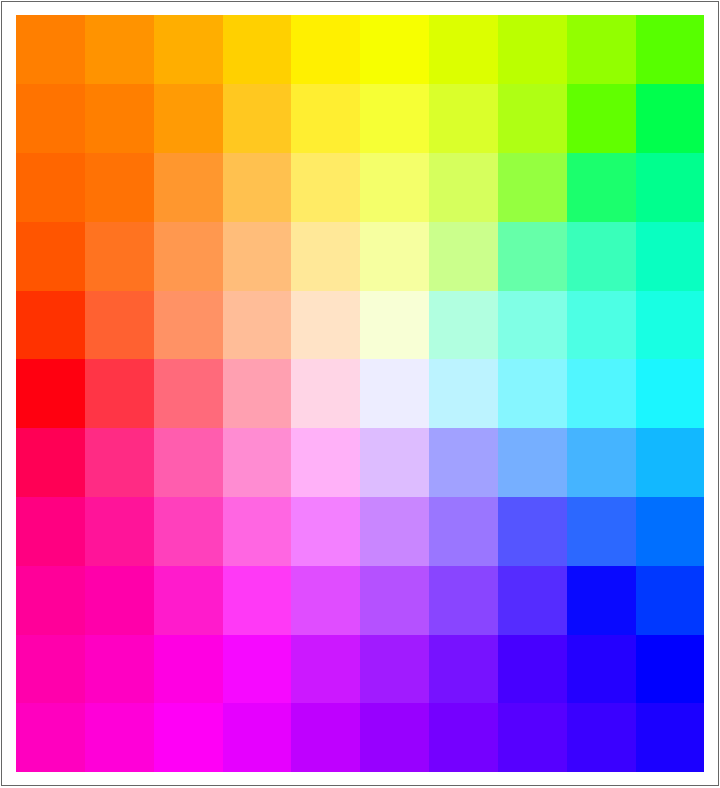 |
Use ArgHue in the ColorFunction setting of ComplexArrayPlot with the hue indicating the argument of the function value and a color that approaches Black as the function value approaches zero:
| In[33]:= | ![SetOptions[ResourceFunction["ArgHue"], "ZeroColor" -> Black];
ComplexArrayPlot[
Table[Sqrt[x^2 + y^2] E^(-I ArcTan[x, y]), {y, -2, 2.21, 0.42}, {x, -2, 2.1, 0.42}], ColorFunction -> {Function[{re, im, abs, arg}, ResourceFunction["ArgHue"][arg, abs/2]], None}, ColorFunctionScaling -> False]](https://www.wolframcloud.com/obj/resourcesystem/images/a84/a841a39c-72dd-4e37-9f4b-204fde89374a/742eb3617f3c18af.png) |
| Out[34]= | 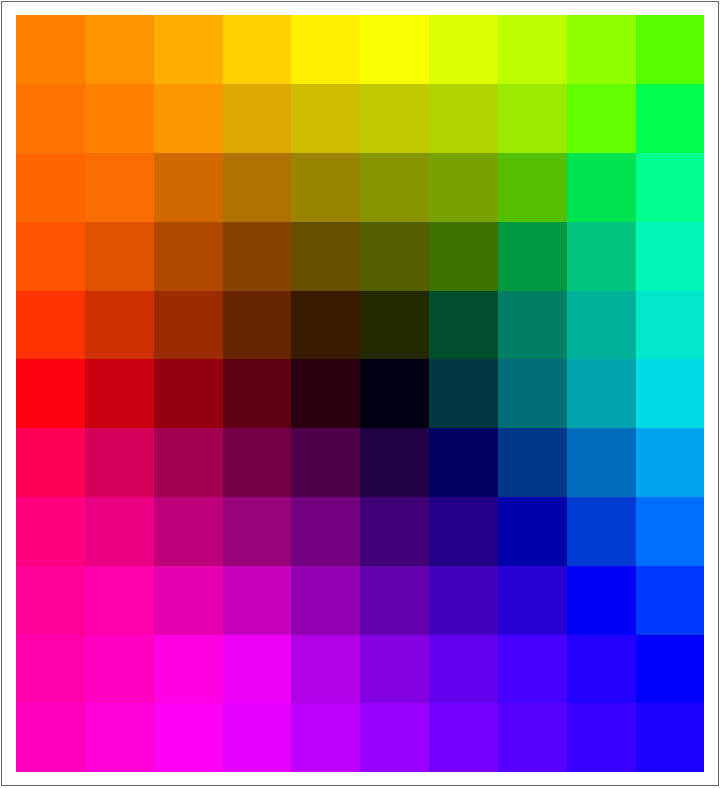 |
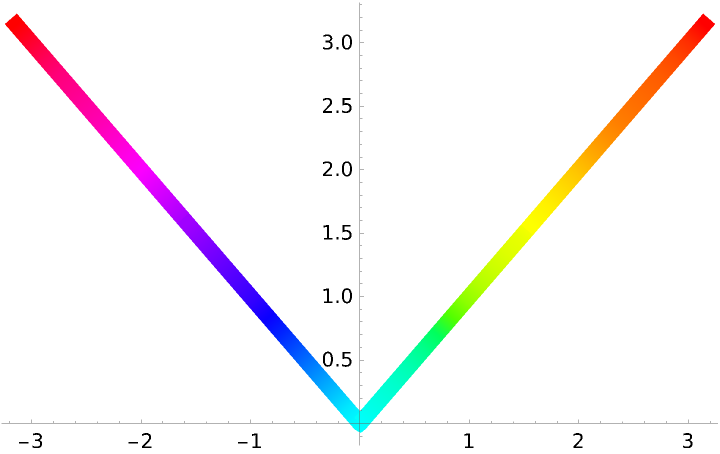
ArgHue[h] is periodic with period 2π:
| In[35]:= |
| Out[35]= |
This work is licensed under a Creative Commons Attribution 4.0 International License
![AbsArgPlot[Abs[\[Theta]] Exp[I \[Theta]], {\[Theta], -\[Pi], \[Pi]}, ColorFunction -> ResourceFunction["ArgHue"], ColorFunctionScaling -> False, PlotStyle -> AbsoluteThickness[8]]](https://www.wolframcloud.com/obj/resourcesystem/images/a84/a841a39c-72dd-4e37-9f4b-204fde89374a/500c920b3743f3f5.png)