Examples
Basic Examples (1)
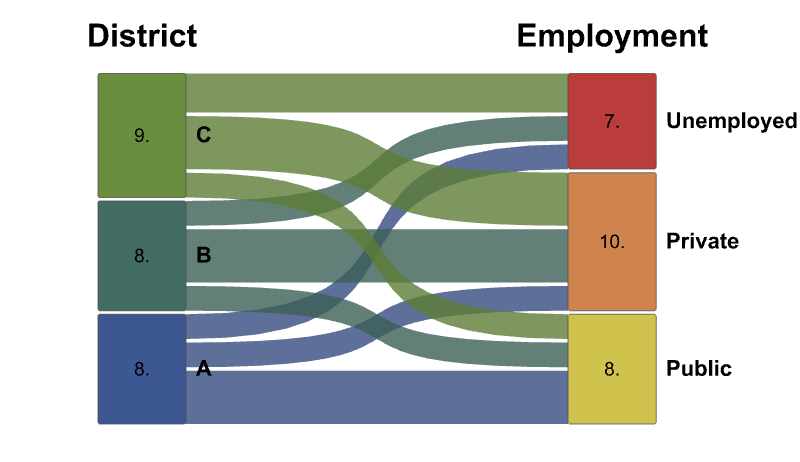
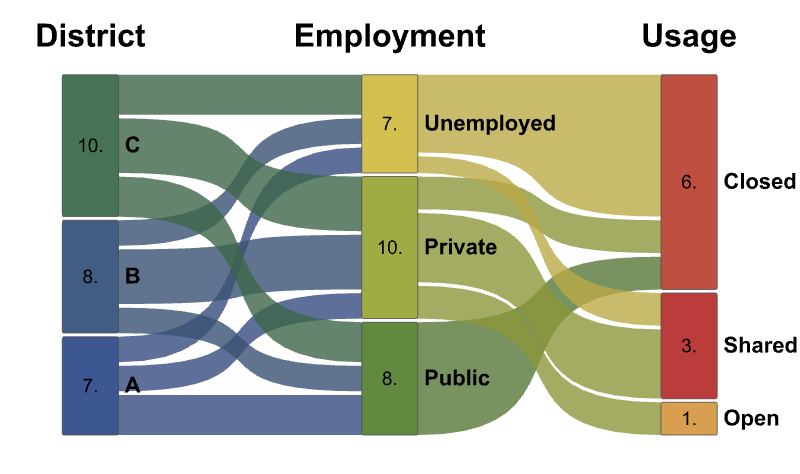
Construct a simple 2-stage alluvial diagram:
Options (10)
BlockWidth (1)
Specify the size of the stage blocks:
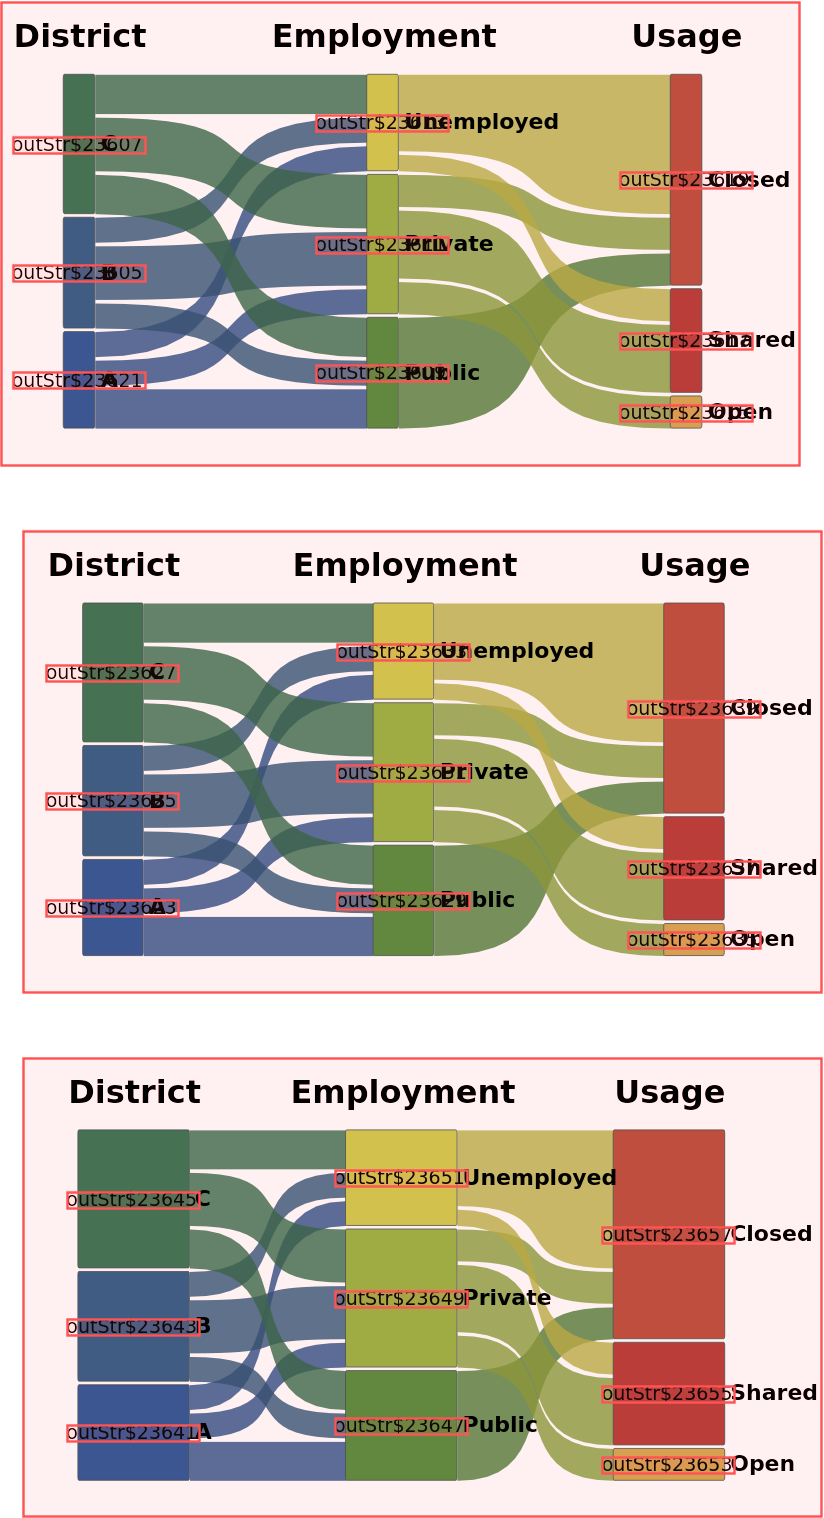
HorizontalSpacing (1)
Specify the size of the horizontal gap between the stage blocks, where the spacing specification can be a single list value that is used for all or a list of values that will be used accordingly:
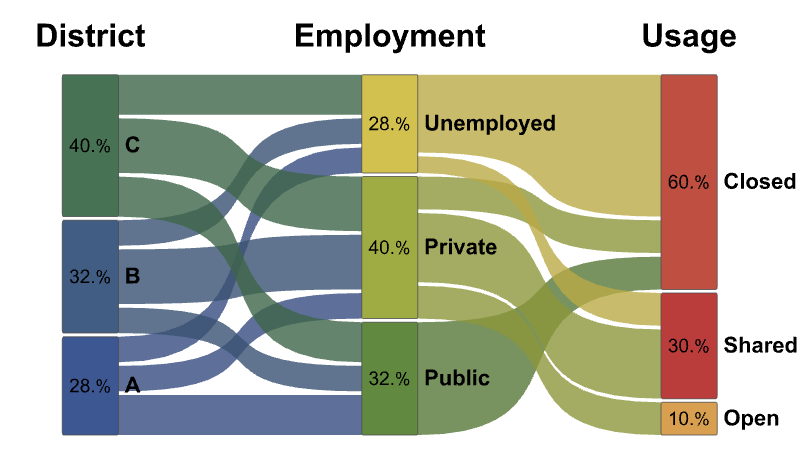
ShowPercentages (1)
Specify whether or not to show the stage blocks percentage value in the block rather than the raw value:
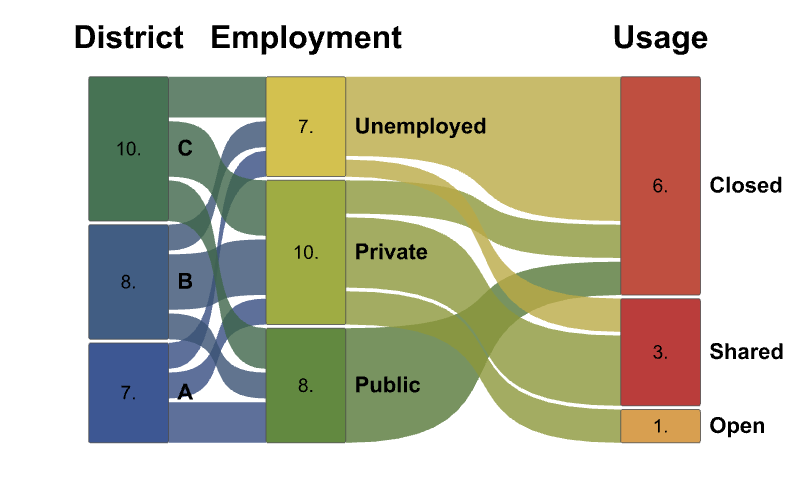
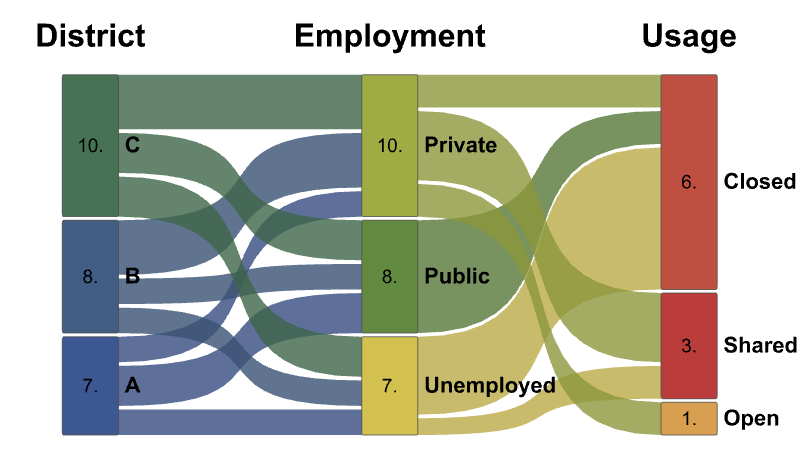
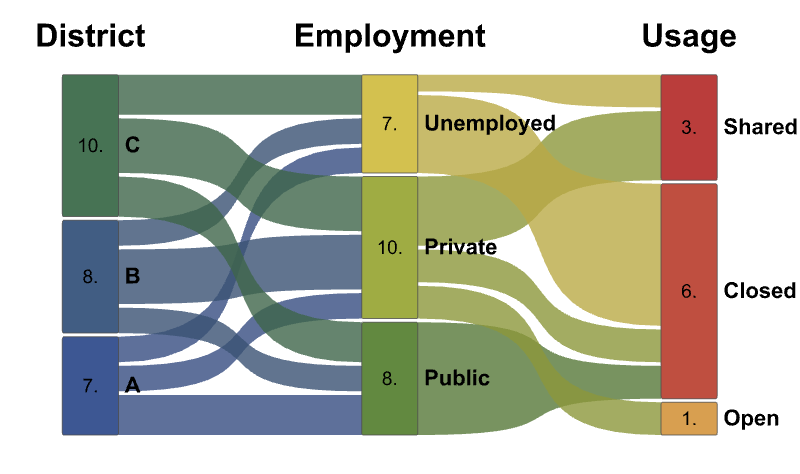
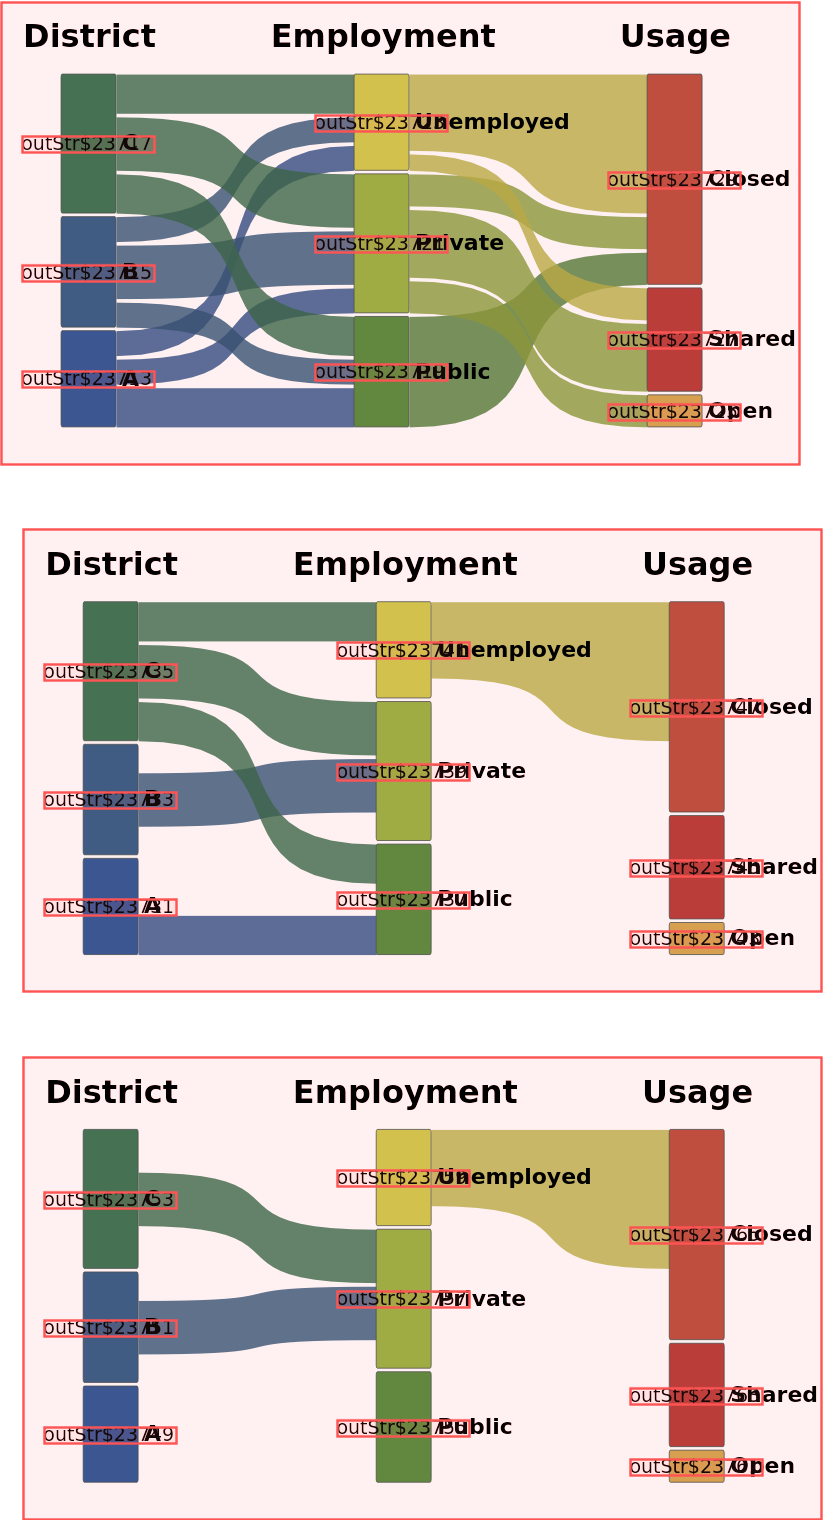
SortBySize (3)
Specify whether a sort function is to be applied to the stages. With the setting "Groups", AlluvialFlowChart tries to minimize flow crossings:
With the setting "SortBySize" → True, AlluvialFlowChart sorts the groups by size:
With the setting "SortBySize" → False. AlluvialFlowChart sorts each stage by reverse categories:
RibbonCurveFactor (1)
Specify the smoothness of the ribbon curves:
MinFlowThreshold (1)
Specify the minimum ribbon value that will be shown in the chart:
LabelStyle (1)
Specify a function that generates the style of the label element of the stage block:
ValueStyle (1)
Specify a function that generates the style of the value element within the stage block:
Properties and Relations (1)
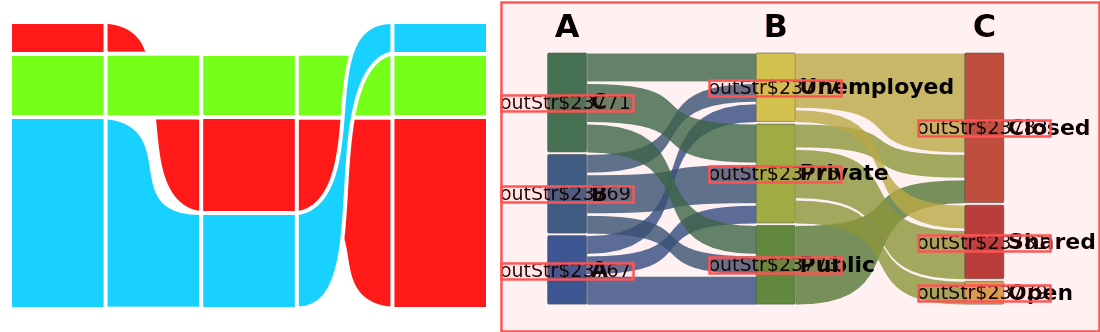
The ResourceFunction AlluvialChart has simpler visual functionality and fewer refinement options. Additionally, there is no mouseover functionality to show flows between neighbouring stages:
Publisher
Karl Fraser
Version History
-
1.0.1
– 05 June 2026
-
1.0.0
– 03 June 2026
Related Resources
![ResourceFunction["AlluvialFlowChart", ResourceVersion->"1.0.0"][{{(*A->{Public,Private,
Unemployed}*){4, 2, 2},(*B*){2, 4, 2},(*C*){2, 4, 3}}},
{(*district*){"A", "B", "C"},(*employed*){"Public", "Private", "Unemployed"}},
(*stages*){"District", "Employment"}, "ImageSize" -> 400]](https://www.wolframcloud.com/obj/resourcesystem/images/88a/88a94f54-1bd9-4a22-90b2-47f62c8b8293/1-0-0/412b9b733055b5a4.png)
![stages = {"District", "Employment", "Usage"};
categories = {(*district*){"A", "B", "C"},
(*employed*){"Public", "Private", "Unemployed"},
(*usage*){"Open", "Closed", "Shared"}};
employmentTotals = {(*A->{Public,Private,
Unemployed}*){3, 2, 2},(*B*){2, 4, 2},(*C*){3, 4, 3}};
usageTotals = {(*A->{Open,Closed,
Shared}*){0, 1, 0},(*B*){1, 1, 2},(*C*){0, 4, 1}};
flows = {employmentTotals, usageTotals};
ResourceFunction["AlluvialFlowChart"][flows, categories, stages, "ImageSize" -> 400, "BlockWidth" -> #] & /@ {0.25, 0.5, 1} // Row](https://www.wolframcloud.com/obj/resourcesystem/images/88a/88a94f54-1bd9-4a22-90b2-47f62c8b8293/1-0-0/3751b67b78176bb8.png)
![stages = {"District", "Employment", "Usage"};
categories = {(*district*){"A", "B", "C"},
(*employed*){"Public", "Private", "Unemployed"},
(*usage*){"Open", "Closed", "Shared"}};
employmentTotals = {(*A->{Public,Private,
Unemployed}*){3, 2, 2},(*B*){2, 4, 2},(*C*){3, 4, 3}};
usageTotals = {(*A->{Open,Closed,
Shared}*){0, 1, 0},(*B*){1, 1, 2},(*C*){0, 4, 1}};
flows = {employmentTotals, usageTotals}; ResourceFunction["AlluvialFlowChart", ResourceVersion->"1.0.0"][flows, categories, stages, "ImageSize" -> 400, "HorizontalSpacing" -> {1, 2}]](https://www.wolframcloud.com/obj/resourcesystem/images/88a/88a94f54-1bd9-4a22-90b2-47f62c8b8293/1-0-0/5c86f285c024c3cb.png)
![stages = {"District", "Employment", "Usage"};
categories = {(*district*){"A", "B", "C"},
(*employed*){"Public", "Private", "Unemployed"},
(*usage*){"Open", "Closed", "Shared"}};
employmentTotals = {(*A->{Public,Private,
Unemployed}*){3, 2, 2},(*B*){2, 4, 2},(*C*){3, 4, 3}};
usageTotals = {(*A->{Open,Closed,
Shared}*){0, 1, 0},(*B*){1, 1, 2},(*C*){0, 4, 1}};
flows = {employmentTotals, usageTotals}; ResourceFunction["AlluvialFlowChart", ResourceVersion->"1.0.0"][flows, categories, stages, "ImageSize" -> 400, "ShowPercentages" -> True]](https://www.wolframcloud.com/obj/resourcesystem/images/88a/88a94f54-1bd9-4a22-90b2-47f62c8b8293/1-0-0/733f8828fcb1034c.png)
![stages = {"District", "Employment", "Usage"};
categories = {(*district*){"A", "B", "C"},
(*employed*){"Public", "Private", "Unemployed"},
(*usage*){"Open", "Closed", "Shared"}};
employmentTotals = {(*A->{Public,Private,
Unemployed}*){3, 2, 2},(*B*){2, 4, 2},(*C*){3, 4, 3}};
usageTotals = {(*A->{Open,Closed,
Shared}*){0, 1, 0},(*B*){1, 1, 2},(*C*){0, 4, 1}};
flows = {employmentTotals, usageTotals}; ResourceFunction["AlluvialFlowChart", ResourceVersion->"1.0.0"][flows, categories, stages, "ImageSize" -> 400, "SortBySize" -> "Groups"]](https://www.wolframcloud.com/obj/resourcesystem/images/88a/88a94f54-1bd9-4a22-90b2-47f62c8b8293/1-0-0/2108c581c351a314.png)

![stages = {"District", "Employment", "Usage"};
categories = {(*district*){"A", "B", "C"},
(*employed*){"Public", "Private", "Unemployed"},
(*usage*){"Open", "Closed", "Shared"}};
employmentTotals = {(*A->{Public,Private,
Unemployed}*){3, 2, 2},(*B*){2, 4, 2},(*C*){3, 4, 3}};
usageTotals = {(*A->{Open,Closed,
Shared}*){0, 1, 0},(*B*){1, 1, 2},(*C*){0, 4, 1}};
flows = {employmentTotals, usageTotals};
ResourceFunction["AlluvialFlowChart"][flows, categories, stages, "ImageSize" -> 400, "RibbonCurveFactor" -> #] & /@ {0.1, .5, 1} // Row](https://www.wolframcloud.com/obj/resourcesystem/images/88a/88a94f54-1bd9-4a22-90b2-47f62c8b8293/1-0-0/7edd9ef760e0fdd4.png)
![stages = {"District", "Employment", "Usage"};
categories = {(*district*){"A", "B", "C"},
(*employed*){"Public", "Private", "Unemployed"},
(*usage*){"Open", "Closed", "Shared"}};
employmentTotals = {(*A->{Public,Private,
Unemployed}*){3, 2, 2},(*B*){2, 4, 2},(*C*){3, 4, 3}};
usageTotals = {(*A->{Open,Closed,
Shared}*){0, 1, 0},(*B*){1, 1, 2},(*C*){0, 4, 1}};
flows = {employmentTotals, usageTotals};
ResourceFunction["AlluvialFlowChart"][flows, categories, stages, "ImageSize" -> 400, "MinFlowThreshold" -> #] & /@ {1, 3, 4} // Row](https://www.wolframcloud.com/obj/resourcesystem/images/88a/88a94f54-1bd9-4a22-90b2-47f62c8b8293/1-0-0/310be7b06f5fab41.png)
![stages = {"District", "Employment", "Usage"};
categories = {(*district*){"A", "B", "C"},
(*employed*){"Public", "Private", "Unemployed"},
(*usage*){"Open", "Closed", "Shared"}};
employmentTotals = {(*A->{Public,Private,
Unemployed}*){3, 2, 2},(*B*){2, 4, 2},(*C*){3, 4, 3}};
usageTotals = {(*A->{Open,Closed,
Shared}*){0, 1, 0},(*B*){1, 1, 2},(*C*){0, 4, 1}};
flows = {employmentTotals, usageTotals}; ResourceFunction["AlluvialFlowChart", ResourceVersion->"1.0.0"][flows, categories, stages, "ImageSize" -> 400, "LabelStyle" -> Directive[FontFamily -> "Arial", FontWeight -> Italic]]](https://www.wolframcloud.com/obj/resourcesystem/images/88a/88a94f54-1bd9-4a22-90b2-47f62c8b8293/1-0-0/3238bbe914a0bcb4.png)
![stages = {"District", "Employment", "Usage"};
categories = {(*district*){"A", "B", "C"},
(*employed*){"Public", "Private", "Unemployed"},
(*usage*){"Open", "Closed", "Shared"}};
employmentTotals = {(*A->{Public,Private,
Unemployed}*){3, 2, 2},(*B*){2, 4, 2},(*C*){3, 4, 3}};
usageTotals = {(*A->{Open,Closed,
Shared}*){0, 1, 0},(*B*){1, 1, 2},(*C*){0, 4, 1}};
flows = {employmentTotals, usageTotals}; ResourceFunction["AlluvialFlowChart", ResourceVersion->"1.0.0"][flows, categories, stages, "ImageSize" -> 400, "ValueStyle" -> Directive[FontFamily -> "Arial", FontSize -> 20]]](https://www.wolframcloud.com/obj/resourcesystem/images/88a/88a94f54-1bd9-4a22-90b2-47f62c8b8293/1-0-0/4a223f7d2e1358b6.png)

![gs = Graph[{1 \[UndirectedEdge] 2, 2 \[UndirectedEdge] 3, 3 \[UndirectedEdge] 1}, VertexWeight -> #] & /@ {{1, 2, 6}, {3, 2, 3}, {6, 2, 1}};
alluvialChart = ResourceFunction["AlluvialChart"][gs, ImageSize -> 250];
categories = {(*district*){"A", "B", "C"},
(*employed*){"Public", "Private", "Unemployed"},
(*usage*){"Open", "Closed", "Shared"}};
employmentTotals = {(*A->{Public,Private,
Unemployed}*){3, 2, 2},(*B*){2, 4, 2},(*C*){3, 4, 3}};
usageTotals = {(*A->{Open,Closed,
Shared}*){0, 1, 0},(*B*){1, 1, 2},(*C*){0, 4, 1}};
flows = {employmentTotals, usageTotals};
alluvialFlowChart = ResourceFunction["AlluvialFlowChart"][flows, categories, {"A", "B", "C", "D", "E"}, "ImageSize" -> 300, "LabelStyle" -> Directive[FontFamily -> "Arial", FontWeight -> Italic]];
Row[{alluvialChart, alluvialFlowChart}]](https://www.wolframcloud.com/obj/resourcesystem/images/88a/88a94f54-1bd9-4a22-90b2-47f62c8b8293/1-0-0/4fcd0cef839dd433.png)