Wolfram Function Repository
Instant-use add-on functions for the Wolfram Language
Function Repository Resource:
Chart changing weights over multiple stages
ResourceFunction["AlluvialFlowChart"][flows,categories,stages] generates an alluvial chart of flows over categories through stages. |
| "BlockWidth" | 0.25 | width of stage blocks |
| "HorizontalSpacing" | 2.4 | horizontal gap between stage blocks |
| "SortBySize" | "Groups" | sort by stage groups |
| "RibbonCurveFactor" | 0.75 | how much the ribbons curve |
| "MinFlowThreshold" | 3 | minimum value to show |
| "ShowPercentages" | False | whether to show the percentages |
| LabelStyle | Directive[FontFamily→\"Arial\",FontWeight→Bold] | label styling |
| "ValueStyle" | Directive[FontFamily→\"Arial\",FontSize→9.5] | value styling |
Construct a simple 2-stage alluvial diagram:
| In[1]:= | ![ResourceFunction[
"AlluvialFlowChart", ResourceSystemBase -> "https://www.wolframcloud.com/obj/resourcesystem/api/1.0"][{{(*A->{Public,Private,
Unemployed}*){4, 2, 2},(*B*){2, 4, 2},(*C*){2, 4, 3}}},
{(*district*){"A", "B", "C"},(*employed*){"Public", "Private", "Unemployed"}},
(*stages*){"District", "Employment"}, "ImageSize" -> 400]](https://www.wolframcloud.com/obj/resourcesystem/images/88a/88a94f54-1bd9-4a22-90b2-47f62c8b8293/03c095048abcbd0d.png) |
| Out[1]= | 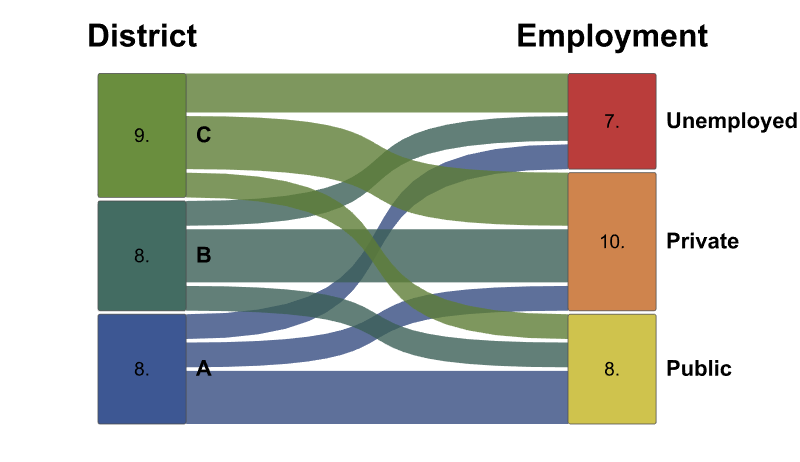 |
When the mouse is moved over a stage, neighbouring connected stages are highlighted with their values updated accordingly:
| In[2]:= | ![stages = {"District", "Employment", "Usage"};
categories = {(*district*){"A", "B", "C"},
(*employed*){"Public", "Private", "Unemployed"},
(*usage*){"Open", "Closed", "Shared"}};
employmentTotals = {(*A->{Public,Private,
Unemployed}*){3, 2, 2},(*B*){2, 4, 2},(*C*){3, 4, 3}};
usageTotals = {(*Public->{Open,Closed,
Shared}*){0, 1, 0},(*Private*){1, 1, 2},(*Unemployed*){0, 4, 1}};
flows = {employmentTotals, usageTotals}; ResourceFunction[
"AlluvialFlowChart", ResourceSystemBase -> "https://www.wolframcloud.com/obj/resourcesystem/api/1.0"][flows, categories, stages, "ImageSize" -> 400]](https://www.wolframcloud.com/obj/resourcesystem/images/88a/88a94f54-1bd9-4a22-90b2-47f62c8b8293/066a387f36a9d315.png) |
Specify the size of the stage blocks:
| In[3]:= | ![stages = {"District", "Employment", "Usage"};
categories = {(*district*){"A", "B", "C"},
(*employed*){"Public", "Private", "Unemployed"},
(*usage*){"Open", "Closed", "Shared"}};
employmentTotals = {(*A->{Public,Private,
Unemployed}*){3, 2, 2},(*B*){2, 4, 2},(*C*){3, 4, 3}};
usageTotals = {(*Public->{Open,Closed,
Shared}*){0, 1, 0},(*Private*){1, 1, 2},(*Unemployed*){0, 4, 1}};
flows = {employmentTotals, usageTotals};
ResourceFunction[
"AlluvialFlowChart", ResourceSystemBase -> "https://www.wolframcloud.com/obj/resourcesystem/api/1.0"][flows, categories, stages, "ImageSize" -> 300, "BlockWidth" -> #] & /@ {0.25, 0.5, 1} // Row](https://www.wolframcloud.com/obj/resourcesystem/images/88a/88a94f54-1bd9-4a22-90b2-47f62c8b8293/2d55b55437ee8830.png) |
| Out[4]= | 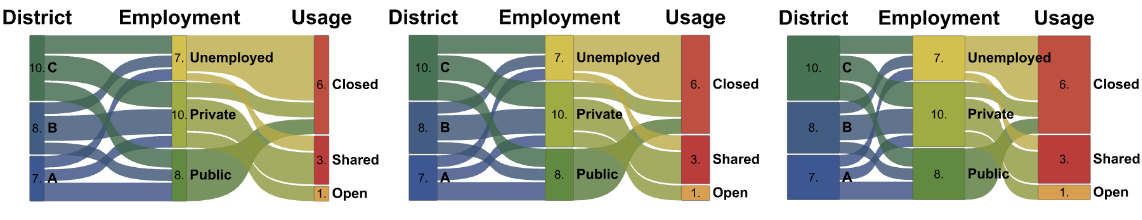 |
Specify the size of the horizontal gap between the stage blocks, where the spacing specification can be a single list value that is used for all or a list of values that will be used accordingly:
| In[5]:= | ![stages = {"District", "Employment", "Usage"};
categories = {(*district*){"A", "B", "C"},
(*employed*){"Public", "Private", "Unemployed"},
(*usage*){"Open", "Closed", "Shared"}};
employmentTotals = {(*A->{Public,Private,
Unemployed}*){3, 2, 2},(*B*){2, 4, 2},(*C*){3, 4, 3}};
usageTotals = {(*Public->{Open,Closed,
Shared}*){0, 1, 0},(*Private*){1, 1, 2},(*Unemployed*){0, 4, 1}};
flows = {employmentTotals, usageTotals}; ResourceFunction[
"AlluvialFlowChart", ResourceSystemBase -> "https://www.wolframcloud.com/obj/resourcesystem/api/1.0"][flows, categories, stages, "ImageSize" -> 400, "HorizontalSpacing" -> {1, 2}]](https://www.wolframcloud.com/obj/resourcesystem/images/88a/88a94f54-1bd9-4a22-90b2-47f62c8b8293/540c63e069ff8e6b.png) |
| Out[6]= | 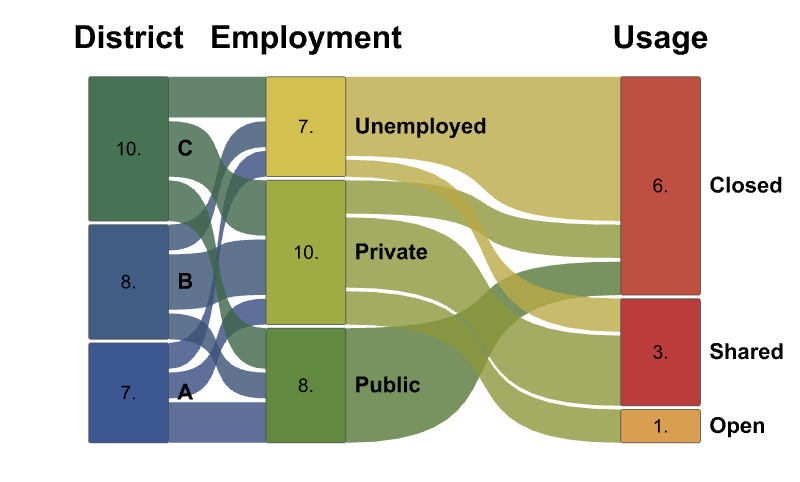 |
Specify whether or not to show the stage blocks percentage value in the block rather than the raw value:
| In[7]:= | ![stages = {"District", "Employment", "Usage"};
categories = {(*district*){"A", "B", "C"},
(*employed*){"Public", "Private", "Unemployed"},
(*usage*){"Open", "Closed", "Shared"}};
employmentTotals = {(*A->{Public,Private,
Unemployed}*){3, 2, 2},(*B*){2, 4, 2},(*C*){3, 4, 3}};
usageTotals = {(*Public->{Open,Closed,
Shared}*){0, 1, 0},(*Private*){1, 1, 2},(*Unemployed*){0, 4, 1}};
flows = {employmentTotals, usageTotals}; ResourceFunction[
"AlluvialFlowChart", ResourceSystemBase -> "https://www.wolframcloud.com/obj/resourcesystem/api/1.0"][flows, categories, stages, "ImageSize" -> 400, "ShowPercentages" -> True]](https://www.wolframcloud.com/obj/resourcesystem/images/88a/88a94f54-1bd9-4a22-90b2-47f62c8b8293/2af408fa0eae3d91.png) |
| Out[8]= |  |
Specify whether a sort function is to be applied to the stages. With the setting "Groups", AlluvialFlowChart tries to minimize flow crossings:
| In[9]:= | ![stages = {"District", "Employment", "Usage"};
categories = {(*district*){"A", "B", "C"},
(*employed*){"Public", "Private", "Unemployed"},
(*usage*){"Open", "Closed", "Shared"}};
employmentTotals = {(*A->{Public,Private,
Unemployed}*){3, 2, 2},(*B*){2, 4, 2},(*C*){3, 4, 3}};
usageTotals = {(*Public->{Open,Closed,
Shared}*){0, 1, 0},(*Private*){1, 1, 2},(*Unemployed*){0, 4, 1}};
flows = {employmentTotals, usageTotals}; ResourceFunction[
"AlluvialFlowChart", ResourceSystemBase -> "https://www.wolframcloud.com/obj/resourcesystem/api/1.0"][flows, categories, stages, "ImageSize" -> 400, "SortBySize" -> "Groups"]](https://www.wolframcloud.com/obj/resourcesystem/images/88a/88a94f54-1bd9-4a22-90b2-47f62c8b8293/250e984732e2eb15.png) |
| Out[10]= | 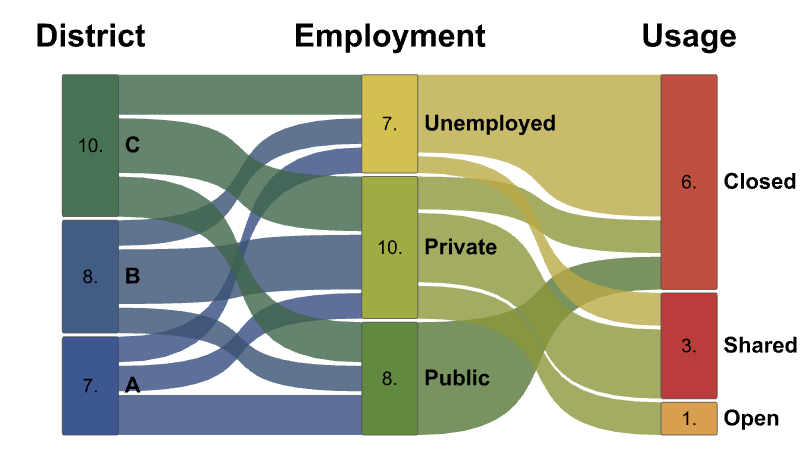 |
True - sort each stage big to small values:
| In[11]:= | ![stages = {"District", "Employment", "Usage"};
categories = {(*district*){"A", "B", "C"},
(*employed*){"Public", "Private", "Unemployed"},
(*usage*){"Open", "Closed", "Shared"}};
employmentTotals = {(*A->{Public,Private,
Unemployed}*){3, 2, 2},(*B*){2, 4, 2},(*C*){3, 4, 3}};
usageTotals = {(*Public->{Open,Closed,
Shared}*){0, 1, 0},(*Private*){1, 1, 2},(*Unemployed*){0, 4, 1}};
flows = {employmentTotals, usageTotals}; ResourceFunction[
"AlluvialFlowChart", ResourceSystemBase -> "https://www.wolframcloud.com/obj/resourcesystem/api/1.0"][flows, categories, stages, "ImageSize" -> 400, "SortBySize" -> True]](https://www.wolframcloud.com/obj/resourcesystem/images/88a/88a94f54-1bd9-4a22-90b2-47f62c8b8293/325ce9160822900e.png) |
| Out[12]= | 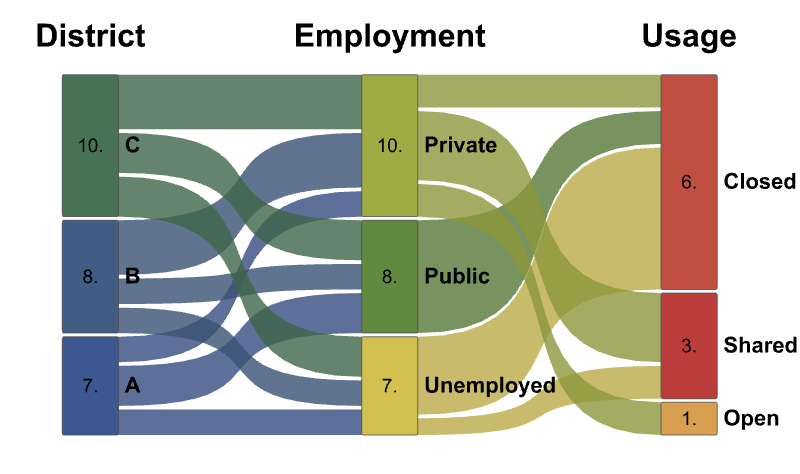 |
fallback - sort each stage by reverse categories:
| In[13]:= | ![stages = {"District", "Employment", "Usage"};
categories = {(*district*){"A", "B", "C"},
(*employed*){"Public", "Private", "Unemployed"},
(*usage*){"Open", "Closed", "Shared"}};
employmentTotals = {(*A->{Public,Private,
Unemployed}*){3, 2, 2},(*B*){2, 4, 2},(*C*){3, 4, 3}};
usageTotals = {(*Public->{Open,Closed,
Shared}*){0, 1, 0},(*Private*){1, 1, 2},(*Unemployed*){0, 4, 1}};
flows = {employmentTotals, usageTotals}; ResourceFunction[
"AlluvialFlowChart", ResourceSystemBase -> "https://www.wolframcloud.com/obj/resourcesystem/api/1.0"][flows, categories, stages, "ImageSize" -> 400, "SortBySize" -> False]](https://www.wolframcloud.com/obj/resourcesystem/images/88a/88a94f54-1bd9-4a22-90b2-47f62c8b8293/1d77c5ad7c0d80e0.png) |
| Out[14]= | 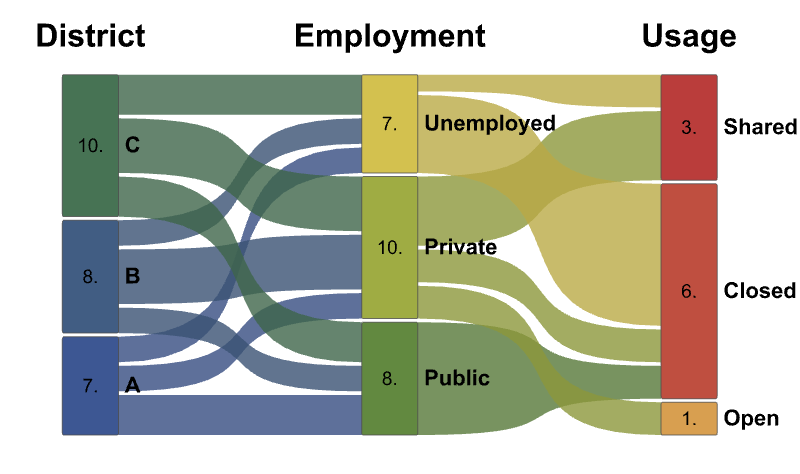 |
Specify the smoothness of the ribbon curves:
| In[15]:= | ![stages = {"District", "Employment", "Usage"};
categories = {(*district*){"A", "B", "C"},
(*employed*){"Public", "Private", "Unemployed"},
(*usage*){"Open", "Closed", "Shared"}};
employmentTotals = {(*A->{Public,Private,
Unemployed}*){3, 2, 2},(*B*){2, 4, 2},(*C*){3, 4, 3}};
usageTotals = {(*Public->{Open,Closed,
Shared}*){0, 1, 0},(*Private*){1, 1, 2},(*Unemployed*){0, 4, 1}};
flows = {employmentTotals, usageTotals};
ResourceFunction[
"AlluvialFlowChart", ResourceSystemBase -> "https://www.wolframcloud.com/obj/resourcesystem/api/1.0"][flows, categories, stages, "ImageSize" -> 300, "RibbonCurveFactor" -> #] & /@ {0.1, .5, 1} // Row](https://www.wolframcloud.com/obj/resourcesystem/images/88a/88a94f54-1bd9-4a22-90b2-47f62c8b8293/062749bef89b3731.png) |
| Out[16]= | 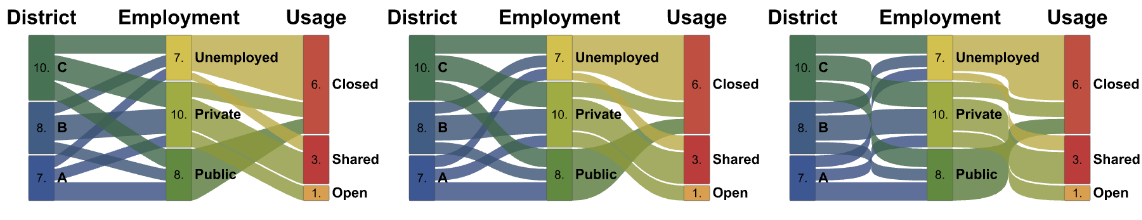 |
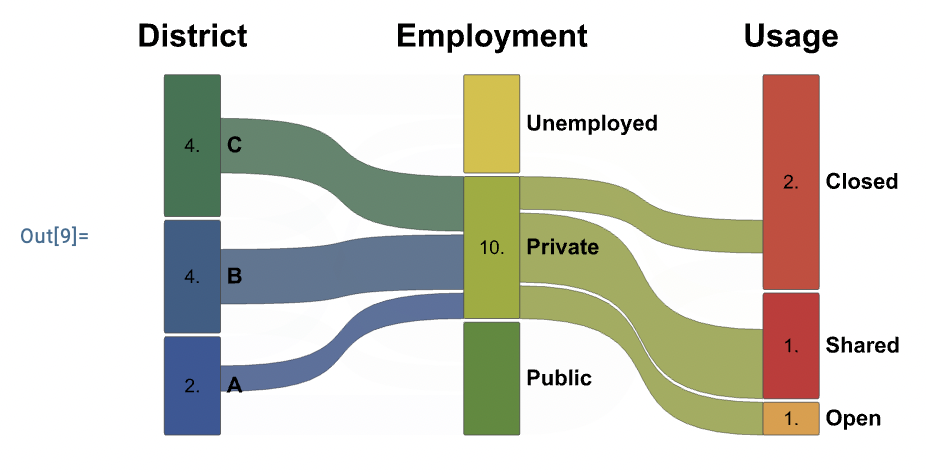
Specify the minimum ribbon value that will be shown in the chart:
| In[17]:= | ![stages = {"District", "Employment", "Usage"};
categories = {(*district*){"A", "B", "C"},
(*employed*){"Public", "Private", "Unemployed"},
(*usage*){"Open", "Closed", "Shared"}};
employmentTotals = {(*A->{Public,Private,
Unemployed}*){3, 2, 2},(*B*){2, 4, 2},(*C*){3, 4, 3}};
usageTotals = {(*Public->{Open,Closed,
Shared}*){0, 1, 0},(*Private*){1, 1, 2},(*Unemployed*){0, 4, 1}};
flows = {employmentTotals, usageTotals};
ResourceFunction[
"AlluvialFlowChart", ResourceSystemBase -> "https://www.wolframcloud.com/obj/resourcesystem/api/1.0"][flows, categories, stages, "ImageSize" -> 300, "MinFlowThreshold" -> #] & /@ {1, 3, 4} // Row](https://www.wolframcloud.com/obj/resourcesystem/images/88a/88a94f54-1bd9-4a22-90b2-47f62c8b8293/2fd68592c326ba78.png) |
| Out[18]= | 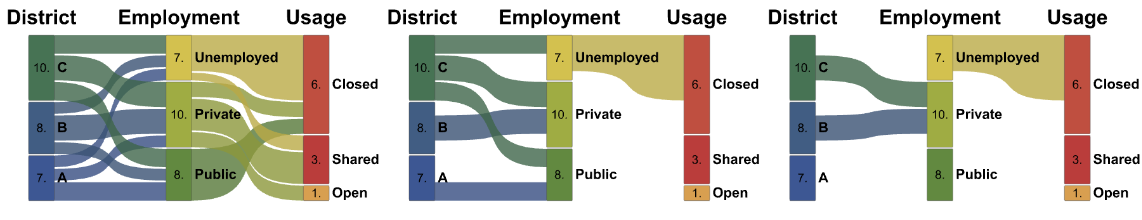 |
Specify a function that generates the style of the label element of the stage block:
| In[19]:= | ![stages = {"District", "Employment", "Usage"};
categories = {(*district*){"A", "B", "C"},
(*employed*){"Public", "Private", "Unemployed"},
(*usage*){"Open", "Closed", "Shared"}};
employmentTotals = {(*A->{Public,Private,
Unemployed}*){3, 2, 2},(*B*){2, 4, 2},(*C*){3, 4, 3}};
usageTotals = {(*Public->{Open,Closed,
Shared}*){0, 1, 0},(*Private*){1, 1, 2},(*Unemployed*){0, 4, 1}};
flows = {employmentTotals, usageTotals}; ResourceFunction[
"AlluvialFlowChart", ResourceSystemBase -> "https://www.wolframcloud.com/obj/resourcesystem/api/1.0"][flows, categories, stages, "ImageSize" -> 400, "LabelStyle" -> Directive[FontFamily -> "Arial", FontWeight -> Bold]]](https://www.wolframcloud.com/obj/resourcesystem/images/88a/88a94f54-1bd9-4a22-90b2-47f62c8b8293/6ed94eb137903c20.png) |
| Out[20]= |  |
Specify a function that generates the style of the value element within the stage block:
| In[21]:= | ![stages = {"District", "Employment", "Usage"};
categories = {(*district*){"A", "B", "C"},
(*employed*){"Public", "Private", "Unemployed"},
(*usage*){"Open", "Closed", "Shared"}};
employmentTotals = {(*A->{Public,Private,
Unemployed}*){3, 2, 2},(*B*){2, 4, 2},(*C*){3, 4, 3}};
usageTotals = {(*Public->{Open,Closed,
Shared}*){0, 1, 0},(*Private*){1, 1, 2},(*Unemployed*){0, 4, 1}};
flows = {employmentTotals, usageTotals}; ResourceFunction[
"AlluvialFlowChart", ResourceSystemBase -> "https://www.wolframcloud.com/obj/resourcesystem/api/1.0"][flows, categories, stages, "ImageSize" -> 400, "ValueStyle" -> Directive[FontFamily -> "Arial", FontSize -> 20]]](https://www.wolframcloud.com/obj/resourcesystem/images/88a/88a94f54-1bd9-4a22-90b2-47f62c8b8293/1aa6b53ab83920f5.png) |
| Out[25]= | 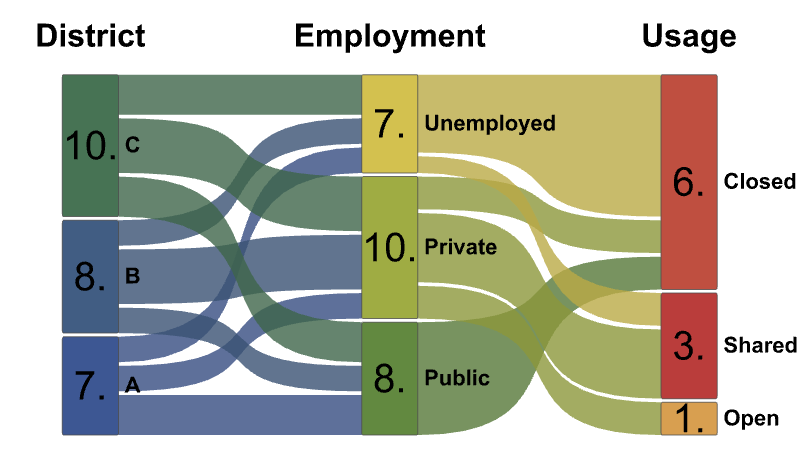 |
The ResourceFunction AlluvialChart has simpler visual functionality and fewer refinement options. Additionally, there is no mouseover functionality to show flows between neighbouring stages:
| In[26]:= | ![gs = Graph[{1 \[UndirectedEdge] 2, 2 \[UndirectedEdge] 3, 3 \[UndirectedEdge] 1}, VertexWeight -> #] & /@ {{1, 2, 6}, {3, 2, 3}, {6, 2, 1}};
alluvialChart = ResourceFunction["AlluvialChart"][gs, ImageSize -> 250];
categories = {(*district*){"A", "B", "C"},
(*employed*){"Public", "Private", "Unemployed"},
(*usage*){"Open", "Closed", "Shared"}};
employmentTotals = {(*A->{Public,Private,
Unemployed}*){3, 2, 2},(*B*){2, 4, 2},(*C*){3, 4, 3}};
usageTotals = {(*Public->{Open,Closed,
Shared}*){0, 1, 0},(*Private*){1, 1, 2},(*Unemployed*){0, 4, 1}};
flows = {employmentTotals, usageTotals};
alluvialFlowChart = ResourceFunction[
"AlluvialFlowChart", ResourceSystemBase -> "https://www.wolframcloud.com/obj/resourcesystem/api/1.0"][flows, categories, {"A", "B", "C", "D", "E"},
"ImageSize" -> 300, "LabelStyle" -> Directive[FontFamily -> "Arial", FontWeight -> Italic]];
Row[{alluvialChart, alluvialFlowChart}]](https://www.wolframcloud.com/obj/resourcesystem/images/88a/88a94f54-1bd9-4a22-90b2-47f62c8b8293/06a87a71afefda56.png) |
| Out[27]= | 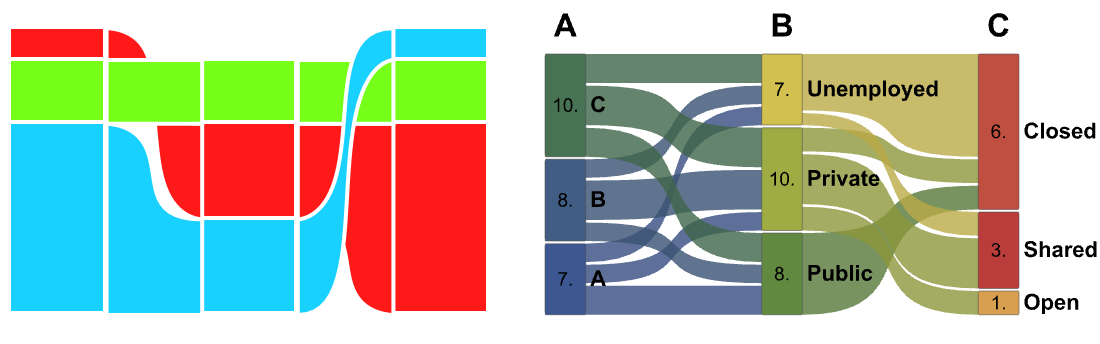 |
Wolfram Language 13.0 (December 2021) or above
This work is licensed under a Creative Commons Attribution 4.0 International License