Wolfram Function Repository
Instant-use add-on functions for the Wolfram Language
Function Repository Resource:
Visualize 3D geographics with elevation
ResourceFunction["GeoElevationGraphics3D"][primitives] generates a 3D surface of GeoElevationData with GeoGraphics mapped onto the surface. |
| "SeaLevelStyle" | None | style for drawing a layer to show sea level |
Generate a 3D map of the region around Durham, UK:
| In[1]:= |
|
| Out[1]= |
|
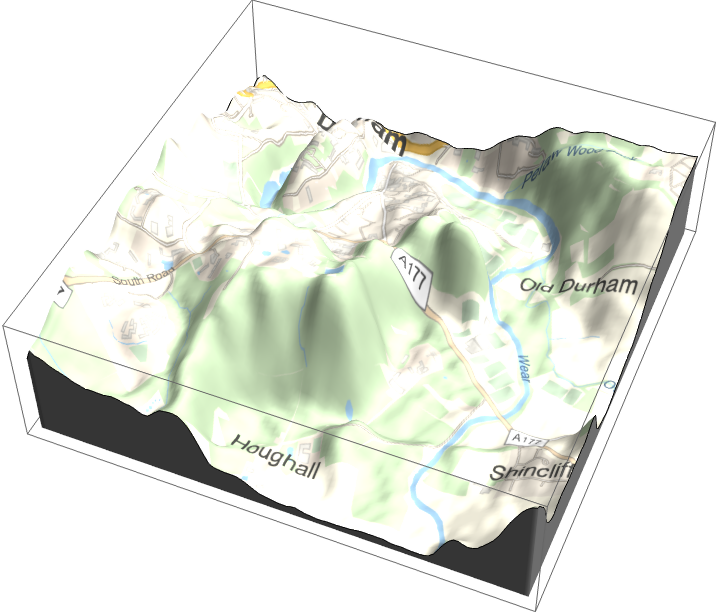
Most GeoGraphics options are supported:
| In[3]:= |
![ResourceFunction["GeoElevationGraphics3D"][
Entity["City", {"Durham", "Durham", "UnitedKingdom"}], GeoBackground -> "VectorClassic", GeoRange -> Quantity[0.75, "Miles"]]](https://www.wolframcloud.com/obj/resourcesystem/images/485/485db033-40d9-4b4c-8b1d-c71adf2cbdd9/43f3007afd4dca31.png)
|
| Out[3]= |
|
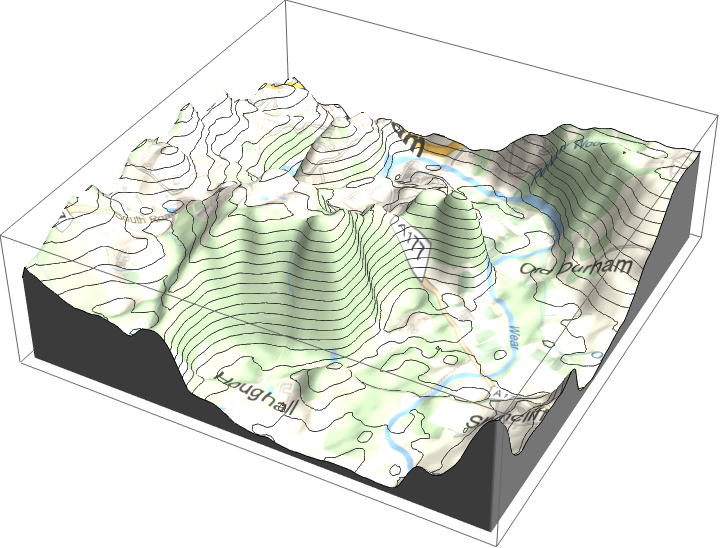
Most ListPlot3D options are supported:
| In[4]:= |
![ResourceFunction["GeoElevationGraphics3D"][
Entity["City", {"Durham", "Durham", "UnitedKingdom"}], GeoBackground -> "VectorClassic", GeoRange -> Quantity[0.75, "Miles"], MeshFunctions -> {#3 &}, Mesh -> True]](https://www.wolframcloud.com/obj/resourcesystem/images/485/485db033-40d9-4b4c-8b1d-c71adf2cbdd9/6db62863ded1e79a.png)
|
| Out[4]= |
|
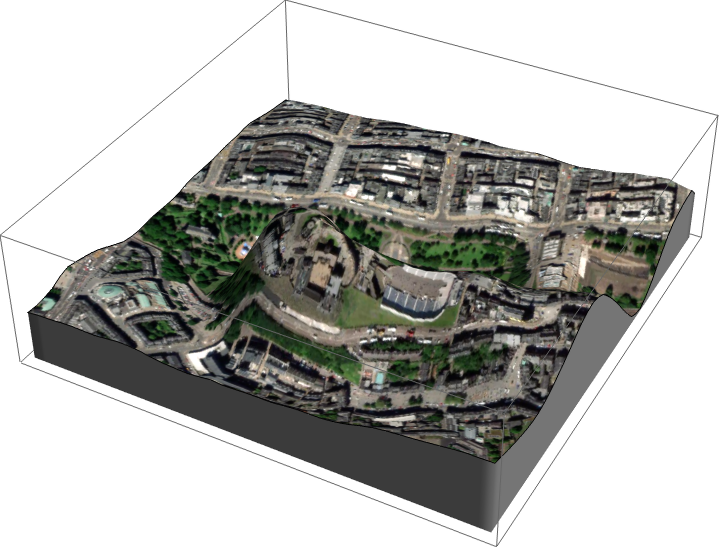
All GeoBackground values are supported:
| In[5]:= |
![ResourceFunction["GeoElevationGraphics3D"][
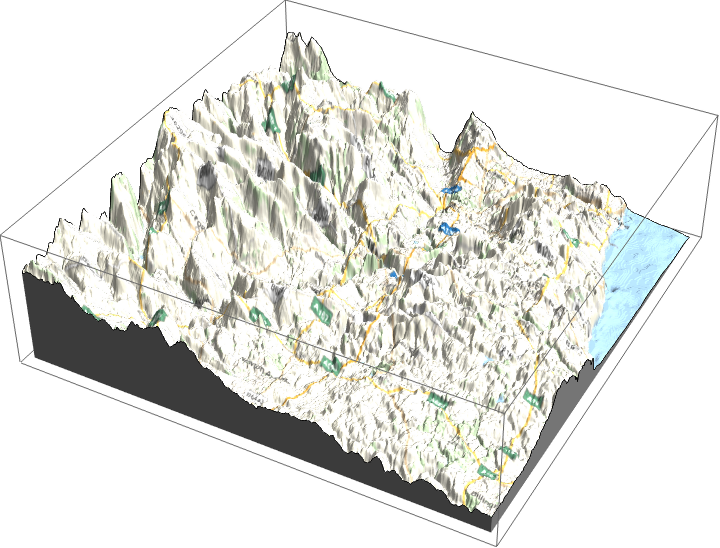
Entity["City", {"Edinburgh", "Edinburgh", "UnitedKingdom"}], GeoBackground -> "Satellite", GeoServer -> "DigitalGlobe", GeoRange -> Quantity[0.25, "Miles"]]](https://www.wolframcloud.com/obj/resourcesystem/images/485/485db033-40d9-4b4c-8b1d-c71adf2cbdd9/6e21aad425a4173c.png)
|
| Out[5]= |
|
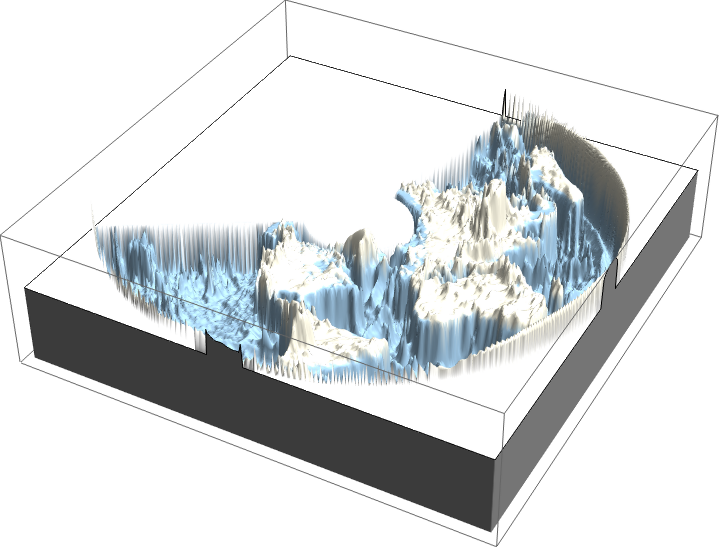
GeoElevationGraphics3D displays underwater levels by default:
| In[6]:= |
|
| Out[6]= |

|
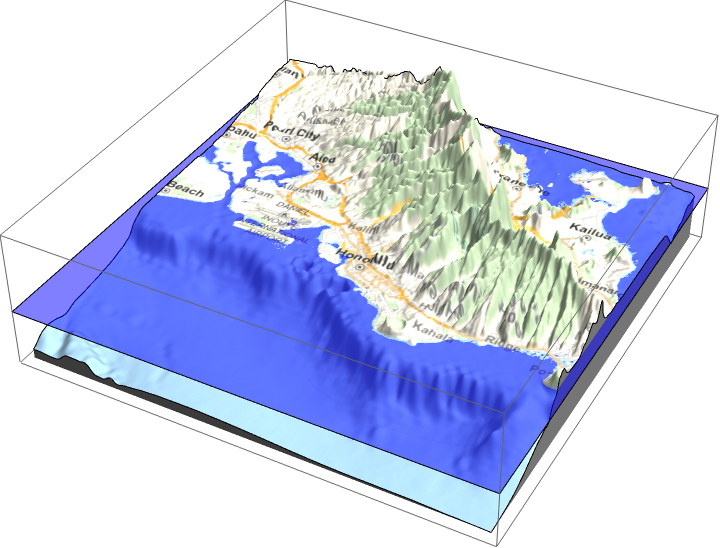
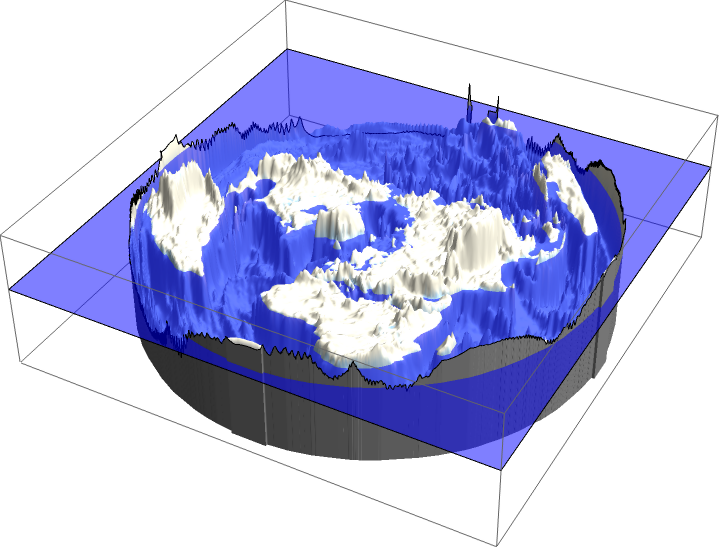
You can also display sea level using "SeaLevelStyle":
| In[7]:= |
![ResourceFunction["GeoElevationGraphics3D"][
Entity["City", {"Honolulu", "Hawaii", "UnitedStates"}], GeoRange -> Quantity[10, "Miles"], "SeaLevelStyle" -> Automatic]](https://www.wolframcloud.com/obj/resourcesystem/images/485/485db033-40d9-4b4c-8b1d-c71adf2cbdd9/0ae51201b53a28da.png)
|
| Out[7]= |
|
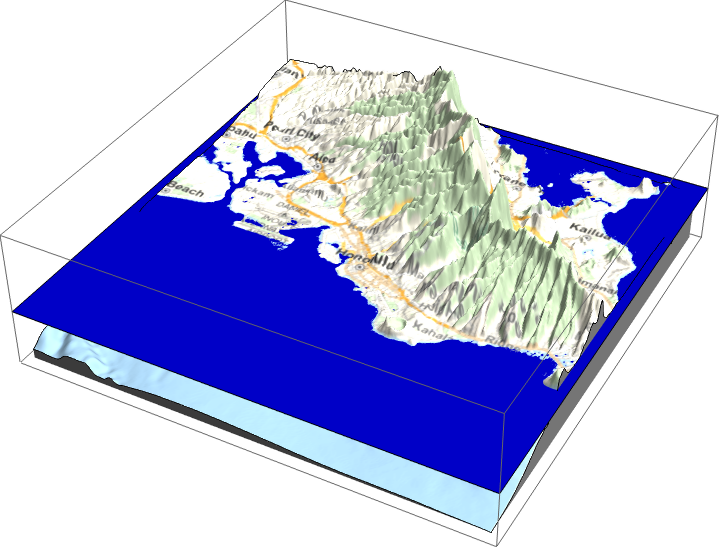
Display sea level using "SeaLevelStyle", which accepts any style directives:
| In[8]:= |
![ResourceFunction["GeoElevationGraphics3D"][
Entity["City", {"Honolulu", "Hawaii", "UnitedStates"}], GeoRange -> Quantity[10, "Miles"], "SeaLevelStyle" -> Darker@Blue]](https://www.wolframcloud.com/obj/resourcesystem/images/485/485db033-40d9-4b4c-8b1d-c71adf2cbdd9/460b172e6dbabc14.png)
|
| Out[8]= |
|
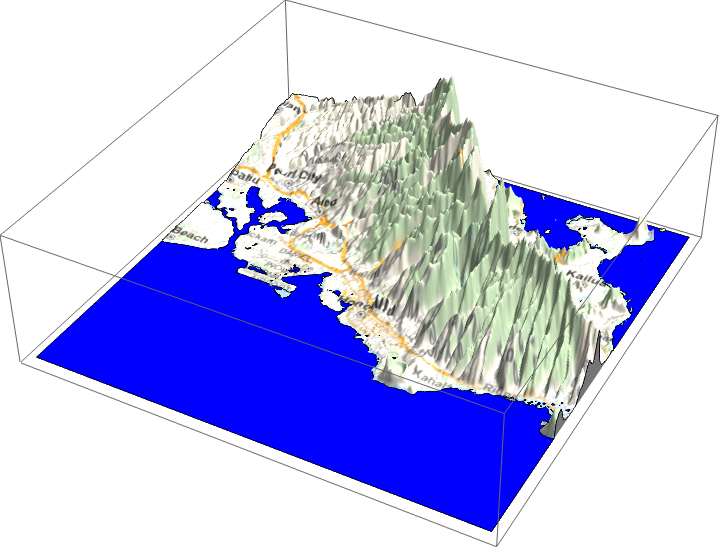
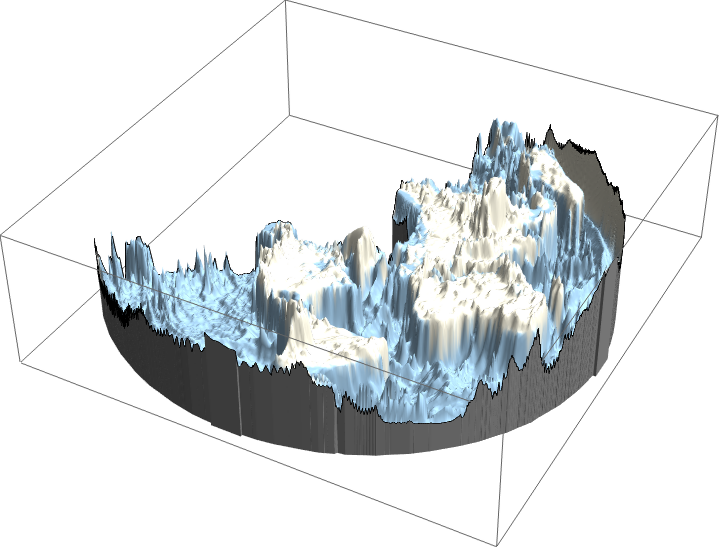
Alternatively you can use PlotRange to only display positive values:
| In[9]:= |
![ResourceFunction["GeoElevationGraphics3D"][
Entity["City", {"Honolulu", "Hawaii", "UnitedStates"}], GeoRange -> Quantity[10, "Miles"], PlotRange -> {0, All}, ClippingStyle -> Blue]](https://www.wolframcloud.com/obj/resourcesystem/images/485/485db033-40d9-4b4c-8b1d-c71adf2cbdd9/5630e3188be23ea3.png)
|
| Out[9]= |
|
At a large scale, some map projections produce non-rectangular regions:
| In[10]:= |
![ResourceFunction["GeoElevationGraphics3D"][{}, GeoRange -> "World", GeoZoomLevel -> 1, GeoRange -> "World", GeoProjection -> {"Albers", "Centering" -> GeoPosition[{40, -90}], "StandardParallels" -> {30, 50}}]](https://www.wolframcloud.com/obj/resourcesystem/images/485/485db033-40d9-4b4c-8b1d-c71adf2cbdd9/29a54babb7693dd0.png)
|
| Out[10]= |
|
Using RegionFunction→Automatic will attempt to trim the graphic to only show mapped areas:
| In[11]:= |
![ResourceFunction["GeoElevationGraphics3D"][{}, GeoRange -> "World", GeoZoomLevel -> 1, GeoRange -> "World", GeoProjection -> {"Albers", "Centering" -> GeoPosition[{40, -90}], "StandardParallels" -> {30, 50}}, RegionFunction -> Automatic]](https://www.wolframcloud.com/obj/resourcesystem/images/485/485db033-40d9-4b4c-8b1d-c71adf2cbdd9/55435fddba9c2113.png)
|
| Out[11]= |
|
All GeoElevationGraphics3D use a planar map projection, resulting in "flat earth" graphics at a large scale:
| In[12]:= |
![ResourceFunction["GeoElevationGraphics3D"][{}, GeoRange -> "World", GeoZoomLevel -> 1, GeoProjection -> {"LambertAzimuthal", "Centering" -> GeoPosition[{90, 0}]}, RegionFunction -> Automatic, "SeaLevelStyle" -> Automatic]](https://www.wolframcloud.com/obj/resourcesystem/images/485/485db033-40d9-4b4c-8b1d-c71adf2cbdd9/0c70d594249ec45f.png)
|
| Out[12]= |
|
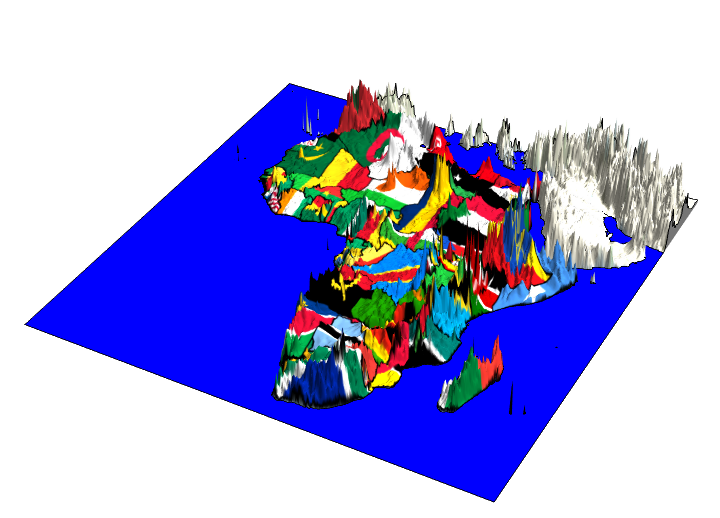
Drape the African nations in their national flags:
| In[13]:= |
|
Place flag images on countries:
| In[14]:= |
![ResourceFunction[
"GeoElevationGraphics3D"][{EdgeForm[
Black], {GeoStyling[{"Image", #2}], Polygon[#1]} & @@@ flags}, GeoBackground -> "StreetMapNoLabels", PlotRange -> {0, All}, ClippingStyle -> Blue, BoxRatios -> {1, 1, 0.2}, Boxed -> False]](https://www.wolframcloud.com/obj/resourcesystem/images/485/485db033-40d9-4b4c-8b1d-c71adf2cbdd9/034a0fde3dd89c5c.png)
|
| Out[14]= |
|
This work is licensed under a Creative Commons Attribution 4.0 International License
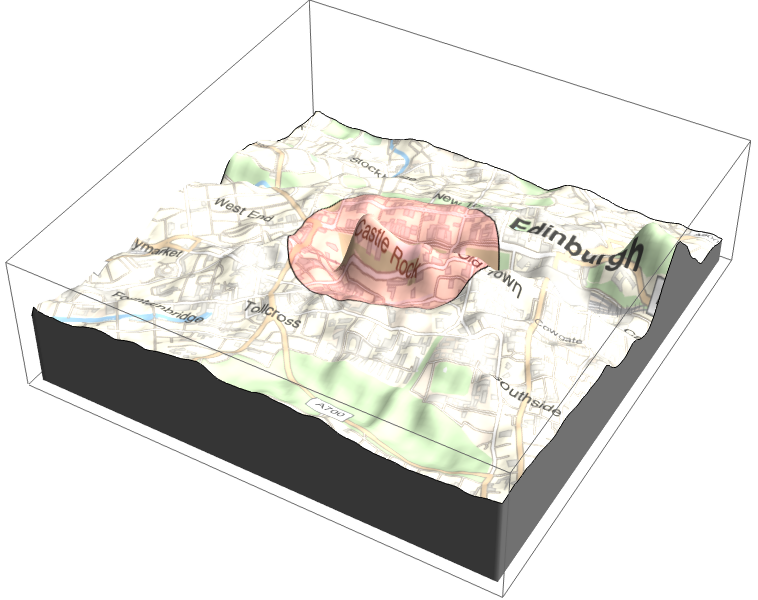
![ResourceFunction[
"GeoElevationGraphics3D"][{EdgeForm[Black], Red, GeoDisk[Entity["City", {"Edinburgh", "Edinburgh", "UnitedKingdom"}],
Quantity[500, "Meters"]]}, GeoBackground -> "VectorClassic", GeoRange -> Quantity[0.75, "Miles"]]](https://www.wolframcloud.com/obj/resourcesystem/images/485/485db033-40d9-4b4c-8b1d-c71adf2cbdd9/239cdb6726d4e3cd.png)