Basic Examples (5)
Show a globe centered on your current location:
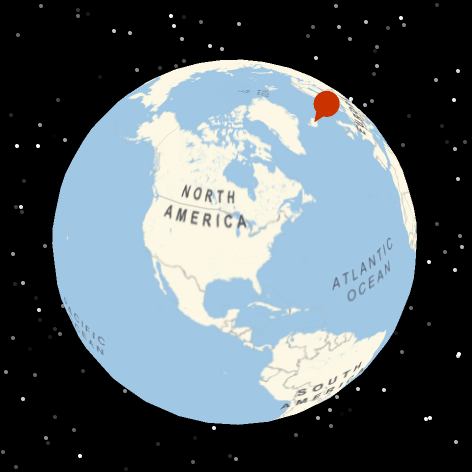
Show a globe with a GeoMarker indicating Iceland:
Display a globe showing the illumination of Earth by the Sun right now:
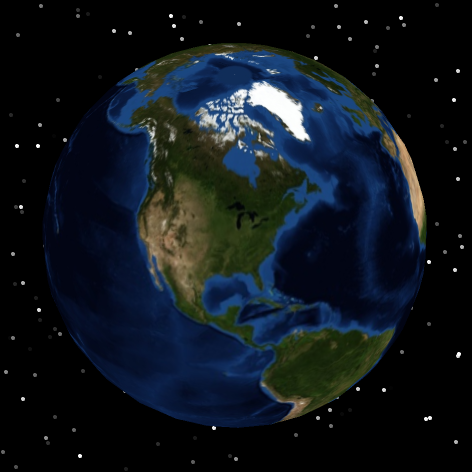
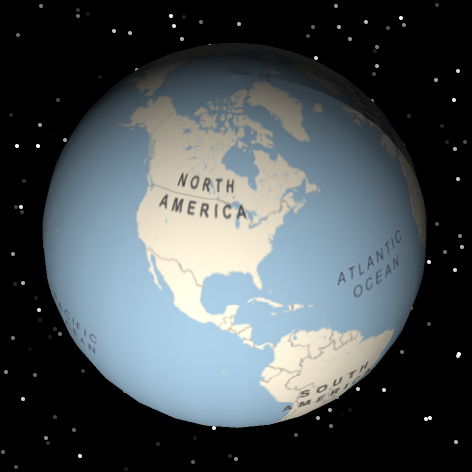
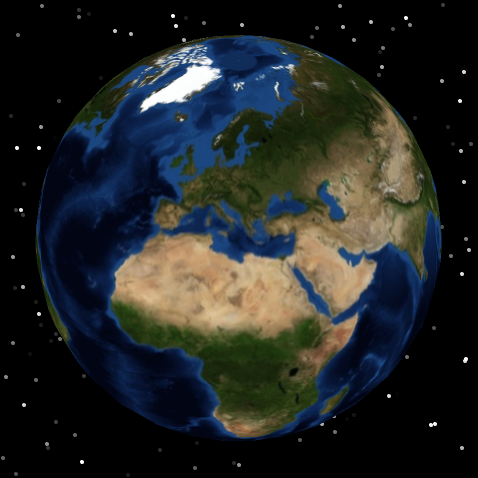
Show a globe using satellite imagery:
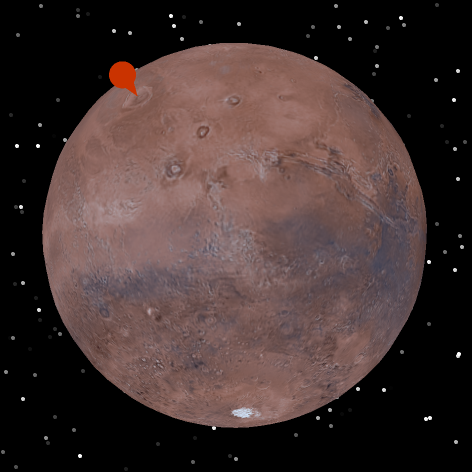
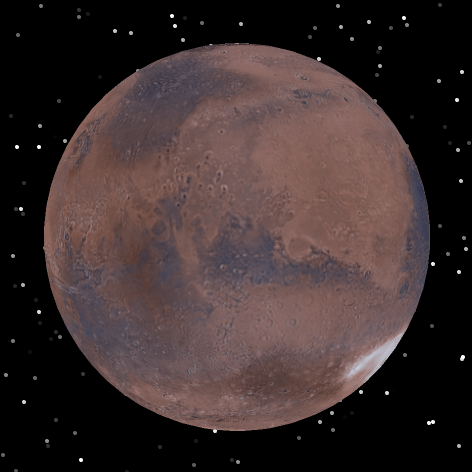
Display the planet Mars:
Scope (5)
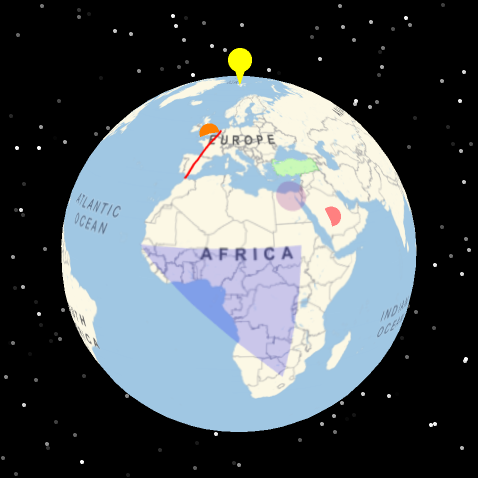
Show a globe using several types of primitives:
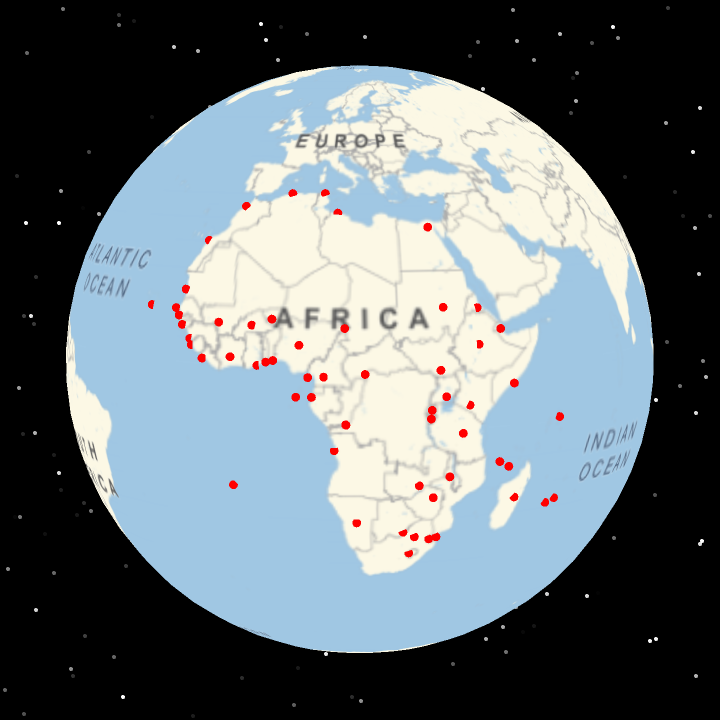
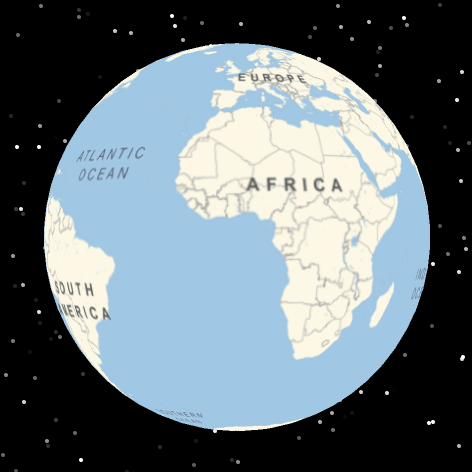
Show a point at the capital of each country in Africa:
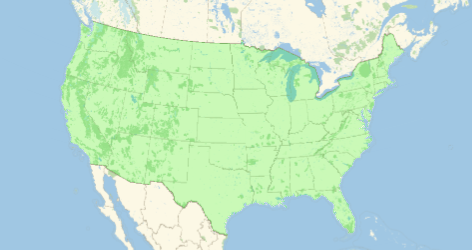
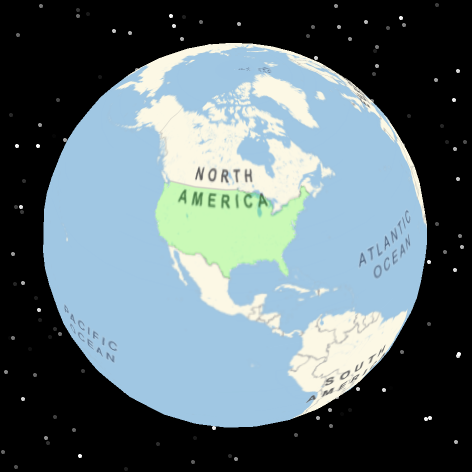
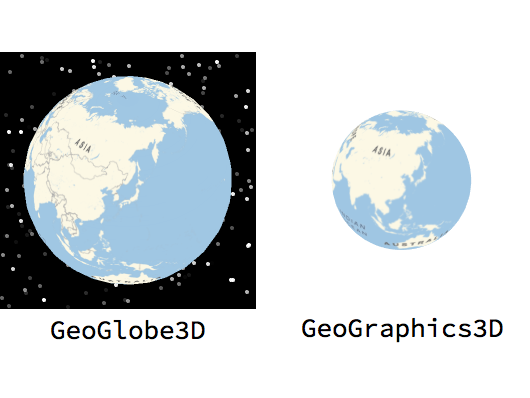
Convert a GeoGraphics object to GeoGlobe3D:
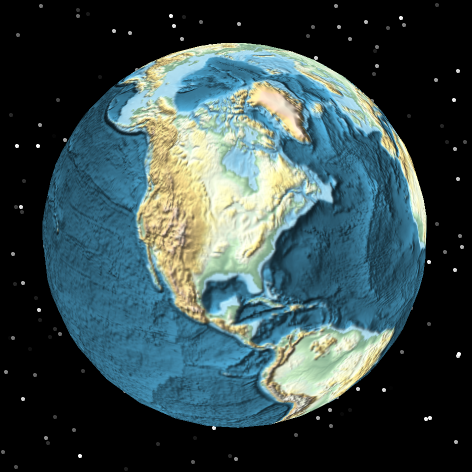
Show a 3D relief map of Earth:
Use a custom tile server:
Options (9)
3DPrimitives (3)
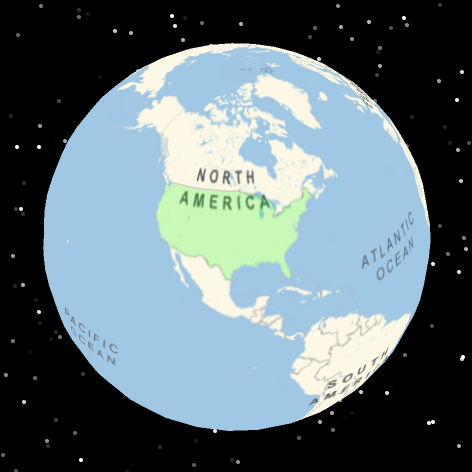
By default, GeoMarker and Point primitives are handled specially, rendering as 3D objects instead of as part of the 2D texture mapped onto the sphere:
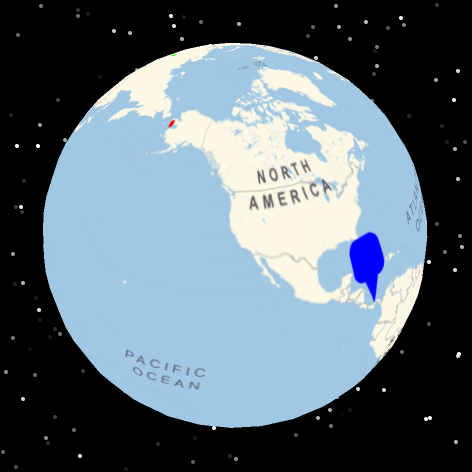
Force all primitives to render as part of the texture:
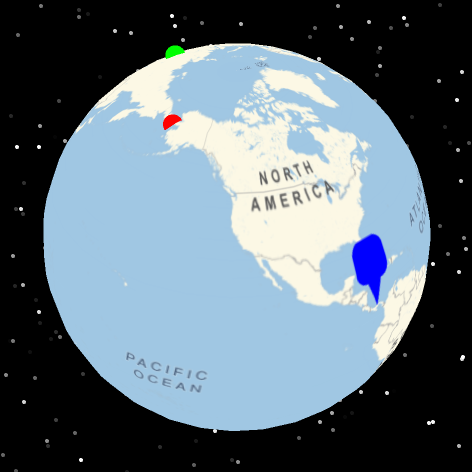
Force only some primitives to render as part of the texture:
GeoCenter (1)
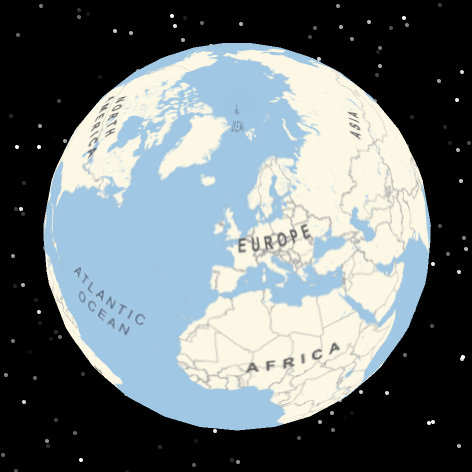
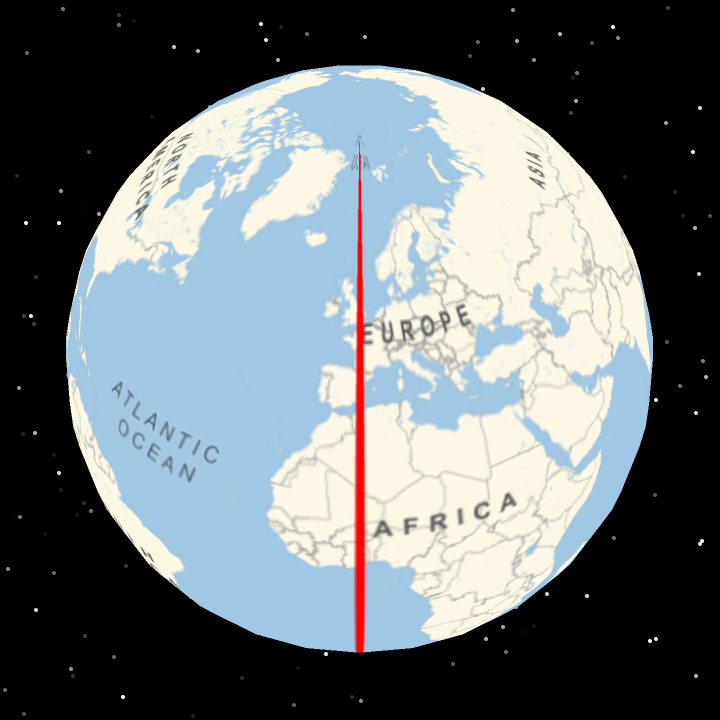
Center the globe on the Royal Observatory in England:
Starfield (2)
By default, a starfield is rendered behind the globe:
Disable the starfield:
SimulatedSun (3)
Show the illumination of Earth by the Sun right now:
Show the illumination of Earth by the Sun at a certain point in time:
With "SimulatedSun" → Automatic, the date of the first DayHemisphere, NightHemisphere, or DayNightTerminator primitive in the graphic is used, if one is present:
Properties and Relations (3)
The resource function GeoGraphics3D provides similar functionality to GeoGlobe3D:
Geographic positions with nonzero elevation are displayed in the appropriate position relative to Earth’s surface:
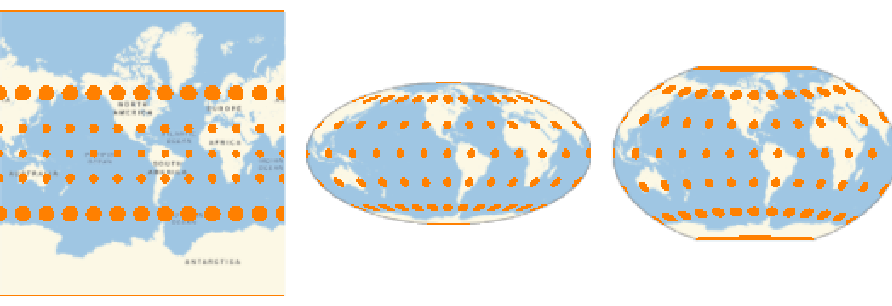
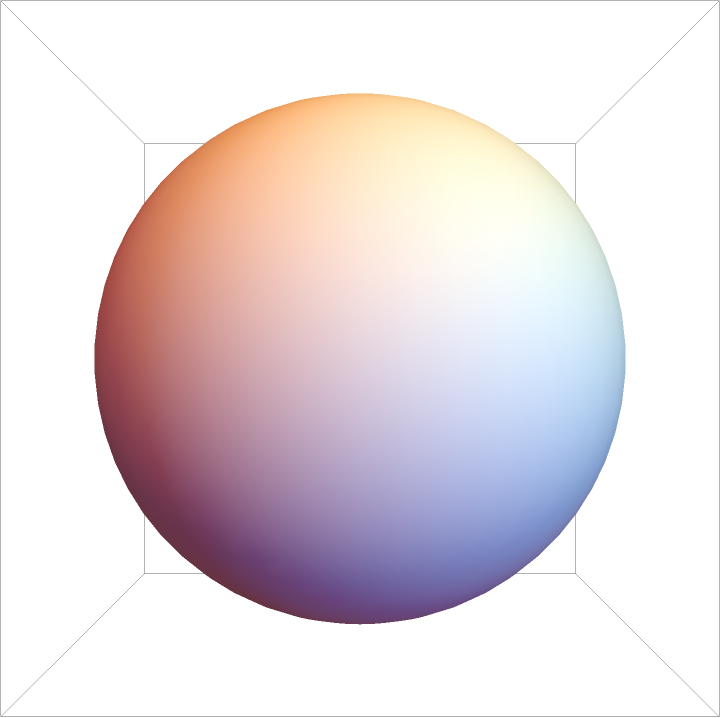
In 2D map projections, Tissot's indicatricies vary in area, shape, or both:
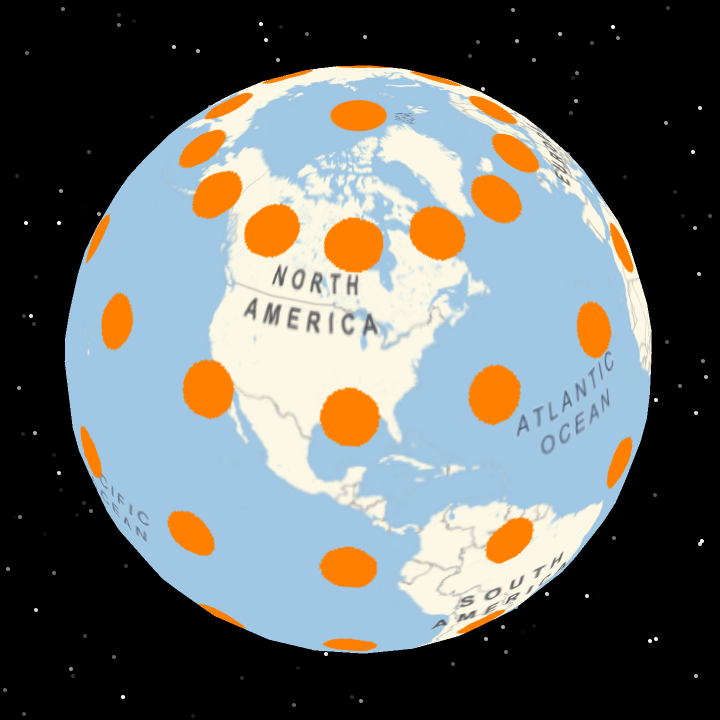
On a sphere, all of the indicatrices are identical:
Possible Issues (6)
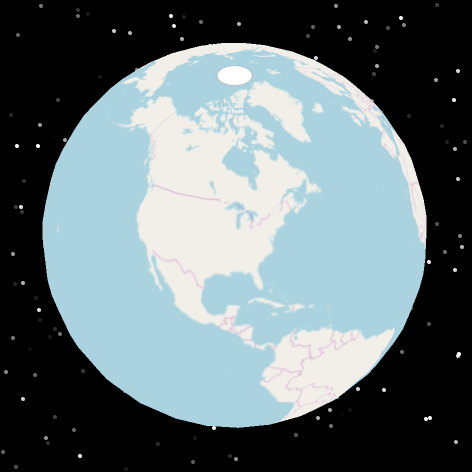
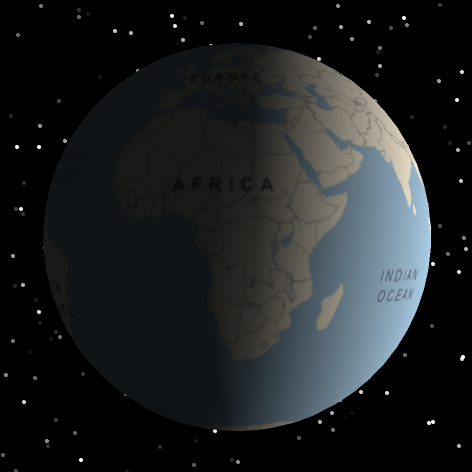
Labels that are part of the map style may become unreadable near the poles, as they are distorted when the texture is mapped onto the sphere:
Use GeoBackground→GeoStyling["StreetMapNoLabels"] to disable the labels on the default map style:
Some geographical primitives vary in thickness with latitude, as they are distorted when the texture is mapped onto the sphere:
As most primitives are rendered to an image which is mapped onto the globe, certain interactive functionality will not work:
The "SimulatedSun" option does not support astronomical bodies other than Earth:
GeoGlobe3D produces a sphere, which does not reflect the eccentricity of the Earth ellipsoid:
This eccentricity is essentially invisible at planet-scale:
The "SimulatedSun" option does not take into account the shadow of Earth’s moon during a solar eclipse:
The total and partial phases of an eclipse can be plotted directly onto the globe using the "GraphicsData" property of SolarEclipse:
Interactive Examples (2)
Make a spinning Earth animation using the resource function SpinShow:
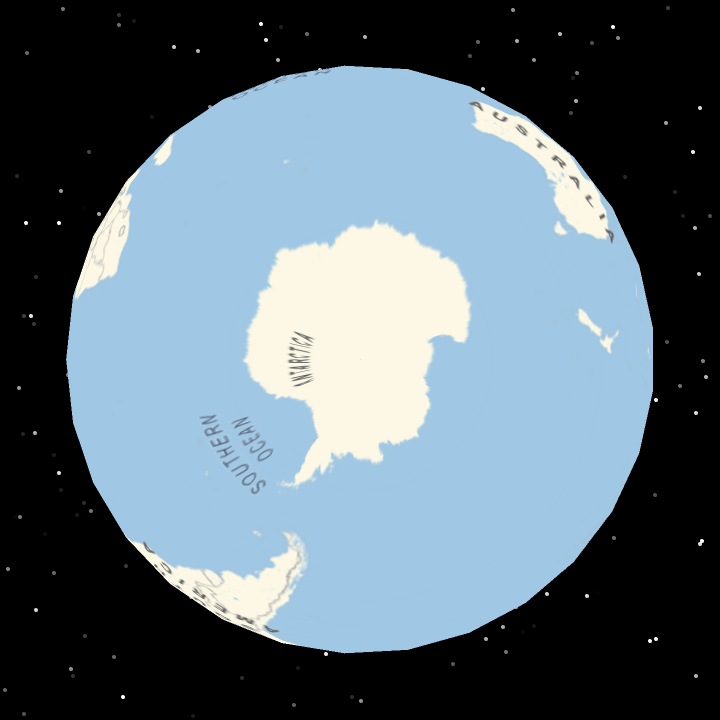
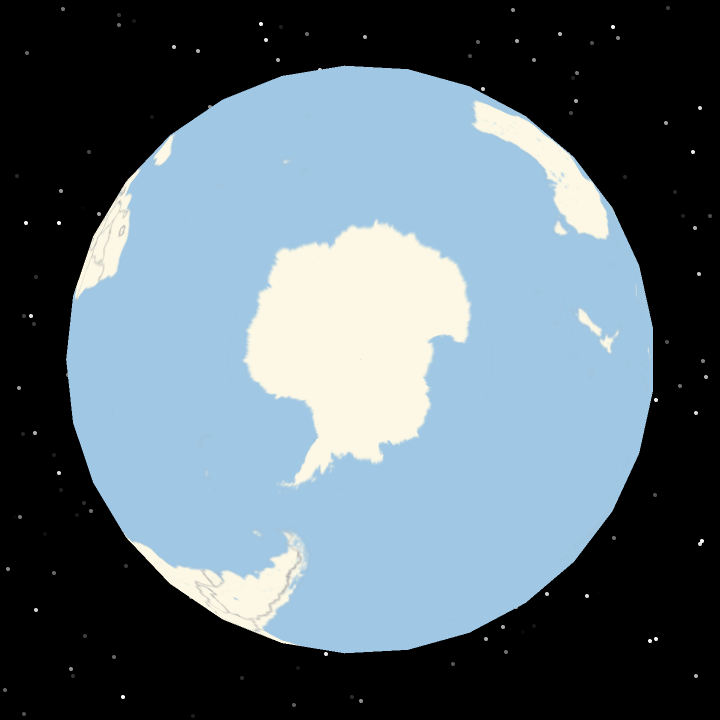
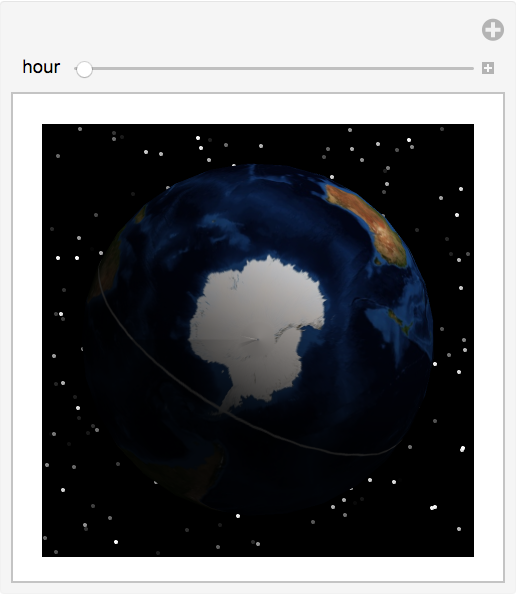
Show how the Antarctic is in day-long sunlight during the summer:
Neat Examples (4)
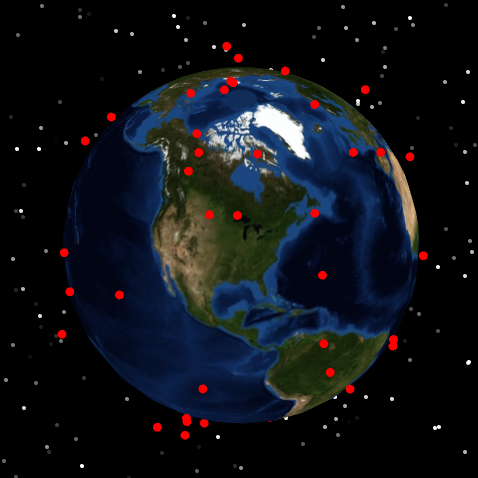
Display the current positions of the members of the Iridium satellite constellation:
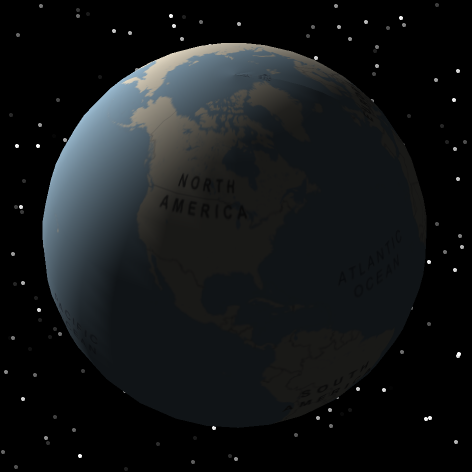
Show where sunrise is happening right now:
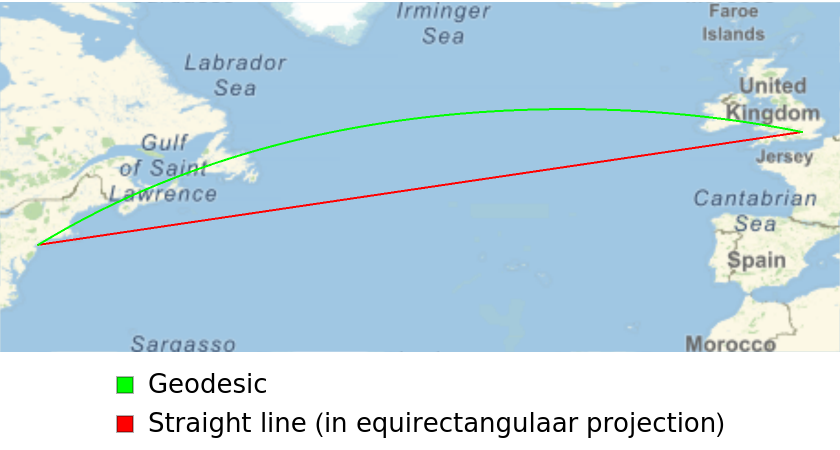
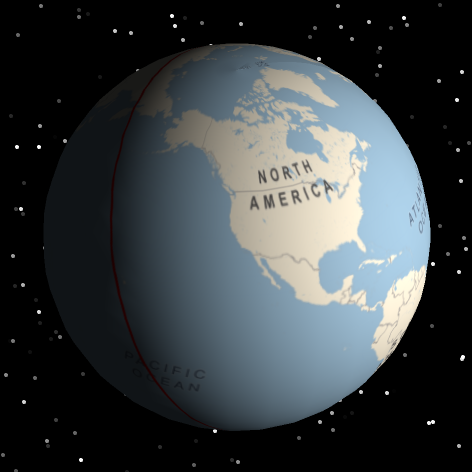
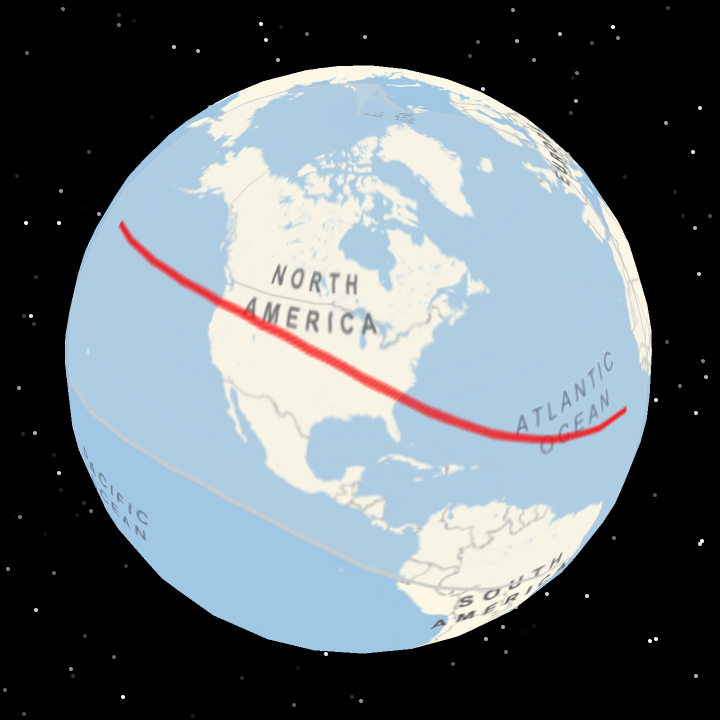
On a 2D map, a geodesic may not appear to be the shortest flight path between two locations:
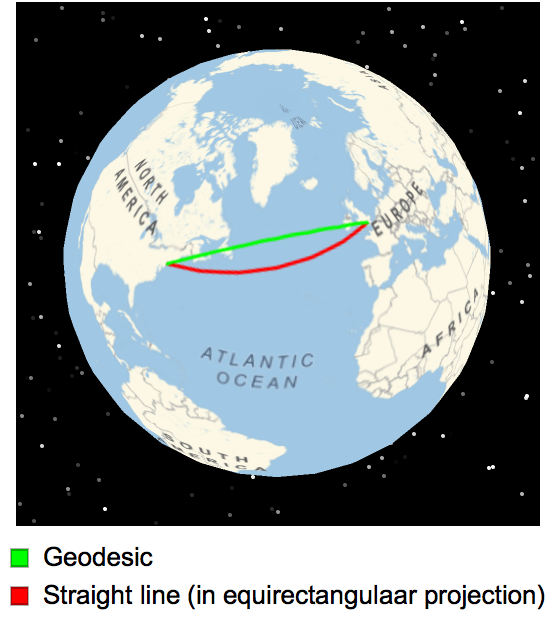
Plotting the paths on a globe makes clear that the geodesic is shorter:
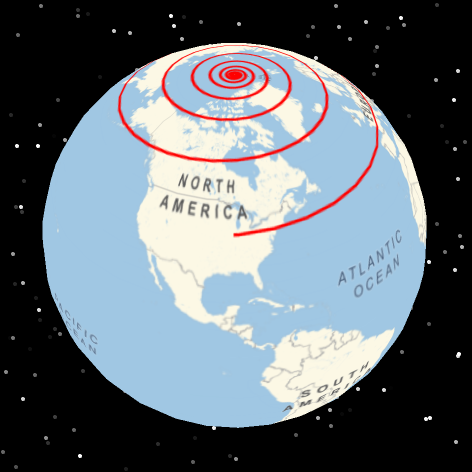
Show a rhumb line (loxodrome) spiraling towards the North Pole:
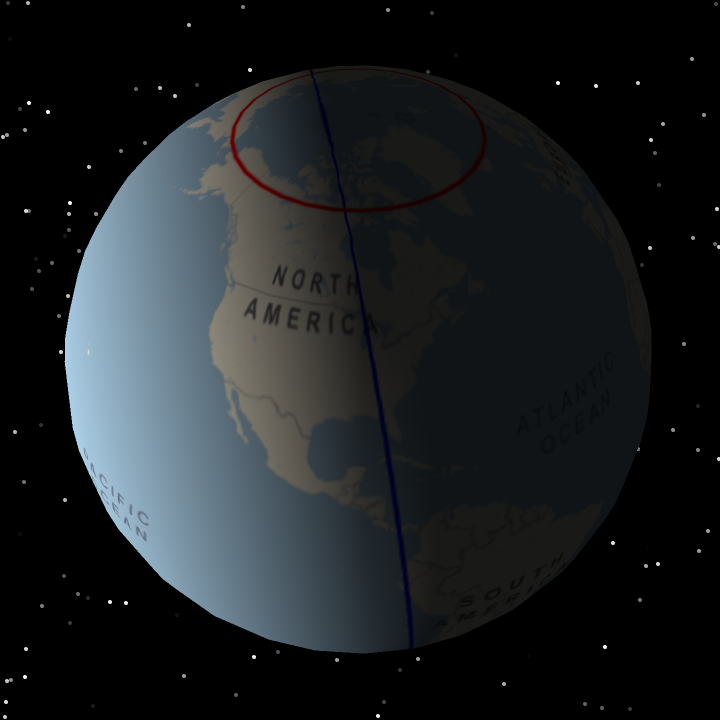
![ResourceFunction["GeoGlobe3D"][{
Blue, DayNightTerminator[],
Red, GeoPath["ArcticCircle"], GeoPath["AntarcticCircle"]
}, GeoCenter -> Here, "SimulatedSun" -> True]](https://www.wolframcloud.com/obj/resourcesystem/images/5f1/5f1766ed-a47a-4bc8-b915-e25a7d47b311/072448b445e5e42a.png)
![ResourceFunction["GeoGlobe3D"][
GeoMarker[Entity["SolarSystemFeature", "OlympusMonsMars"]],
GeoModel -> Entity["Planet", "Mars"],
GeoCenter -> Entity["SolarSystemFeature", "ClaritasFossaeMars"]
]](https://www.wolframcloud.com/obj/resourcesystem/images/5f1/5f1766ed-a47a-4bc8-b915-e25a7d47b311/4557afe37569c006.png)
![ResourceFunction["GeoGlobe3D"][{
Orange, Point[Entity[
"City", {"London", "GreaterLondon", "UnitedKingdom"}]],
Pink, Point[GeoPosition[{23, 44}]],
Red, GeoPath[{Entity[
"City", {"Tangier", "TangierTetouan", "Morocco"}], Entity["City", {"Amsterdam", "NoordHolland", "Netherlands"}]}],
Purple, GeoDisk[Entity["City", {"Cairo", "Cairo", "Egypt"}], Quantity[500, "Kilometers"]],
Green, Polygon@Entity["Country", "Turkey"],
Blue, Polygon[
GeoPosition@{Entity["City", {"Dakar", "Dakar", "Senegal"}], Entity["City", {"Khartoum", "Khartoum", "Sudan"}], Entity["City", {"Pretoria", "Gauteng", "SouthAfrica"}]}],
GeoMarker[Entity["City", {"Longyearbyen", "Svalbard", "Svalbard"}], "Color" -> Yellow]
}]](https://www.wolframcloud.com/obj/resourcesystem/images/5f1/5f1766ed-a47a-4bc8-b915-e25a7d47b311/6034049655c3b76e.png)
![ResourceFunction["GeoGlobe3D"][{
Red,
PointSize[Medium],
Point[EntityClass["Country", "Africa"][
EntityProperty["Country", "CapitalCity"]]]
}, GeoCenter -> Entity["GeographicRegion", "Africa"]]](https://www.wolframcloud.com/obj/resourcesystem/images/5f1/5f1766ed-a47a-4bc8-b915-e25a7d47b311/0d9a5f4cd2c84710.png)
![ResourceFunction["GeoGlobe3D"][{
GeoMarker[Entity["Country", "Panama"], "Color" -> Blue],
Red, Point[Entity["City", {"Nome", "Alaska", "UnitedStates"}]],
Green, Point[GeoPosition[{63, 100}]]
},
GeoCenter -> Entity["City", {"SanFrancisco", "California", "UnitedStates"}]]](https://www.wolframcloud.com/obj/resourcesystem/images/5f1/5f1766ed-a47a-4bc8-b915-e25a7d47b311/43ea52b69825d0ab.png)

![ResourceFunction["GeoGlobe3D"][{
GeoMarker[Entity["Country", "Panama"], "Color" -> Blue],
Red, Point[Entity["City", {"Nome", "Alaska", "UnitedStates"}]],
Green, Point[GeoPosition[{63, 100}]]
},
GeoCenter -> Entity["City", {"SanFrancisco", "California", "UnitedStates"}],
"3DPrimitives" -> None]](https://www.wolframcloud.com/obj/resourcesystem/images/5f1/5f1766ed-a47a-4bc8-b915-e25a7d47b311/49d817736314774d.png)
![ResourceFunction["GeoGlobe3D"][{
GeoMarker[Entity["Country", "Panama"], "Color" -> Blue],
Red, Point[Entity["City", {"Nome", "Alaska", "UnitedStates"}]],
Green, Point[GeoPosition[{63, 100}]]
},
GeoCenter -> Entity["City", {"SanFrancisco", "California", "UnitedStates"}],
"3DPrimitives" -> {Point}]](https://www.wolframcloud.com/obj/resourcesystem/images/5f1/5f1766ed-a47a-4bc8-b915-e25a7d47b311/162ecac30cef3dd9.png)
![ResourceFunction["GeoGlobe3D"][
GeoCenter -> Entity["AstronomicalObservatory", "Greenwich"]]](https://www.wolframcloud.com/obj/resourcesystem/images/5f1/5f1766ed-a47a-4bc8-b915-e25a7d47b311/51fa3beefd7839d5.png)


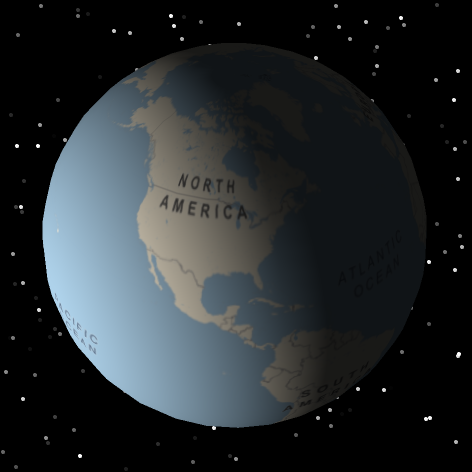
![ResourceFunction[
"GeoGlobe3D"][{Red, DayNightTerminator[
DateObject[{1988, 6, 23, 12, 0, 0}, "Instant", "Gregorian", -4.`]]}, GeoCenter -> Entity["City", {"SantaClara", "California", "UnitedStates"}], "SimulatedSun" -> Automatic]](https://www.wolframcloud.com/obj/resourcesystem/images/5f1/5f1766ed-a47a-4bc8-b915-e25a7d47b311/7c85aa1412692e08.png)
![Grid[{{Labeled[
ResourceFunction["GeoGlobe3D"][
GeoCenter -> GeoPosition[{45, 135}]], "GeoGlobe3D"], Labeled[ResourceFunction["GeoGraphics3D"][{}, SphericalRegion -> True], "GeoGraphics3D"]}}]](https://www.wolframcloud.com/obj/resourcesystem/images/5f1/5f1766ed-a47a-4bc8-b915-e25a7d47b311/3fbeca327fcf6eee.png)
![ResourceFunction[
"GeoGlobe3D"][{Red, Point[Table[
GeoPosition[{lat, 90, Quantity[lat*5, "Miles"]}], {lat, -90, 90, 10}]]}, GeoCenter -> GeoPosition[{0, 0}]]](https://www.wolframcloud.com/obj/resourcesystem/images/5f1/5f1766ed-a47a-4bc8-b915-e25a7d47b311/1fe4693599f45bdc.png)

![indicatrixMap = GeoGraphics[{
Orange,
GeoStyling[Opacity[1]],
Table[
GeoDisk[GeoPosition@{lat, lon}, Quantity[350, "Miles"]], {lat, -90, 90, 30}, {lon, -180, 179, 30}]
}, GeoCenter -> Here];
GraphicsRow[
Show[indicatrixMap, GeoProjection -> #] & /@ {"Mercator", "Mollweide", "WinkelTripel"}, ImageSize -> Full]](https://www.wolframcloud.com/obj/resourcesystem/images/5f1/5f1766ed-a47a-4bc8-b915-e25a7d47b311/7fc08b4495304800.png)
![ResourceFunction[
"GeoGlobe3D"][{Green, Tooltip[Polygon[Entity["Country", "UnitedStates"]], "This tooltip doesn't work"]}]](https://www.wolframcloud.com/obj/resourcesystem/images/5f1/5f1766ed-a47a-4bc8-b915-e25a7d47b311/5b074c18ab6b80cf.png)
![Graphics3D[
Ellipsoid[{0, 0, 0}, QuantityMagnitude[
GeodesyData["ITRF00", #] & /@ {"SemimajorAxis", "SemiminorAxis"}][[{1, 1, 2}]]], ViewPoint -> Front]](https://www.wolframcloud.com/obj/resourcesystem/images/5f1/5f1766ed-a47a-4bc8-b915-e25a7d47b311/1ef6cb294e201e71.png)
![eclipseDate = DateObject[{2017, 8, 21}];
ResourceFunction["GeoGlobe3D"][GeoCenter -> GeoPosition[{40, -88}], "SimulatedSun" -> SolarEclipse[eclipseDate]]](https://www.wolframcloud.com/obj/resourcesystem/images/5f1/5f1766ed-a47a-4bc8-b915-e25a7d47b311/72c206041a43b5f9.png)
![Manipulate[
With[
{date = DatePlus[DateObject[{2019}, "Hour"], {hour, "Hours"}]},
ResourceFunction["GeoGlobe3D"][
{White, DayNightTerminator[date]},
GeoCenter -> GeoPosition["SouthPole"],
GeoBackground -> "Satellite",
"SimulatedSun" -> date
]
], {hour, 0, 24}]](https://www.wolframcloud.com/obj/resourcesystem/images/5f1/5f1766ed-a47a-4bc8-b915-e25a7d47b311/7084e15599779ccd.png)
![ResourceFunction[
"GeoGlobe3D"][{Red, PointSize[Medium], Point@EntityClass["Satellite", "IridiumSatellites"]}, GeoBackground -> "Satellite"]](https://www.wolframcloud.com/obj/resourcesystem/images/5f1/5f1766ed-a47a-4bc8-b915-e25a7d47b311/03c44680772af03a.png)
![ResourceFunction["GeoGlobe3D"][
GeoCenter -> GeoPosition[{0, 1/Quantity[24, "Hours"] DateDifference[Now, Sunrise[GeoPosition[{0, 0}]], "Hours"]*
Quantity[360, "AngularDegrees"]}],
"SimulatedSun" -> Now
]](https://www.wolframcloud.com/obj/resourcesystem/images/5f1/5f1766ed-a47a-4bc8-b915-e25a7d47b311/48b3cc7baaeb8321.png)
![airports = {Entity["Airport", "KJFK"], Entity["Airport", "EGLL"]};
Labeled[GeoGraphics[{
Red, Line[airports],
Green, GeoPath[airports, "Geodesic"]
}, GeoProjection -> "Equirectangular"], SwatchLegend[{Green, Red}, {"Geodesic", "Straight line (in equirectangulaar projection)"}]]](https://www.wolframcloud.com/obj/resourcesystem/images/5f1/5f1766ed-a47a-4bc8-b915-e25a7d47b311/397fddaf56187b1f.png)