Wolfram Function Repository
Instant-use add-on functions for the Wolfram Language
Function Repository Resource:
Generate a ridge line map from elevation data
ResourceFunction["RidgeLineMap"][data] generates a ridge line map for the given data. |
| "Color" | Gray | set the ridge color |
| RasterSize | Automatic | set the absolute pixel size of the raster generated |
| "HeightMultiplier" | Automatic | emphasize altitudes in the map |
| "LineDensityMultiplier" | Automatic | increase the density of lines in the map |
| "LineThickness" | Automatic | set the thickness of lines in the map |
| "MinimumAltitude" | Quantity[0,"Meters"] | set the minimum altitude to draw lines for |
Generate a ridge line map for near Mumbai:
| In[1]:= | ![data = GeoElevationData[
Entity["City", {"Bombay", "Maharashtra", "India"}], GeoRange -> Quantity[50, "Kilometers"]];
ResourceFunction["RidgeLineMap"][data]](https://www.wolframcloud.com/obj/resourcesystem/images/312/31278c37-9f7a-4a1a-a353-623b45b148d4/6a25f758ae2098c2.png) |
| Out[1]= | 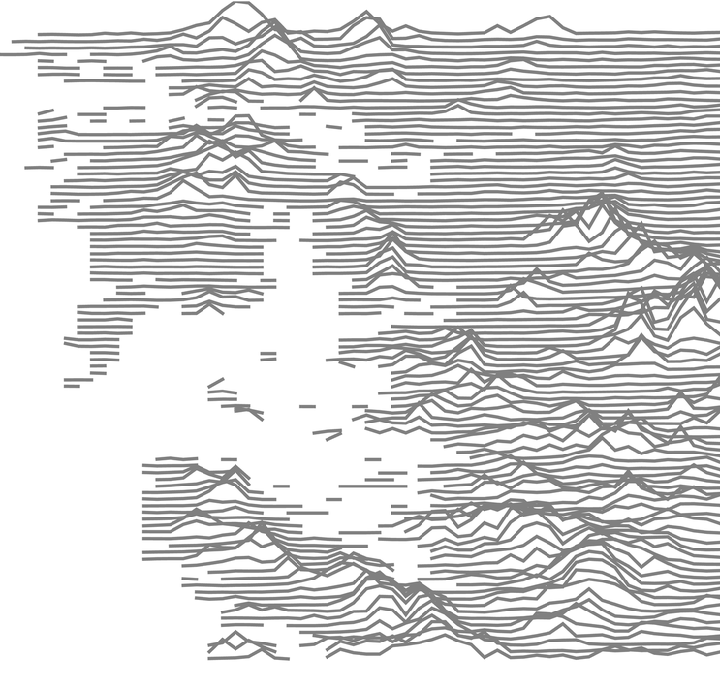 |
Generate a ridge line map for near Mount Everest:
| In[2]:= | ![data = GeoElevationData[Entity["Mountain", "MountEverest"], GeoRange -> Quantity[10, "Kilometers"]];
ResourceFunction["RidgeLineMap"][data, "HeightMultiplier" -> 0.5]](https://www.wolframcloud.com/obj/resourcesystem/images/312/31278c37-9f7a-4a1a-a353-623b45b148d4/15b6619a6b7dc1e2.png) |
| Out[2]= | 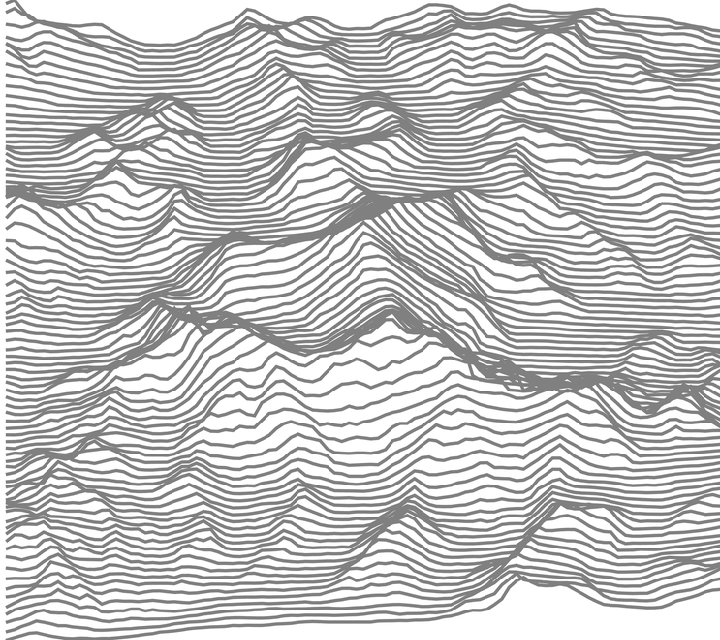 |
Near Mariana Trench:
| In[3]:= | ![data = GeoElevationData[\!\(\*
NamespaceBox["LinguisticAssistant",
DynamicModuleBox[{Typeset`query$$ = "Mariana trench", Typeset`boxes$$ = TemplateBox[{"\"Mariana Trench\"",
RowBox[{"Entity", "[",
RowBox[{"\"UnderseaFeature\"", ",", "\"MarianaTrench\""}], "]"}], "\"Entity[\\\"UnderseaFeature\\\", \\\"MarianaTrench\\\"]\"",
"\"undersea feature\""}, "Entity"], Typeset`allassumptions$$ = {}, Typeset`assumptions$$ = {}, Typeset`open$$ = {1, 2}, Typeset`querystate$$ = {"Online" -> True, "Allowed" -> True, "mparse.jsp" -> 1.190537, "Messages" -> {}}},
DynamicBox[ToBoxes[
AlphaIntegration`LinguisticAssistantBoxes["", 4, Automatic,
Dynamic[Typeset`query$$],
Dynamic[Typeset`boxes$$],
Dynamic[Typeset`allassumptions$$],
Dynamic[Typeset`assumptions$$],
Dynamic[Typeset`open$$],
Dynamic[Typeset`querystate$$]], StandardForm],
ImageSizeCache->{243.25, {8.125, 17.125}},
TrackedSymbols:>{Typeset`query$$, Typeset`boxes$$, Typeset`allassumptions$$, Typeset`assumptions$$, Typeset`open$$, Typeset`querystate$$}],
DynamicModuleValues:>{},
UndoTrackedVariables:>{Typeset`open$$}],
BaseStyle->{"Deploy"},
DeleteWithContents->True,
Editable->False,
SelectWithContents->True]\), GeoRange -> Quantity[10, "Kilometers"], GeoProjection -> Automatic, UnitSystem -> "Metric"];
ResourceFunction["RidgeLineMap"][data, "MinimumAltitude" -> Quantity[-Infinity, "Meters"]]](https://www.wolframcloud.com/obj/resourcesystem/images/312/31278c37-9f7a-4a1a-a353-623b45b148d4/7a3ff8a83d654ba8.png) |
| Out[3]= | 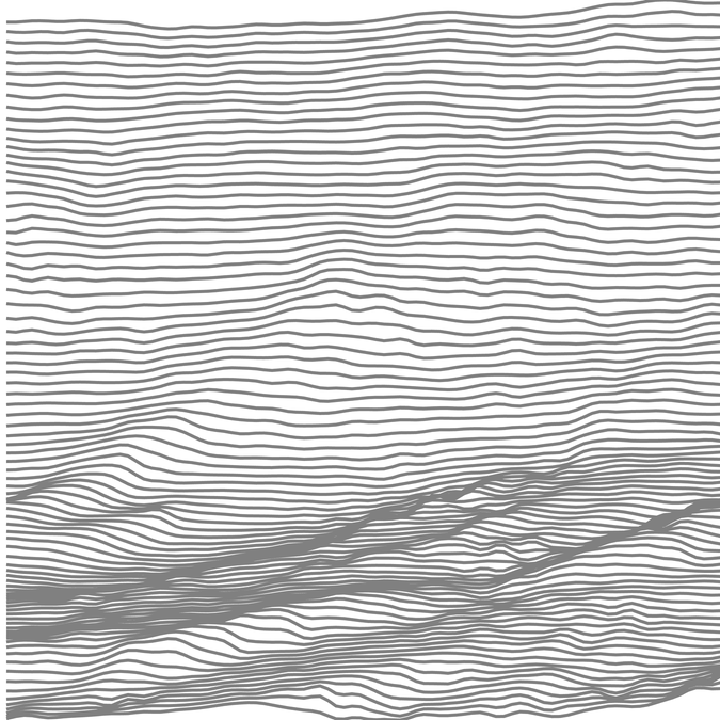 |
Change the color of lines using this option:
| In[4]:= | ![data = GeoElevationData[
Entity["City", {"Bombay", "Maharashtra", "India"}], GeoRange -> Quantity[50, "Kilometers"]];
ResourceFunction["RidgeLineMap"][data, "Color" -> Orange]](https://www.wolframcloud.com/obj/resourcesystem/images/312/31278c37-9f7a-4a1a-a353-623b45b148d4/36539f7627c2f5ce.png) |
| Out[4]= | 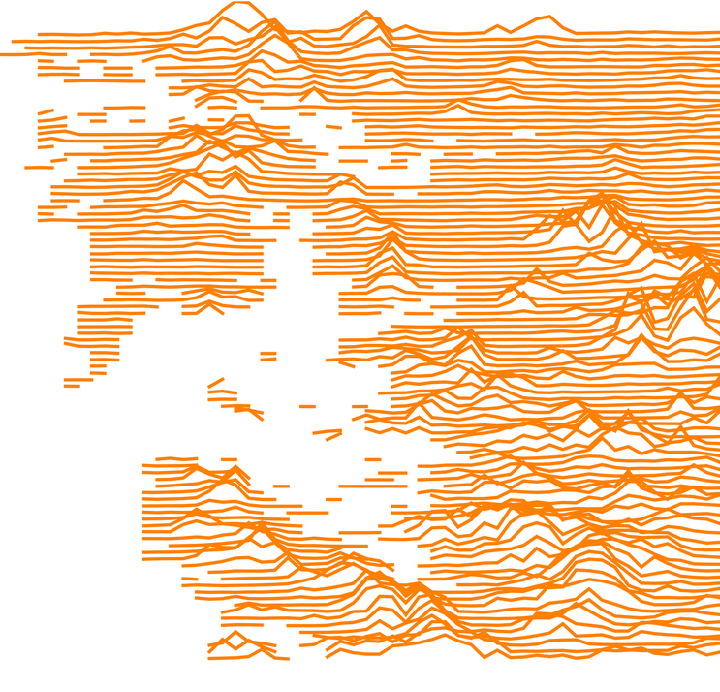 |
Change the absolute pixel size of the raster generated using this option:
| In[5]:= | ![data = GeoElevationData[
Entity["City", {"Bombay", "Maharashtra", "India"}], GeoRange -> Quantity[50, "Kilometers"]];
ResourceFunction["RidgeLineMap"][data, RasterSize -> 100]](https://www.wolframcloud.com/obj/resourcesystem/images/312/31278c37-9f7a-4a1a-a353-623b45b148d4/2b9e9cf4aa4667e1.png) |
| Out[5]= | 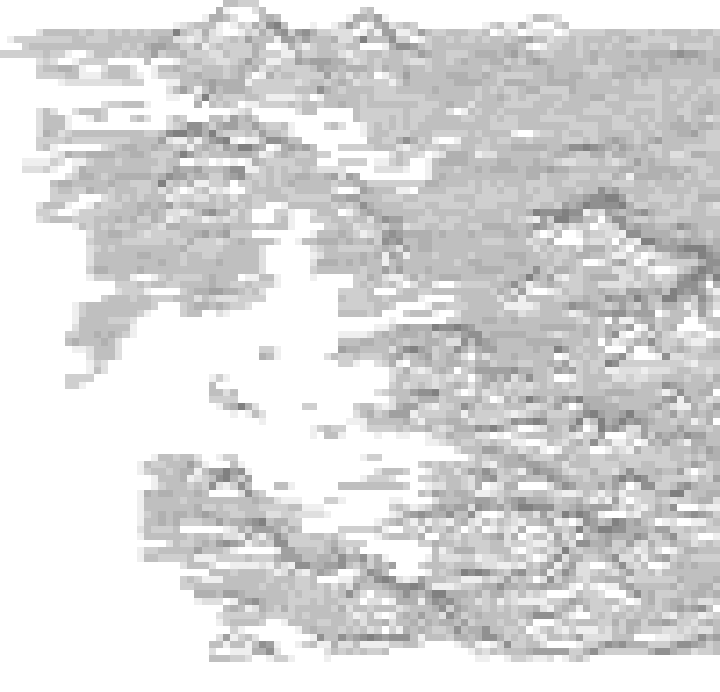 |
Emphasis on heights can be changed by using this option:
| In[6]:= | ![data = GeoElevationData[
Entity["City", {"Bombay", "Maharashtra", "India"}], GeoRange -> Quantity[50, "Kilometers"]];
ResourceFunction["RidgeLineMap"][data, "HeightMultiplier" -> 0.01]](https://www.wolframcloud.com/obj/resourcesystem/images/312/31278c37-9f7a-4a1a-a353-623b45b148d4/7997a5085af622e2.png) |
| Out[6]= | 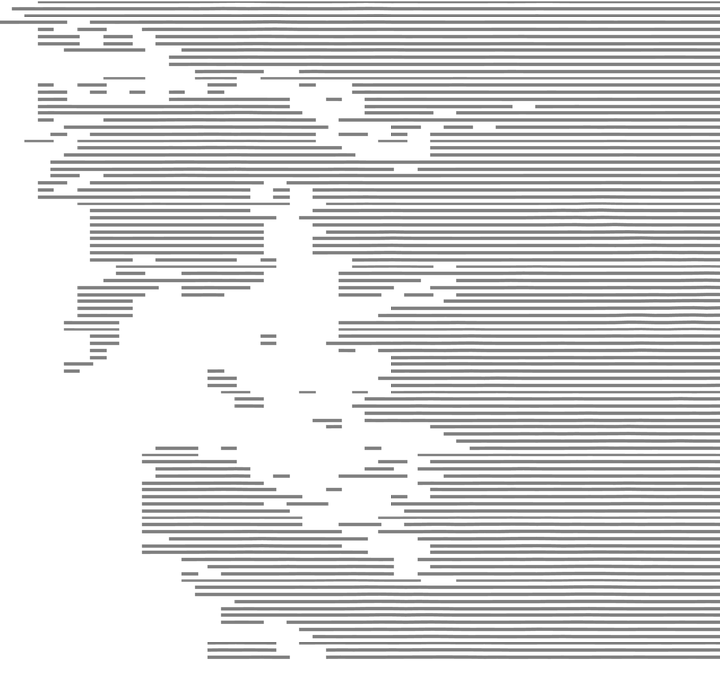 |
Set the minimum altitude below which no lines will be drawn using this option:
| In[7]:= | ![data = GeoElevationData[
Entity["City", {"Bombay", "Maharashtra", "India"}], GeoRange -> Quantity[50, "Kilometers"]];
ResourceFunction["RidgeLineMap"][data, "MinimumAltitude" -> Quantity[-Infinity, "Meters"]]](https://www.wolframcloud.com/obj/resourcesystem/images/312/31278c37-9f7a-4a1a-a353-623b45b148d4/6ae1f7de4e0723f0.png) |
| Out[7]= | 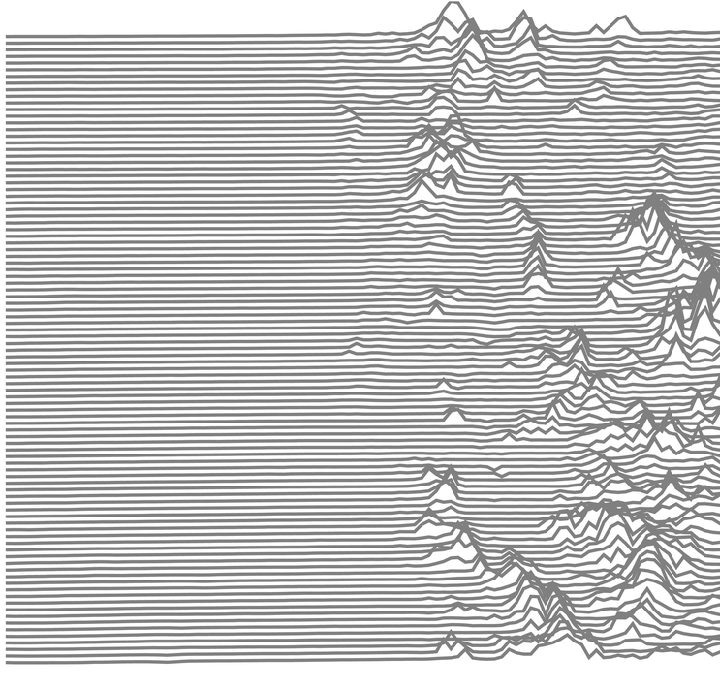 |
Change the number of lines on map using this option:
| In[8]:= | ![data = GeoElevationData[
Entity["City", {"Bombay", "Maharashtra", "India"}], GeoRange -> Quantity[50, "Kilometers"]];
ResourceFunction["RidgeLineMap"][data, "LineDensityMultiplier" -> 2]](https://www.wolframcloud.com/obj/resourcesystem/images/312/31278c37-9f7a-4a1a-a353-623b45b148d4/5bd9ee4c88ea5628.png) |
| Out[8]= | 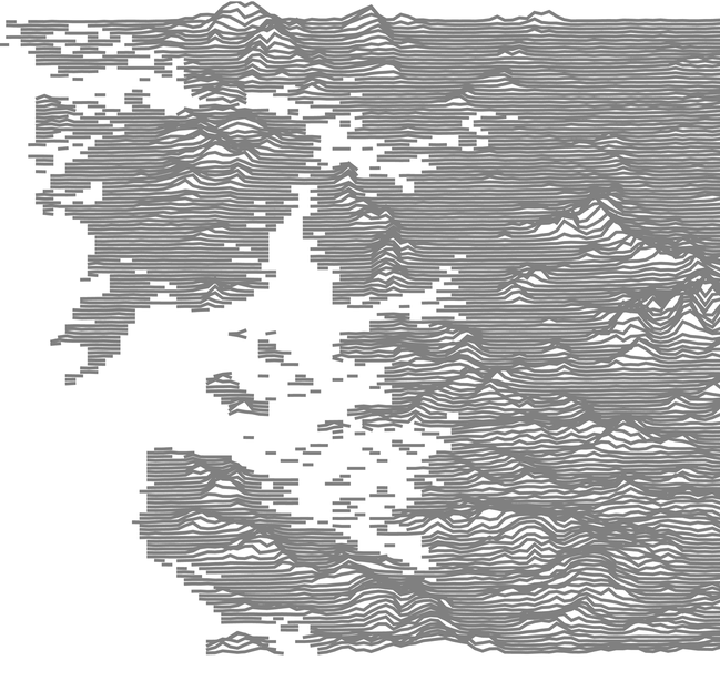 |
Change the thickness of lines on map using this option:
| In[9]:= | ![data = GeoElevationData[
Entity["City", {"Bombay", "Maharashtra", "India"}], GeoRange -> Quantity[50, "Kilometers"]];
ResourceFunction["RidgeLineMap"][data, "LineThickness" -> 0.001]](https://www.wolframcloud.com/obj/resourcesystem/images/312/31278c37-9f7a-4a1a-a353-623b45b148d4/687eb24531379806.png) |
| Out[9]= | 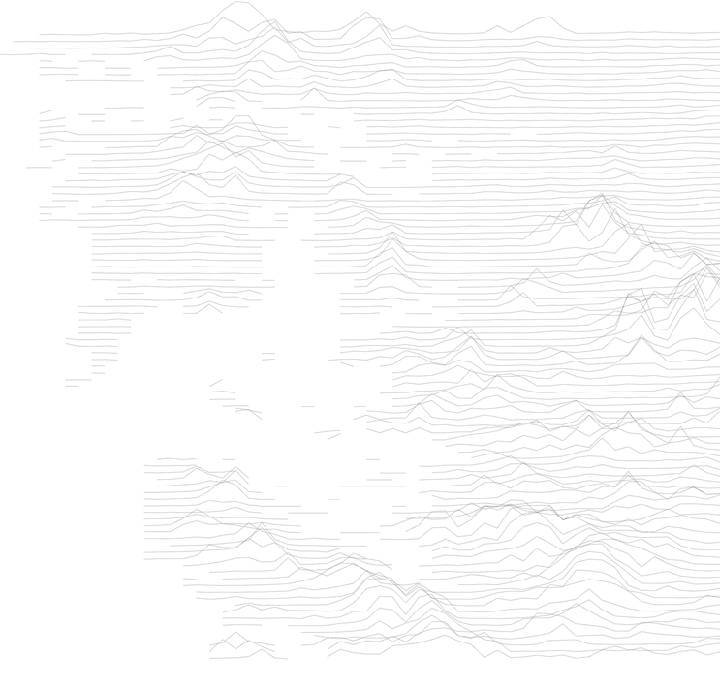 |
Ridge map of the US:
| In[10]:= | ![data = GeoElevationData[
Entity["City", {"NewYork", "NewYork", "UnitedStates"}], GeoRange -> "Country", GeoProjection -> Automatic, UnitSystem -> "Metric"];
ResourceFunction["RidgeLineMap"][data, "HeightMultiplier" -> 0.1, "LineThickness" -> 0.003]](https://www.wolframcloud.com/obj/resourcesystem/images/312/31278c37-9f7a-4a1a-a353-623b45b148d4/36aa88e7d3a8c211.png) |
| Out[10]= | 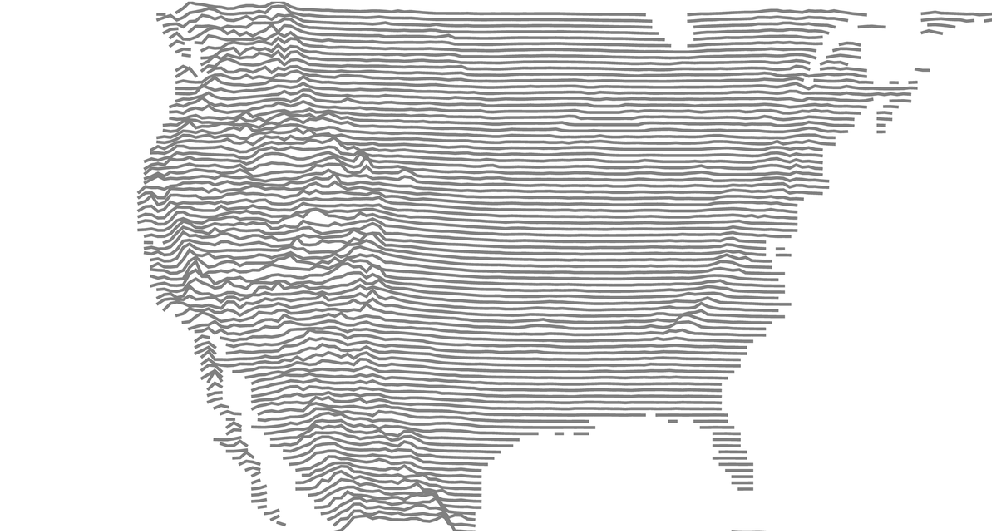 |
Of the world:
| In[11]:= | ![data = GeoElevationData[
Entity["City", {"Bombay", "Maharashtra", "India"}], GeoRange -> "World"];
ResourceFunction["RidgeLineMap"][data, "HeightMultiplier" -> 0.05, "LineThickness" -> 0.003]](https://www.wolframcloud.com/obj/resourcesystem/images/312/31278c37-9f7a-4a1a-a353-623b45b148d4/21ba7f91cf2dcdb9.png) |
| Out[11]= | 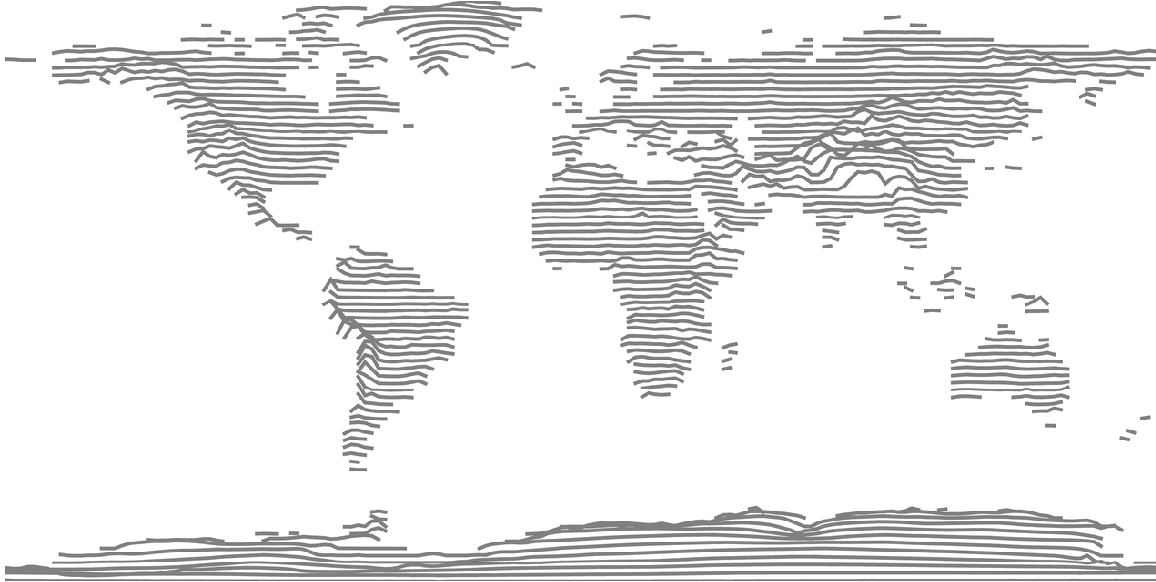 |
The Himalayas, being tall require use of "HeightMultiplier" whenever present in the view:
| In[12]:= | ![data = GeoElevationData[
Entity["City", {"Bombay", "Maharashtra", "India"}], GeoRange -> "Country"];
ResourceFunction["RidgeLineMap"][data, "HeightMultiplier" -> 0.05]](https://www.wolframcloud.com/obj/resourcesystem/images/312/31278c37-9f7a-4a1a-a353-623b45b148d4/0497c1059742d0a7.png) |
| Out[12]= | 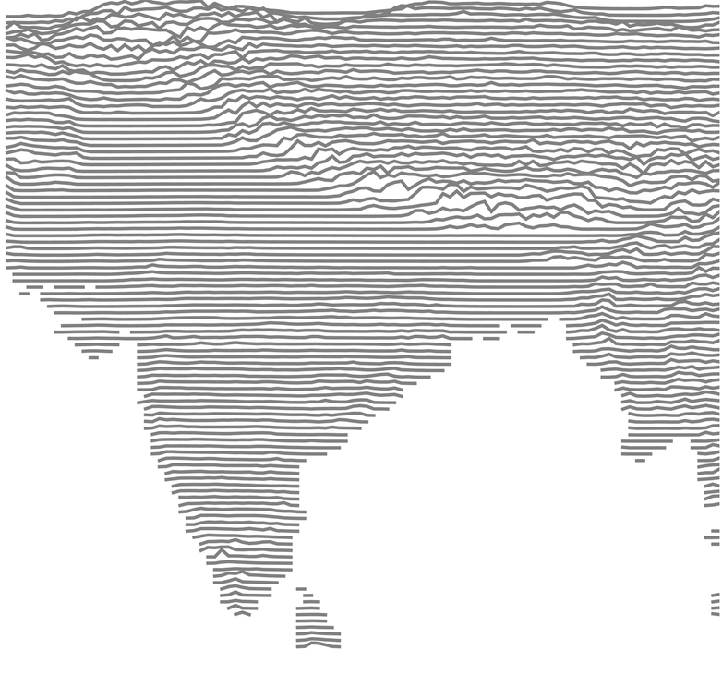 |
Mumbai, after a water level rise of 3m:
| In[13]:= | ![data = GeoElevationData[
Entity["City", {"Bombay", "Maharashtra", "India"}], GeoRange -> Quantity[20, "Kilometers"]];
ResourceFunction["RidgeLineMap"][data, "MinimumAltitude" -> Quantity[3, "Meters"]]](https://www.wolframcloud.com/obj/resourcesystem/images/312/31278c37-9f7a-4a1a-a353-623b45b148d4/2dad784f9d313b9c.png) |
| Out[13]= | 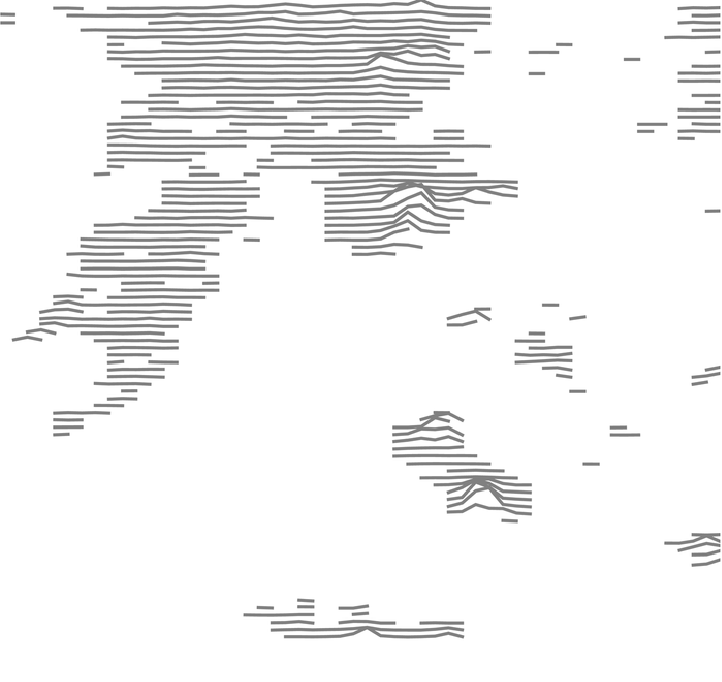 |
This work is licensed under a Creative Commons Attribution 4.0 International License