Basic Examples (6)
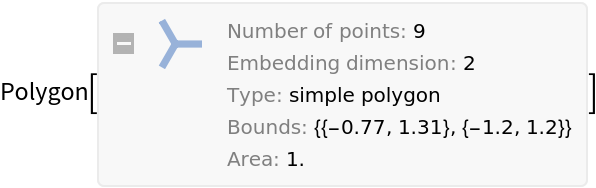
Create a unit area Polygon object of "TripleCross" type rotated counterclockwise by π/6:
The centroid of the polygon is placed at {0,0}:
Visualize the polygon and its centroid:
Create a displaced Graphics marker in one step:
This marker is set up to be suitable for PlotMarkers:
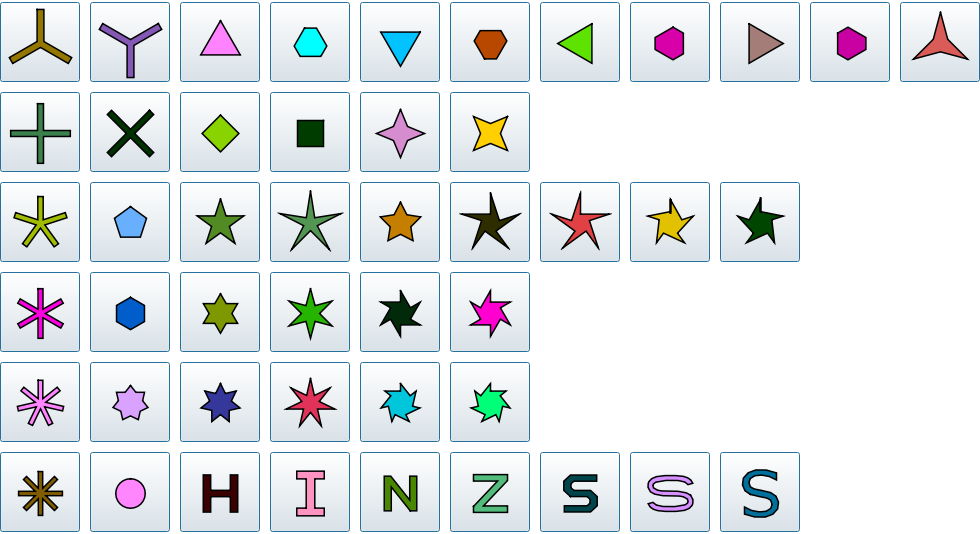
Get the complete list of built-in named shapes:
Make a Grid of buttons with the shapes for easy selection:
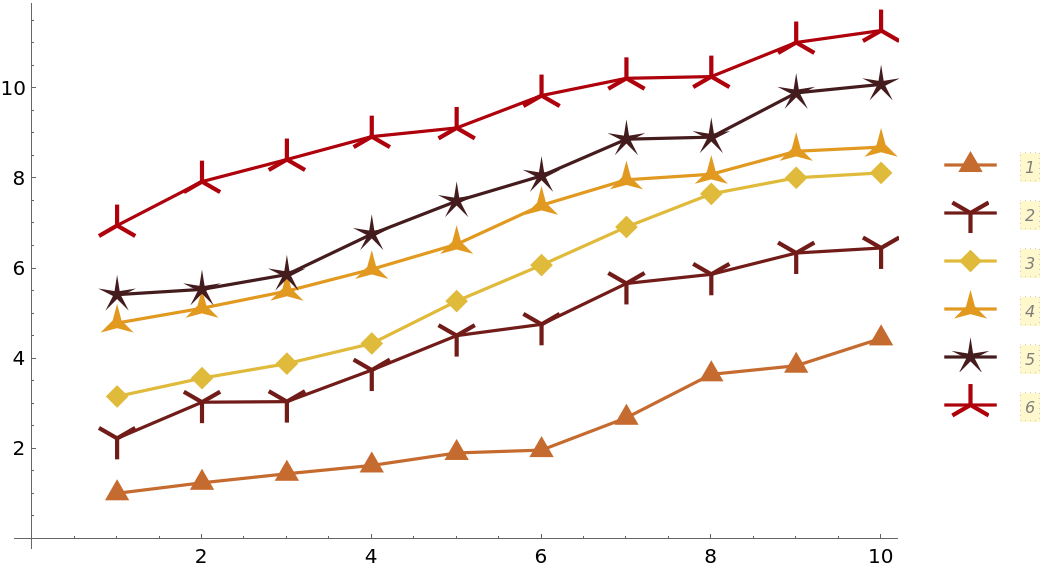
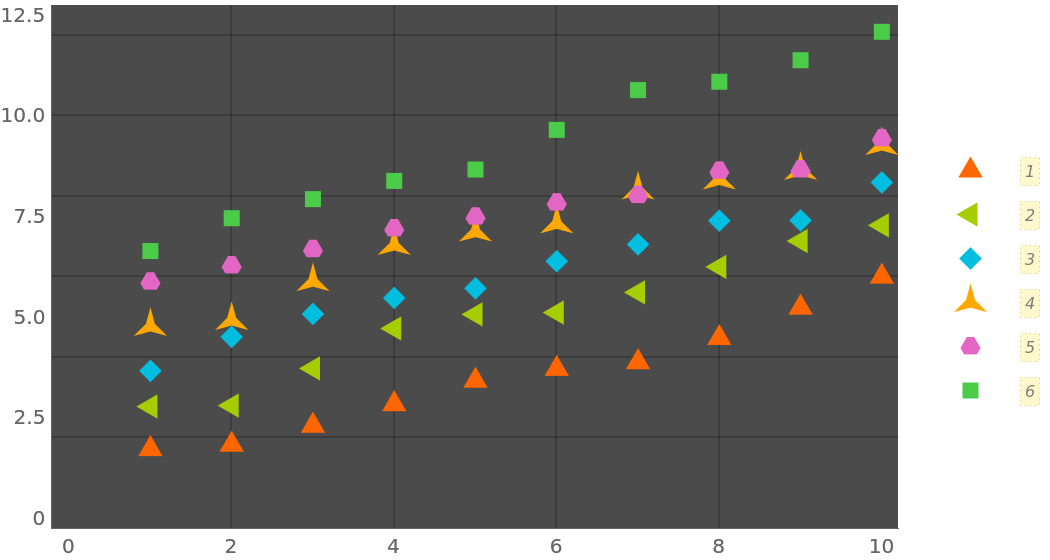
Filled markers that pick up PlotStyle and PlotTheme automatically:
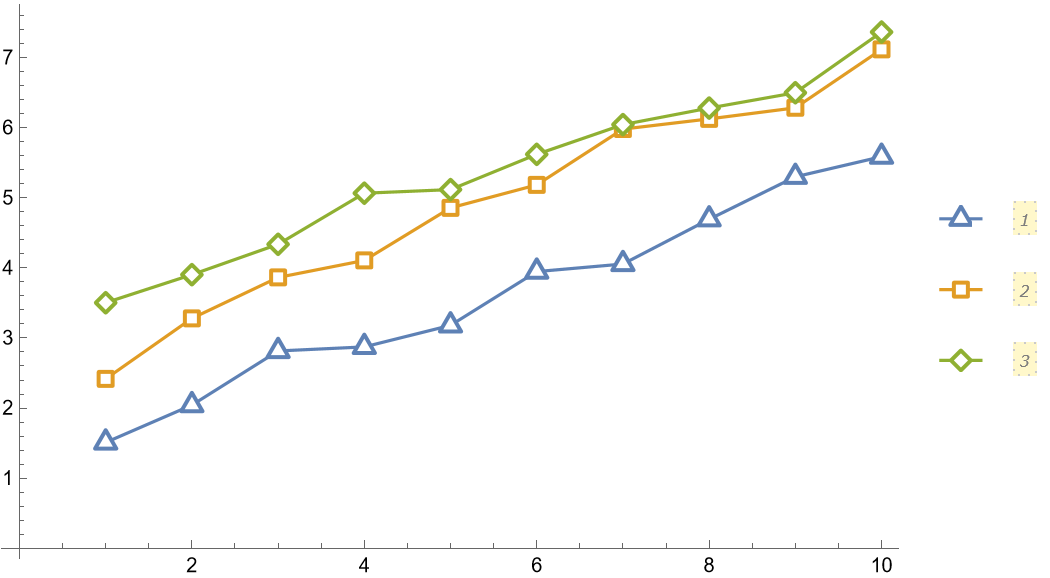
Empty markers that pick up PlotStyle and PlotTheme automatically:
Filled markers with lighter filling colors:
Scope (4)
Use the third argument of PolygonMarker to specify the coordinate(s) where the marker should be placed:
Construct a list plot directly from graphics primitives:
Construct a custom list plot where open plot markers have transparent faces for each other (but not for the plotted lines):
Construct a custom list plot where the plot lines do not go through the plot markers (the corresponding portions of the lines are explicitly removed). Other objects like grid lines and background are visible through the markers.
First, define auxiliary functions:
Input:
Plotting:
Neat Examples (5)
Center markers that pick up PlotStyle and PlotTheme automatically:
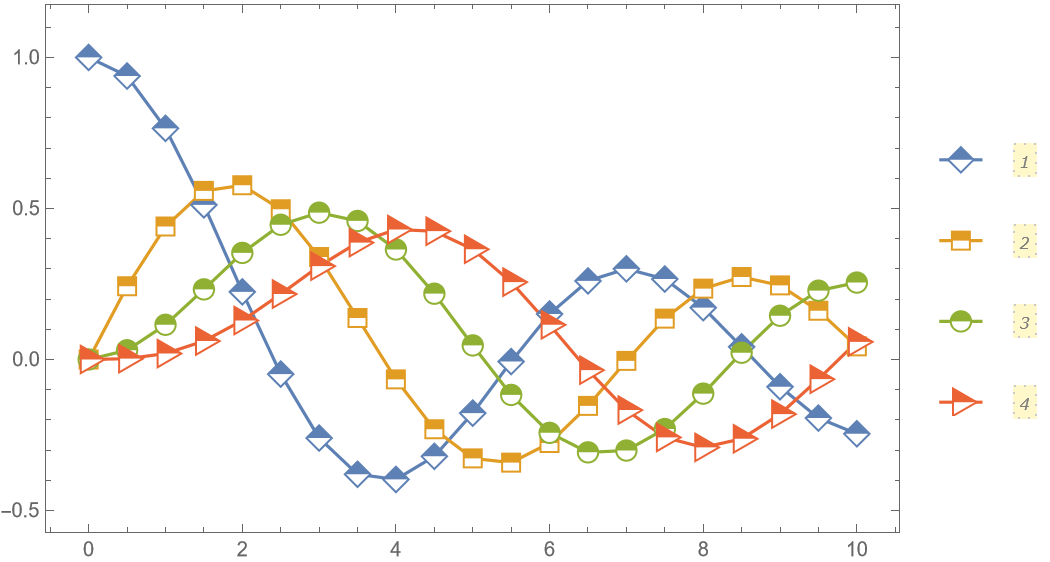
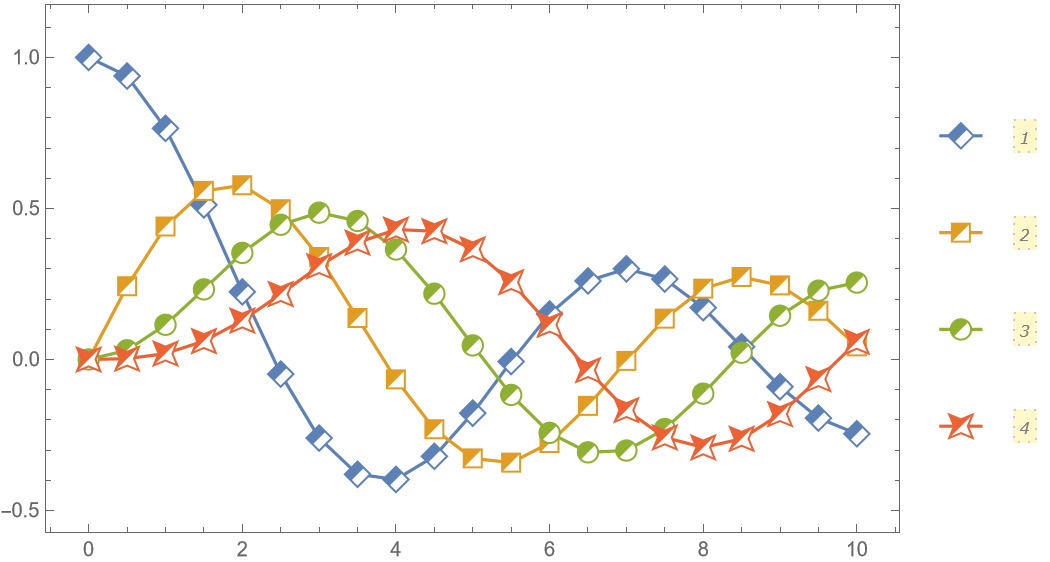
Half-filled markers that pick up PlotStyle and PlotTheme automatically:
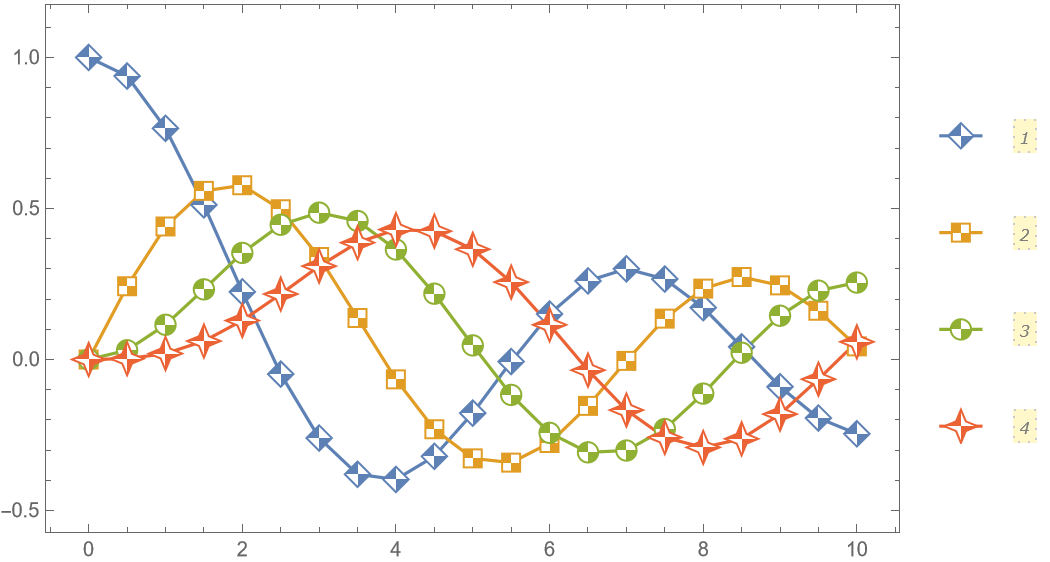
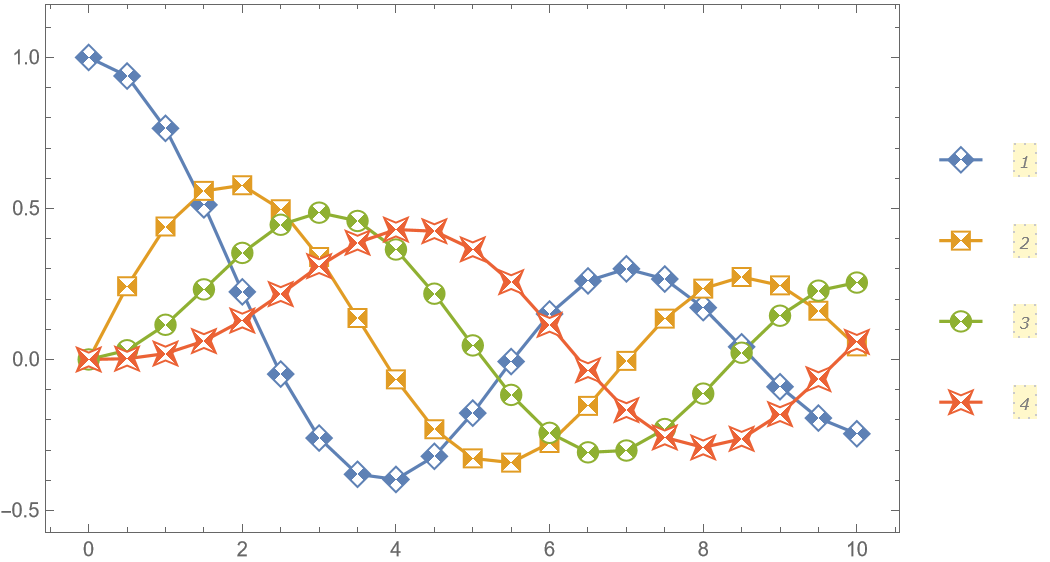
Contrast markers that pick up PlotStyle and PlotTheme automatically:
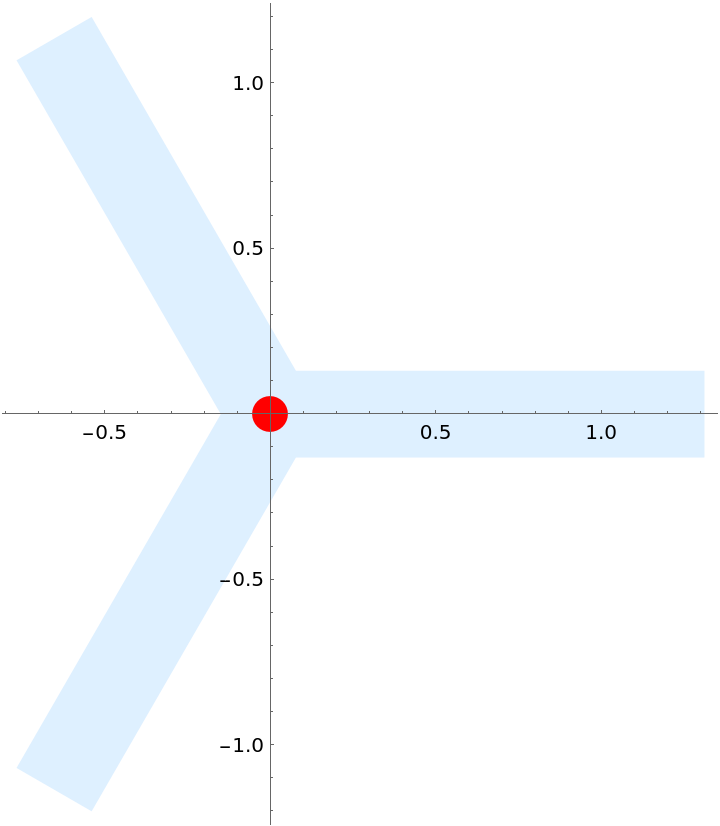
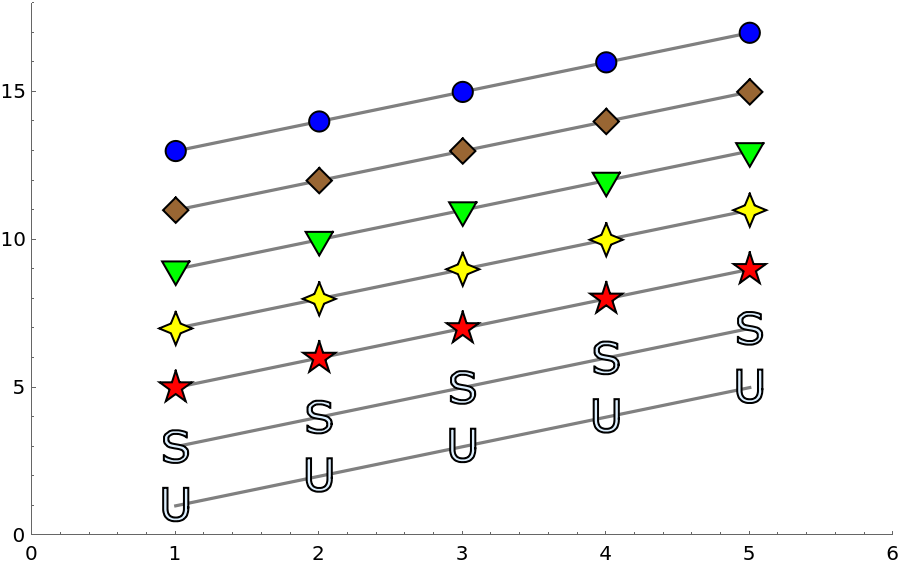
Create an auxiliary function that (approximately) converts a simple glyph into a set of points suitable for PolygonMarker:
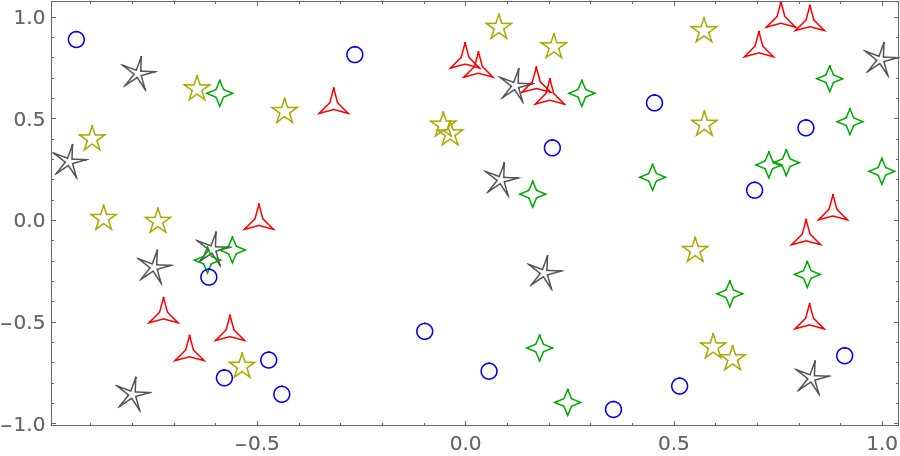
Show a set of markers in use, including some created from glyphs:
Black and white plot, where the markers overlap considerably:
Use the resource functions RoundedPolygon and NotchedPolygon to make markers:

![Grid[{allShapes[[;; 11]], allShapes[[12 ;; 17]], allShapes[[18 ;; 26]], allShapes[[27 ;; 32]], allShapes[[33 ;; 38]], allShapes[[39 ;;]]} /. shape_String :> Button[Tooltip[
ResourceFunction["PolygonMarker"][shape, Offset[13], {FaceForm[RandomColor[ColorSpace -> LUVColor]], EdgeForm[{Black, AbsoluteThickness[72/96], JoinForm["Miter"]}]}], Row[{"\"", Style[shape, Bold], "\"", " (click to copy the name)"}]], CopyToClipboard@ToString[shape, InputForm], ImageSize -> {40, 40},
FrameMargins -> False]]](https://www.wolframcloud.com/obj/resourcesystem/images/ddd/ddde2ab7-b449-427d-a364-bf9251afa485/61a0af6b954f7ca5.png)
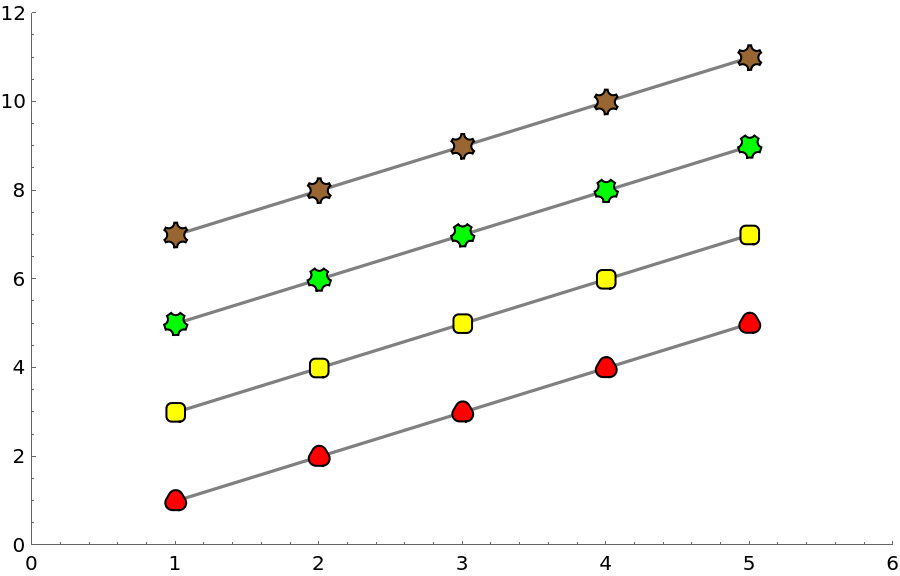
![ListPlot[Table[Accumulate@RandomReal[1, 10] + i, {i, 6}], PlotMarkers -> fm /@ {"Triangle", "Y", "Diamond", "ThreePointedStar", "FivePointedStarSlim", "TripleCross"}, Joined -> True, PlotStyle -> ColorData[52, "ColorList"], PlotLegends -> PointLegend[Automatic, LegendMarkerSize -> {50, 37}, LegendLayout -> (Column[Row /@ #, Spacings -> -1] &)], ImageSize -> 450]](https://www.wolframcloud.com/obj/resourcesystem/images/ddd/ddde2ab7-b449-427d-a364-bf9251afa485/6c70cdfe533d82f1.png)
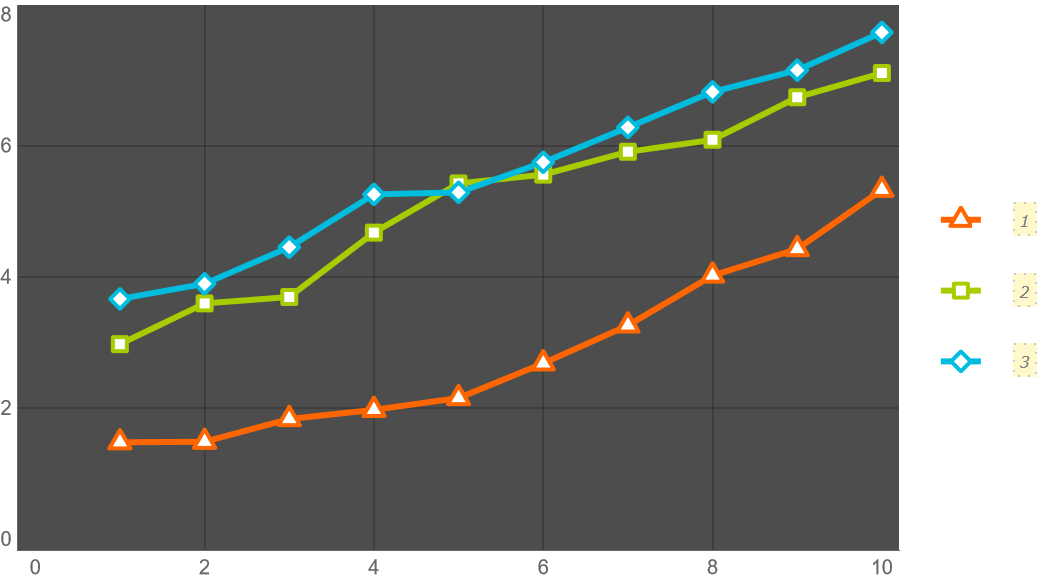
![ListPlot[Table[Accumulate@RandomReal[1, 10] + i, {i, 6}], PlotMarkers -> fm /@ {"Triangle", "LeftTriangle", "Diamond", "ThreePointedStar", "UpTriangleTruncated", "Square"}, PlotTheme -> "Marketing", PlotLegends -> PointLegend[Automatic, LegendMarkerSize -> {50, 35}, LegendLayout -> (Column[Row /@ #, Spacings -> -1] &)], ImageSize -> 450]](https://www.wolframcloud.com/obj/resourcesystem/images/ddd/ddde2ab7-b449-427d-a364-bf9251afa485/7e056c592f168769.png)
![em[name_String, size_ : 7] := ResourceFunction["PolygonMarker"][name, Offset[size],
{Dynamic@
EdgeForm[{CurrentValue["Color"], JoinForm["Round"], AbsoluteThickness[2], Opacity[1]}], FaceForm[White]},
ImagePadding -> 6];](https://www.wolframcloud.com/obj/resourcesystem/images/ddd/ddde2ab7-b449-427d-a364-bf9251afa485/775f592f7a212bc4.png)
![ListPlot[Table[Accumulate@RandomReal[1, 10] + i, {i, 3}], PlotMarkers -> em /@ {"Triangle", "Square", "Diamond"}, Joined -> True, PlotLegends -> PointLegend[Automatic, LegendMarkerSize -> {40, 25}], ImageSize -> 450]](https://www.wolframcloud.com/obj/resourcesystem/images/ddd/ddde2ab7-b449-427d-a364-bf9251afa485/1460a4a12a8a638c.png)
![ListPlot[Table[Accumulate@RandomReal[1, 10] + i, {i, 3}], PlotMarkers -> em /@ {"Triangle", "Square", "Diamond"}, Joined -> True, PlotLegends -> PointLegend[Automatic, LegendMarkerSize -> {40, 25}], PlotTheme -> "Marketing", ImageSize -> 450]](https://www.wolframcloud.com/obj/resourcesystem/images/ddd/ddde2ab7-b449-427d-a364-bf9251afa485/6bce36d1ef927d63.png)
![fm2[name_String, size_ : 9] := ResourceFunction["PolygonMarker"][name, Offset@size, {
Dynamic@EdgeForm[{CurrentValue["Color"], Opacity[1]}],
Dynamic@FaceForm@Lighter[CurrentValue["Color"], 0.75]}];
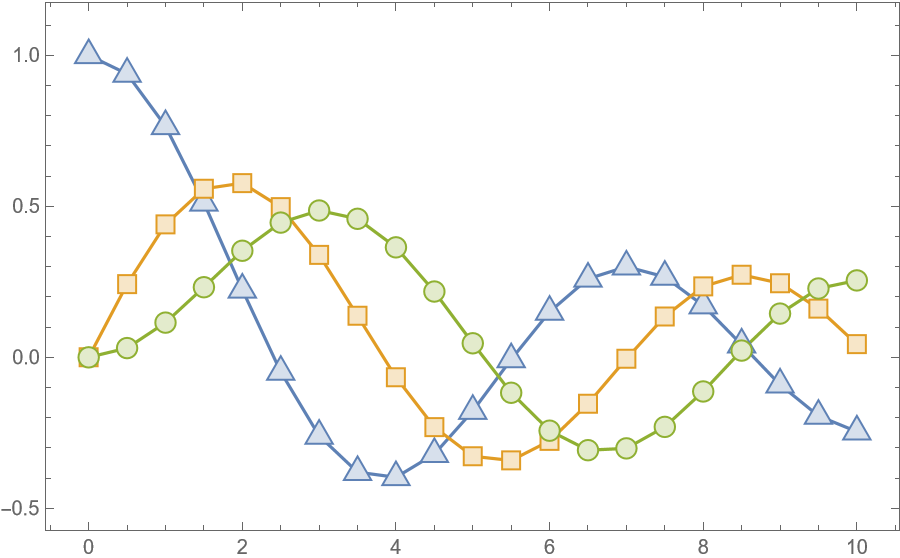
data = Table[{x, BesselJ[k, x]}, {k, 0, 2}, {x, 0, 10, 0.5}];
ListPlot[data, PlotMarkers -> fm2 /@ {"UpTriangle", "Square", "Circle"}, Joined -> True, Frame -> True, Axes -> False, ImageSize -> 450, PlotRangePadding -> {Scaled[.05], Scaled[.1]}]](https://www.wolframcloud.com/obj/resourcesystem/images/ddd/ddde2ab7-b449-427d-a364-bf9251afa485/02a51df375494da3.png)
![(* Evaluate this cell to get the example input *) CloudGet["https://www.wolframcloud.com/obj/a81f5ac7-3ed7-4e03-a891-36bde162e3ab"]](https://www.wolframcloud.com/obj/resourcesystem/images/ddd/ddde2ab7-b449-427d-a364-bf9251afa485/7d24a302d424d090.png)
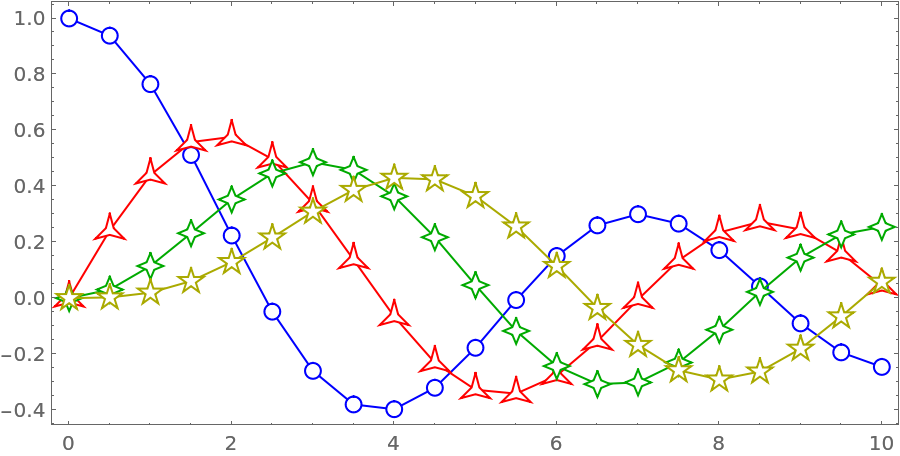
![data = Table[{x, BesselJ[k, x]}, {k, 0, 3}, {x, 0, 10, 0.5}];
markers = {"Circle", "ThreePointedStar", "FourPointedStar", "FivePointedStar"};
colors = {Blue, Red, Darker@Green, Darker@Yellow};
Graphics[
Table[{colors[[i]], Line[data[[i]]], FaceForm[White], EdgeForm[{colors[[i]], AbsoluteThickness[1], JoinForm["Miter"]}], ResourceFunction["PolygonMarker"][markers[[i]], Offset[7], data[[i]]]}, {i, Length[data]}], AspectRatio -> 1/2, ImageSize -> 450, Frame -> True]](https://www.wolframcloud.com/obj/resourcesystem/images/ddd/ddde2ab7-b449-427d-a364-bf9251afa485/5e89c90da4950947.png)
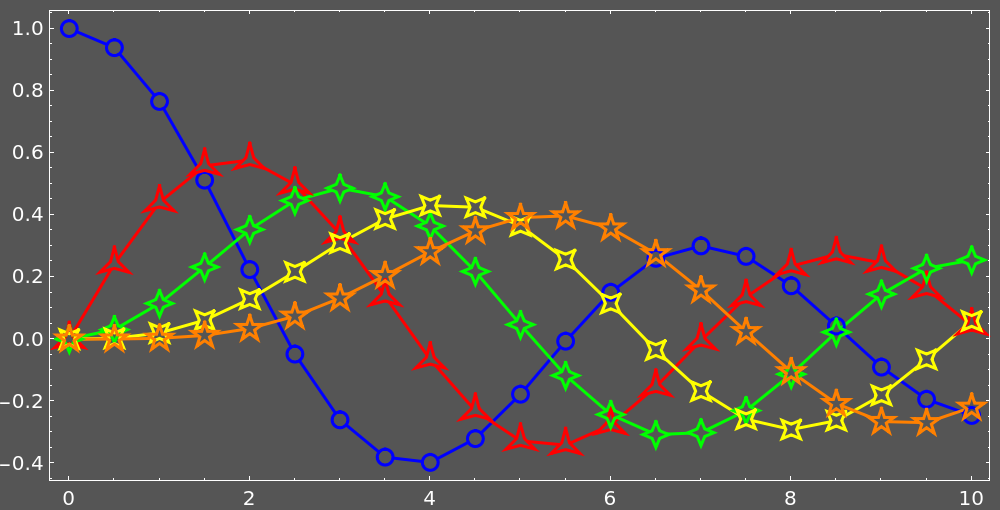
![data = Table[{x, BesselJ[k, x]}, {k, 0, 4}, {x, 0, 10, 0.5}];
markers = {"Circle", "ThreePointedStar", "FourPointedStar", "DiagonalFourPointedStar", "FivePointedStar"};
colors = {Blue, Red, Green, Yellow, Orange};
background = Darker@Gray;
Graphics[{Table[{colors[[i]], AbsoluteThickness[1.5], Line[data[[i]]],
FaceForm[background], EdgeForm[None], ResourceFunction["PolygonMarker"][markers[[i]], Offset[7], data[[i]]]}, {i, Length[data]}], Table[{FaceForm[None], EdgeForm[{colors[[i]], AbsoluteThickness[1.5], JoinForm["Miter"]}], ResourceFunction["PolygonMarker"][markers[[i]], Offset[7], data[[i]]]}, {i, Length[data]}]}, AspectRatio -> 1/2, ImageSize -> 500, Frame -> True, Background -> background, FrameStyle -> White, ImagePadding -> {{25, 5}, {15, 5}}]](https://www.wolframcloud.com/obj/resourcesystem/images/ddd/ddde2ab7-b449-427d-a364-bf9251afa485/041f1f753f646974.png)
![(* Evaluate this cell to get the example input *) CloudGet["https://www.wolframcloud.com/obj/40e981b4-d03f-4df5-9c83-f67da246af67"]](https://www.wolframcloud.com/obj/resourcesystem/images/ddd/ddde2ab7-b449-427d-a364-bf9251afa485/5d27c4db6a3ed84e.png)
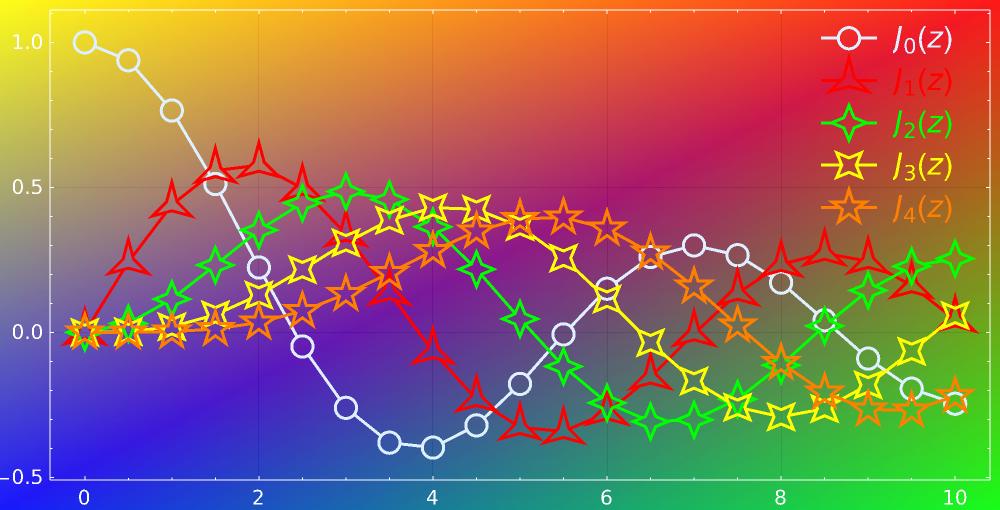
![(* The data set to plot *)
data = Table[{x, BesselJ[k, x]}, {k, 0, 4}, {x, 0, 10, 0.5}];
(* Labels for the legend *)
labels = Table[Style[Subscript[J, n][z], 15], {n, 0, 4}];
(* Aspect ratio of the whole plot area (doesn't include ImagePadding) *)
aspectRatio = 1/2;
(* Plot markers *)
markers = {"Circle", "ThreePointedStar", "FourPointedStar", "DiagonalFourPointedStar", "FivePointedStar"};
(* Colors for the lines&markers *)
colors = {LightBlue, Red, Green, Yellow, Orange};
(* Backgound image *)
background = Polygon[ImageScaled /@ {{0, 0}, {1, 0}, {1, 1}, {0, 1}}, VertexColors -> RGBColor /@ {{0, 0, 1, .9}, {0, 1, 0, .9}, {1, 0, 0, .9}, {1, 1, 0, .9}}];](https://www.wolframcloud.com/obj/resourcesystem/images/ddd/ddde2ab7-b449-427d-a364-bf9251afa485/0d0f68e06a5be399.png)
![(* Determine the range of the input data *)
dataRange = MinMax /@ Transpose[Flatten[data, 1]];
(* Expand the plot area to fit all the graphics elements. This value must be specified as the value for PlotRange *)
fullPlotRange = padPlotRange[.04, aspectRatio]@dataRange;
(* Define full specifications for the markers *)
markerSpecs = Table[{markers[[i]], .02}, {i, Length[data]}];
(* Define styles for the lines and the markers *)
plotStyles = Table[{colors[[i]], AbsoluteThickness[1.5], CapForm[None], FaceForm[None], EdgeForm[{colors[[i]], AbsoluteThickness[1.5], JoinForm[{"Miter", 6}]}]}, {i, Length[data]}];
(* Generate graphics primitives representing the lines and the markers, along with the corresponding styling directives *)
plotPrimitives = Table[Join[plotStyles[[i]], createLineWithMarkers[markerSpecs[[i]], data[[i]], fullPlotRange, aspectRatio]], {i, Length[data]}];
(* Generate graphics primitives representing the legend *)
legendPrimitives = createLegend[markerSpecs, labels, {.045, .08, .06}, {.85, .29}, plotStyles, fullPlotRange, aspectRatio];
(* Construct a Graphics object from the set of graphics primitives *)
Graphics[{plotPrimitives, legendPrimitives}, PlotRange -> fullPlotRange, AspectRatio -> aspectRatio, ImageSize -> 500, Frame -> True, FrameStyle -> White, ImagePadding -> {{25, 5}, {15, 5}}, GridLines -> Automatic, GridLinesStyle -> Black, Prolog -> background]](https://www.wolframcloud.com/obj/resourcesystem/images/ddd/ddde2ab7-b449-427d-a364-bf9251afa485/1965d8089e22b43d.png)
![cfm[name_String, size_ : 9] := Show[
ResourceFunction["PolygonMarker"][name, Offset@size, {
FaceForm[White],
Dynamic@
EdgeForm[{CurrentValue["Color"], AbsoluteThickness[1], Opacity[1]}]}],
ResourceFunction["PolygonMarker"][name, Offset[size/2], EdgeForm[None]]];
data = Table[{x, BesselJ[k, x]}, {k, 0, 2}, {x, 0, 10, 0.5}];
ListPlot[data, PlotMarkers -> cfm /@ {"UpTriangle", "Square", "Circle"}, Joined -> True, Frame -> True, Axes -> False, ImageSize -> 450, PlotRangePadding -> {Scaled[.05], Scaled[.1]}, PlotLegends -> PointLegend[Automatic, LegendMarkerSize -> {40, 30}], ImageSize -> 450]](https://www.wolframcloud.com/obj/resourcesystem/images/ddd/ddde2ab7-b449-427d-a364-bf9251afa485/4dddc92a59d91cdd.png)
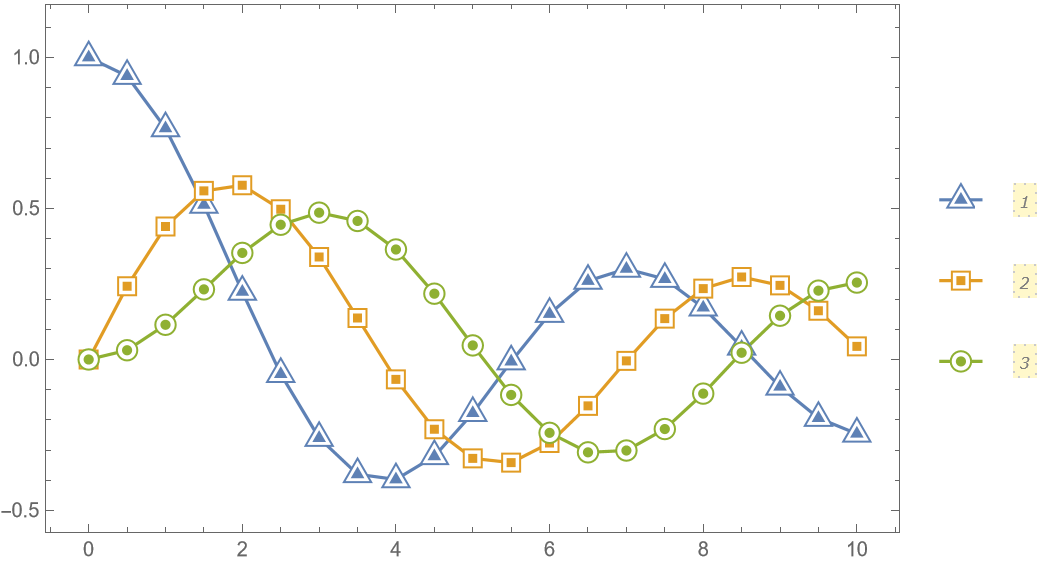
![hfm1[name_String, size_ : 9] := Show[
ResourceFunction["PolygonMarker"][name, Offset@size, {
FaceForm[White],
Dynamic@
EdgeForm[{CurrentValue["Color"], AbsoluteThickness[1], Opacity[1]}]}],
ResourceFunction["PolygonMarker"][name, Offset@size, EdgeForm[None]] /. {x_?Negative, y_?NumericQ} :> {0, y}];
data = Table[{x, BesselJ[k, x]}, {k, 0, 2}, {x, 0, 10, 0.5}];
ListPlot[data, PlotMarkers -> hfm1 /@ {"UpTriangle", "Square", "Circle"}, Joined -> True, Frame -> True, Axes -> False, ImageSize -> 450, PlotRangePadding -> {Scaled[.05], Scaled[.1]}, PlotLegends -> PointLegend[Automatic, LegendMarkerSize -> {40, 30}], ImageSize -> 450]](https://www.wolframcloud.com/obj/resourcesystem/images/ddd/ddde2ab7-b449-427d-a364-bf9251afa485/5382c08c9ad401f5.png)
![hfm2[name_String, size_ : 9] := Show[
ResourceFunction["PolygonMarker"][name, Offset@size, {
FaceForm[White],
Dynamic@
EdgeForm[{CurrentValue["Color"], AbsoluteThickness[1], Opacity[1]}]}],
Graphics[{EdgeForm[None], Replace[RegionDifference[ResourceFunction["PolygonMarker"][name],
Rectangle[{-10, -10}, {10, 0}]], p : {x_, y_} :> Offset[size p, {0, 0}], {-2}]}]];
data = Table[{x, BesselJ[k, x]}, {k, 0, 3}, {x, 0, 10, 0.5}];
ListPlot[data, PlotMarkers -> hfm2 /@ {"Diamond", "Square", "Circle", "RightTriangle"}, Joined -> True, Frame -> True, Axes -> False, ImageSize -> 450, PlotRangePadding -> {Scaled[.05], Scaled[.1]}, PlotLegends -> PointLegend[Automatic, LegendMarkerSize -> {40, 30}], ImageSize -> 450]](https://www.wolframcloud.com/obj/resourcesystem/images/ddd/ddde2ab7-b449-427d-a364-bf9251afa485/11637640c211d139.png)
![hfm3[name_String, size_ : 9] := Show[
ResourceFunction["PolygonMarker"][name, Offset@size, {
FaceForm[White],
Dynamic@
EdgeForm[{CurrentValue["Color"], AbsoluteThickness[1], Opacity[1]}]}],
Graphics[{EdgeForm[None], Replace[RegionDifference[ResourceFunction["PolygonMarker"][name],
Triangle[{{-10, -10}, {10, 10}, {10, -10}}]], p : {x_, y_} :> Offset[size p, {0, 0}], {-2}]}]];
data = Table[{x, BesselJ[k, x]}, {k, 0, 3}, {x, 0, 10, 0.5}];
ListPlot[data, PlotMarkers -> hfm3 /@ {"Diamond", "Square", "Circle", "DiagonalFourPointedStar"}, Joined -> True, Frame -> True, Axes -> False, ImageSize -> 450, PlotRangePadding -> {Scaled[.05], Scaled[.1]}, PlotLegends -> PointLegend[Automatic, LegendMarkerSize -> {40, 38}], ImageSize -> 450]](https://www.wolframcloud.com/obj/resourcesystem/images/ddd/ddde2ab7-b449-427d-a364-bf9251afa485/5a3f8486f46ec102.png)
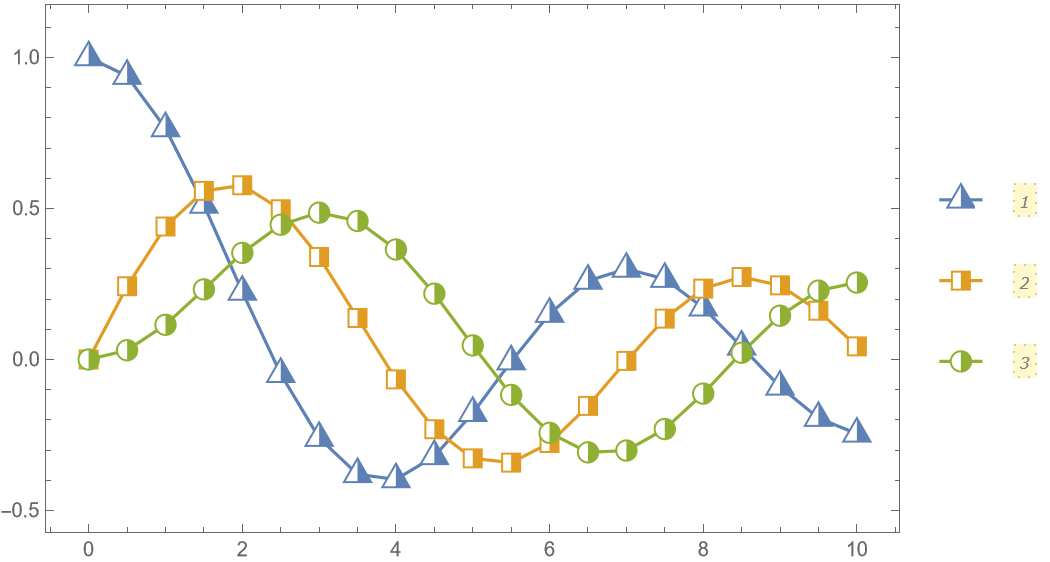
![cfm1[name_String, size_ : 9] := Show[
ResourceFunction["PolygonMarker"][name, Offset@size, {
FaceForm[White],
Dynamic@
EdgeForm[{CurrentValue["Color"], AbsoluteThickness[1], Opacity[1]}]}],
Graphics[{EdgeForm[None], Replace[RegionDifference[
RegionDifference[ResourceFunction["PolygonMarker"][name], Rectangle[{0, 0}, {10, 10}]], Rectangle[{0, 0}, {-10, -10}]], p : {x_, y_} :> Offset[size p, {0, 0}], {-2}]}]];
data = Table[{x, BesselJ[k, x]}, {k, 0, 3}, {x, 0, 10, 0.5}];
ListPlot[data, PlotMarkers -> cfm1 /@ {"Diamond", "Square", "Circle", "FourPointedStar"}, Joined -> True, Frame -> True, Axes -> False, ImageSize -> 450, PlotRangePadding -> {Scaled[.05], Scaled[.1]}, PlotLegends -> PointLegend[Automatic, LegendMarkerSize -> {40, 38}], ImageSize -> 450]](https://www.wolframcloud.com/obj/resourcesystem/images/ddd/ddde2ab7-b449-427d-a364-bf9251afa485/58062e1b8d113944.png)
![cfm2[name_String, size_ : 9] := Show[
ResourceFunction["PolygonMarker"][name, Offset@size, {
FaceForm[White],
Dynamic@
EdgeForm[{CurrentValue["Color"], AbsoluteThickness[1], Opacity[1]}]}],
Graphics[{EdgeForm[None], Replace[RegionDifference[
RegionDifference[ResourceFunction["PolygonMarker"][name], Triangle[{{-10, 10}, {10, 10}, {0, 0}}]], Triangle[{{-10, -10}, {10, -10}, {0, 0}}]], p : {x_, y_} :> Offset[size p, {0, 0}], {-2}]}]];
data = Table[{x, BesselJ[k, x]}, {k, 0, 3}, {x, 0, 10, 0.5}];
ListPlot[data, PlotMarkers -> cfm2 /@ {"Diamond", "Square", "Circle", "DiagonalFourPointedStar"}, Joined -> True, Frame -> True, Axes -> False, ImageSize -> 450, PlotRangePadding -> {Scaled[.05], Scaled[.1]}, PlotLegends -> PointLegend[Automatic, LegendMarkerSize -> {40, 30}], ImageSize -> 450]](https://www.wolframcloud.com/obj/resourcesystem/images/ddd/ddde2ab7-b449-427d-a364-bf9251afa485/3d9e3bdf4415dd13.png)
![pts[l_String] := First[Cases[
ImportString[
ExportString[Style[l, FontFamily -> "Verdana", FontSize -> 20], "PDF"], If[$VersionNumber >= 12.2, {"PDF", "PageGraphics"}, {"PDF", "Pages"}]], c_FilledCurve :> c[[2, 1]], Infinity]];](https://www.wolframcloud.com/obj/resourcesystem/images/ddd/ddde2ab7-b449-427d-a364-bf9251afa485/7f45dc7d0185388d.png)
![(* Evaluate this cell to get the example input *) CloudGet["https://www.wolframcloud.com/obj/25744c2a-a2e8-40eb-b8d0-0a076b1ac3a2"]](https://www.wolframcloud.com/obj/resourcesystem/images/ddd/ddde2ab7-b449-427d-a364-bf9251afa485/21062c13dae5551e.png)
![(* Evaluate this cell to get the example input *) CloudGet["https://www.wolframcloud.com/obj/9a8d224b-63d3-46fa-b42b-8710be629e14"]](https://www.wolframcloud.com/obj/resourcesystem/images/ddd/ddde2ab7-b449-427d-a364-bf9251afa485/67693c7e20770d64.png)

![(* Evaluate this cell to get the example input *) CloudGet["https://www.wolframcloud.com/obj/91ec3e45-de08-4473-93dd-e6f719eb76ad"]](https://www.wolframcloud.com/obj/resourcesystem/images/ddd/ddde2ab7-b449-427d-a364-bf9251afa485/2ba4c192db7f5303.png)