Details and Options
The basic usage syntax is ResourceFunction["PolygonMarker"][shape,spec], where shape is the name of a predefined shape or a list of 2D coordinates describing a simple polygon, and spec can be either size or {size, angle}.
The
size can be given as a number or in
Scaled or
Offset form.
The angle in radians determines the angle of counterclocwise rotation of shape about its centroid.
ResourceFunction["PolygonMarker"][shape,spec] returns a
Polygon graphics primitive that can be used in
Graphics.
ResourceFunction["PolygonMarker"][shape,spec,style], where
style is a list of graphics directives applied to
shape, returns a
Graphics object which can be used as a marker for
PlotMarkers.
ResourceFunction["PolygonMarker"][shape,spec,style,options] returns a
Graphics object with
options applied.
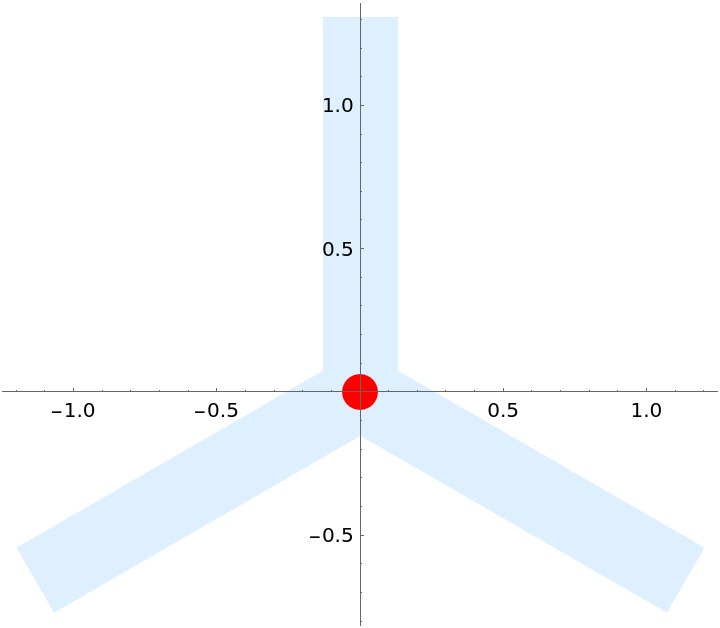
The centroid of
Polygon generated by
ResourceFunction["PolygonMarker"] is always placed at
{0,0} in the internal coordinate system of
Graphics.
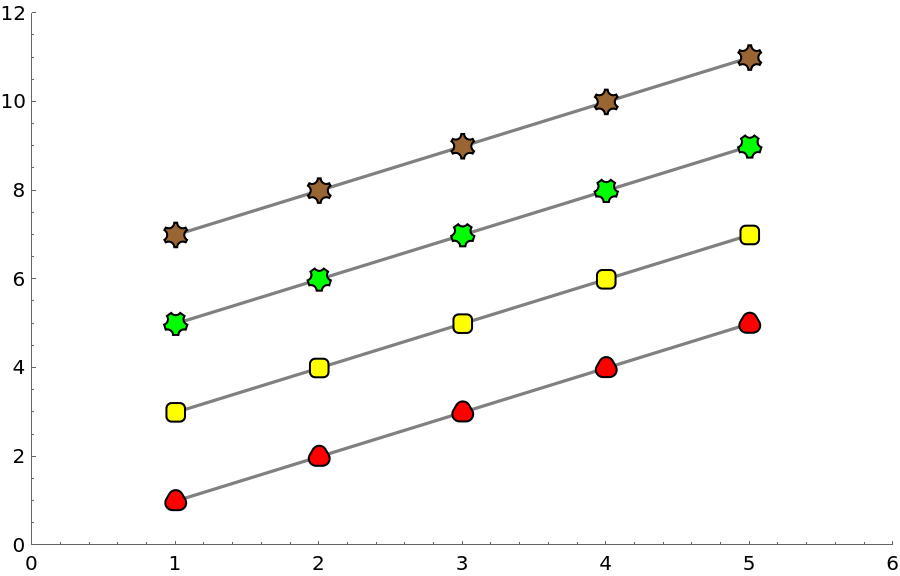
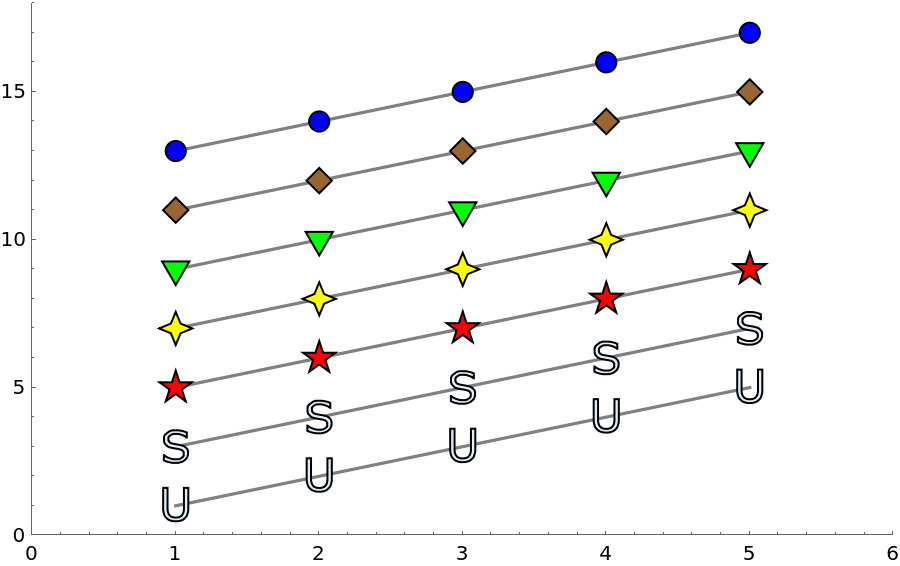
ResourceFunction["PolygonMarker"][shape,spec,positions], where
positions is a list of 2D coordinates, evaluates to
Translate[ResourceFunction["PolygonMarker"][shape,spec],positions]. It represents a collection of multiple identical copies of
shape with centroids placed at
positions.
With an
Offset size specification, the plot marker has a fixed size specified in printer's points, independent of
ImageSize.
ResourceFunction["PolygonMarker"][shape,size] returns a
Polygon with area
size2 in the internal coordinate system of
Graphics.
ResourceFunction["PolygonMarker"][shape,Offset[size]] returns a
Polygon with area
size2 square printer’s points. The area taken by the boundary of the returned
Polygon isn’t taken into account.
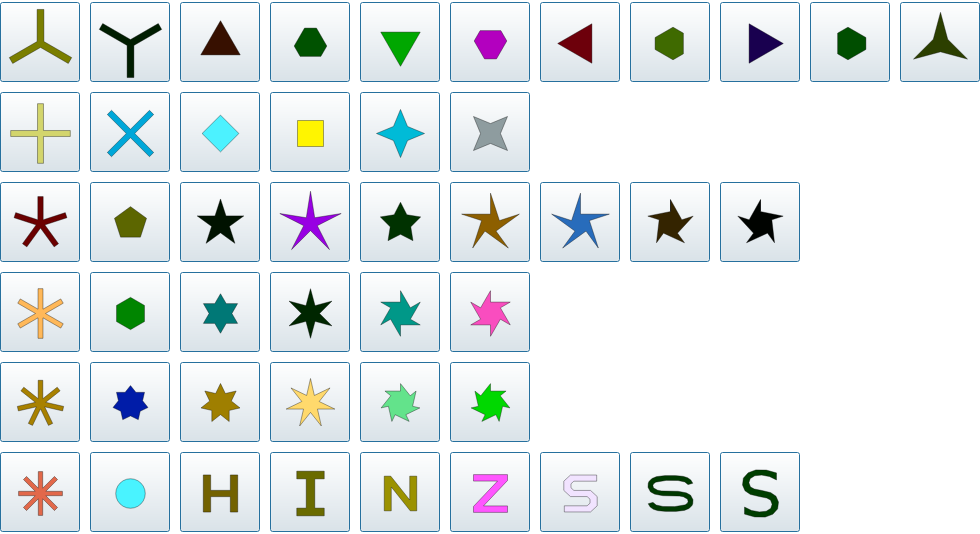
ResourceFunction["PolygonMarker"][All] and
ResourceFunction["PolygonMarker"][] both return the complete list of names of predefined shapes.

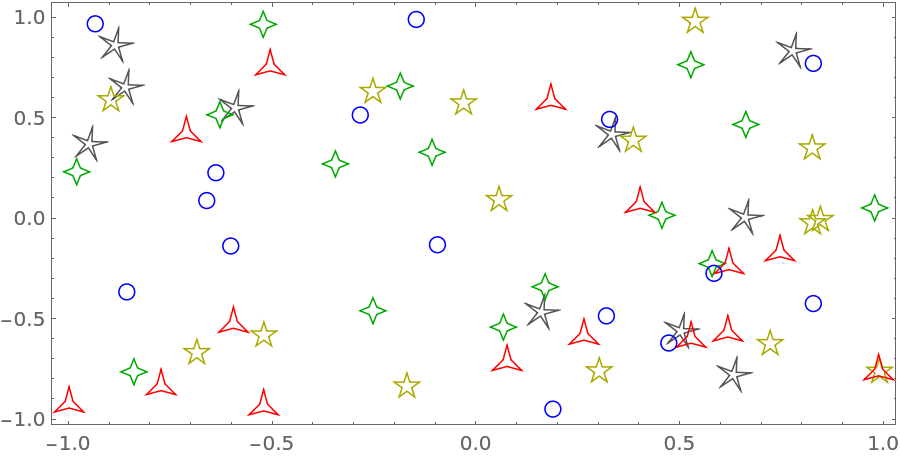
![Grid[{allShapes[[;; 11]], allShapes[[12 ;; 17]], allShapes[[18 ;; 26]], allShapes[[27 ;; 32]], allShapes[[33 ;; 38]], allShapes[[39 ;;]]} /. shape_String :> Button[Tooltip[
ResourceFunction["PolygonMarker"][shape, Offset[13], {FaceForm[RandomColor[ColorSpace -> LUVColor]], EdgeForm[{Black, Thickness[0.005], JoinForm["Miter"]}]}], Row[{"\"", Style[shape, Bold], "\"", " (click to copy the name)"}]], CopyToClipboard@ToString[shape, InputForm], ImageSize -> {40, 40},
FrameMargins -> False]]](https://www.wolframcloud.com/obj/resourcesystem/images/ddd/ddde2ab7-b449-427d-a364-bf9251afa485/4-0-0/443fe3f0779a4861.png)
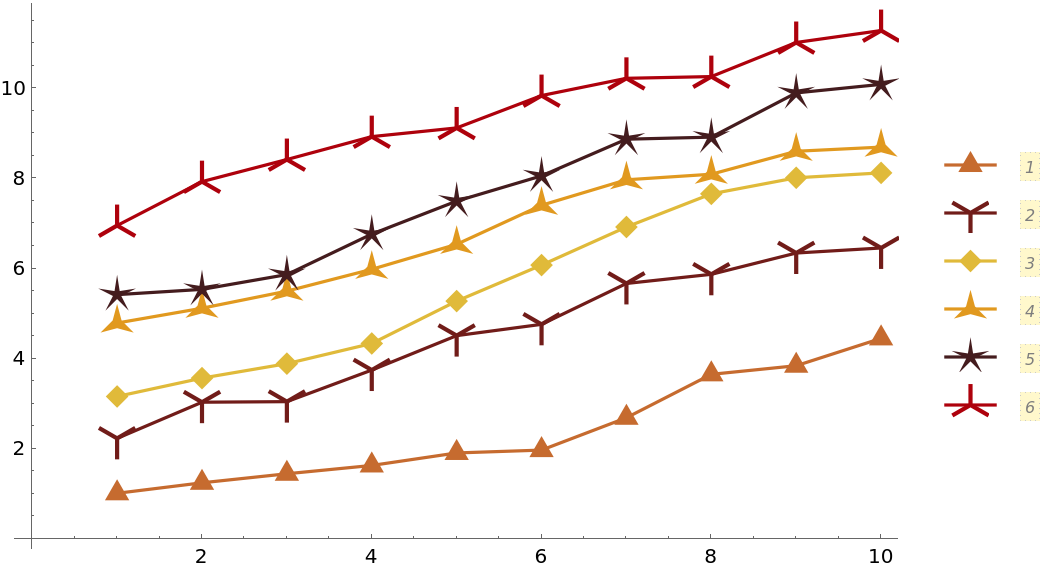
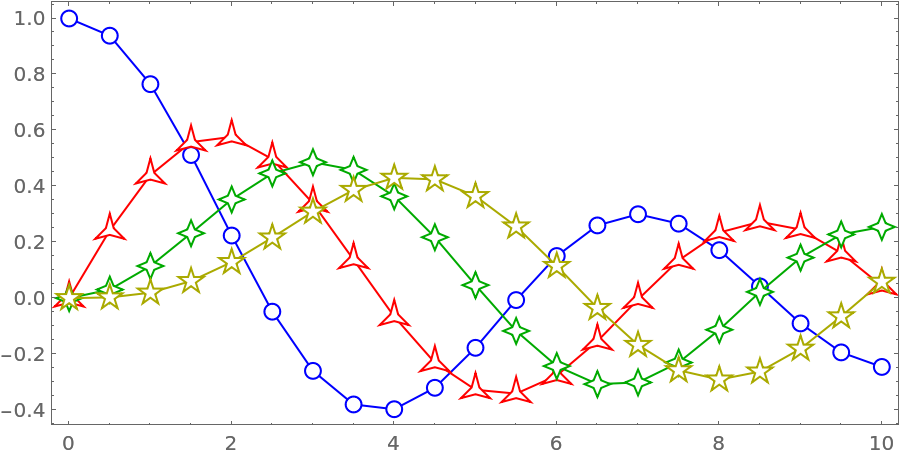
![ListPlot[Table[Accumulate@RandomReal[1, 10] + i, {i, 6}], PlotMarkers -> fm /@ {"Triangle", "Y", "Diamond", "ThreePointedStar", "FivePointedStarSlim", "TripleCross"}, Joined -> True, PlotStyle -> ColorData[52, "ColorList"], PlotLegends -> PointLegend[Automatic, LegendMarkerSize -> {50, 37}, LegendLayout -> (Column[Row /@ #, Spacings -> -1] &)], ImageSize -> 450]](https://www.wolframcloud.com/obj/resourcesystem/images/ddd/ddde2ab7-b449-427d-a364-bf9251afa485/4-0-0/1e636068f6131ac9.png)
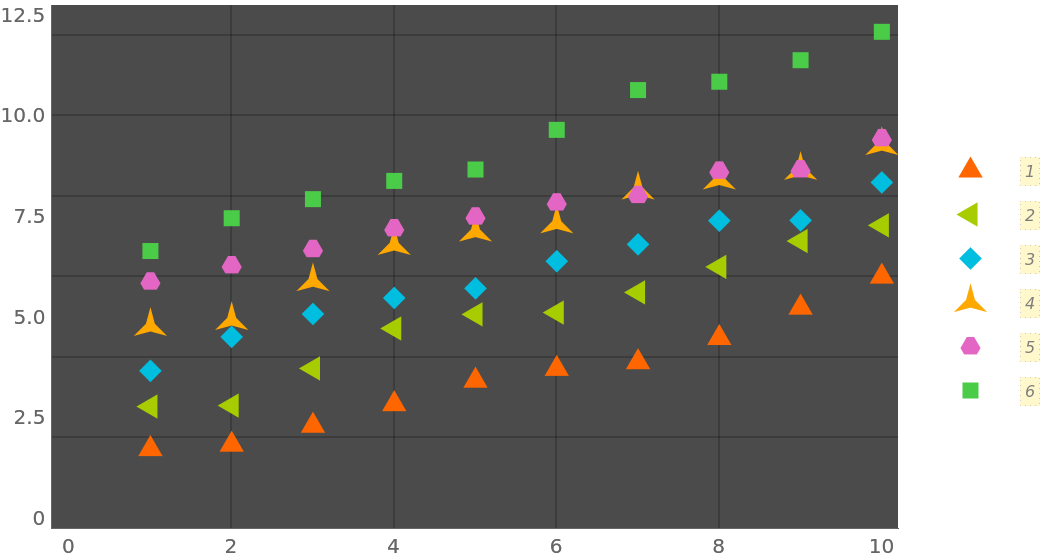
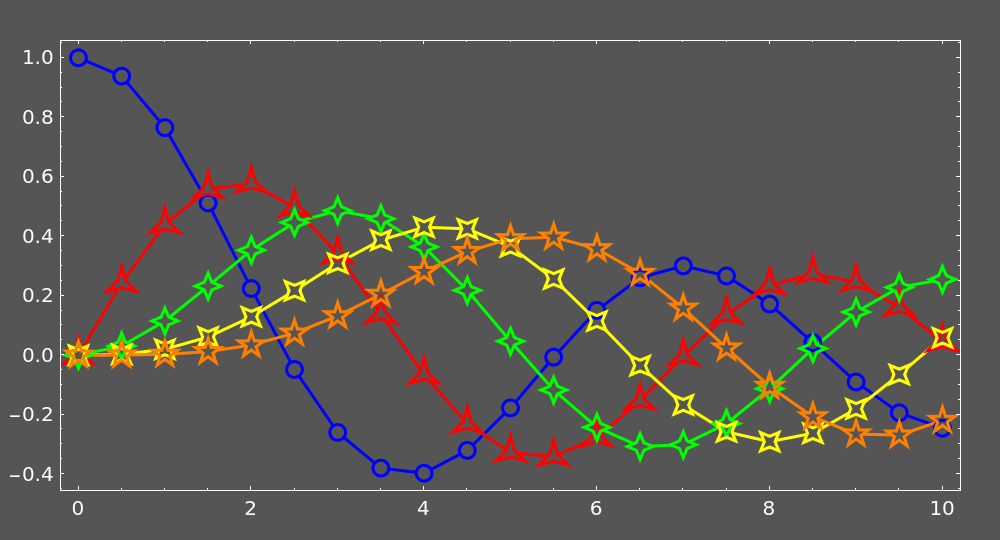
![ListPlot[Table[Accumulate@RandomReal[1, 10] + i, {i, 6}], PlotMarkers -> fm /@ {"Triangle", "LeftTriangle", "Diamond", "ThreePointedStar", "UpTriangleTruncated", "Square"}, PlotTheme -> "Marketing", PlotLegends -> PointLegend[Automatic, LegendMarkerSize -> {50, 35}, LegendLayout -> (Column[Row /@ #, Spacings -> -1] &)], ImageSize -> 450]](https://www.wolframcloud.com/obj/resourcesystem/images/ddd/ddde2ab7-b449-427d-a364-bf9251afa485/4-0-0/18d04a184757692e.png)
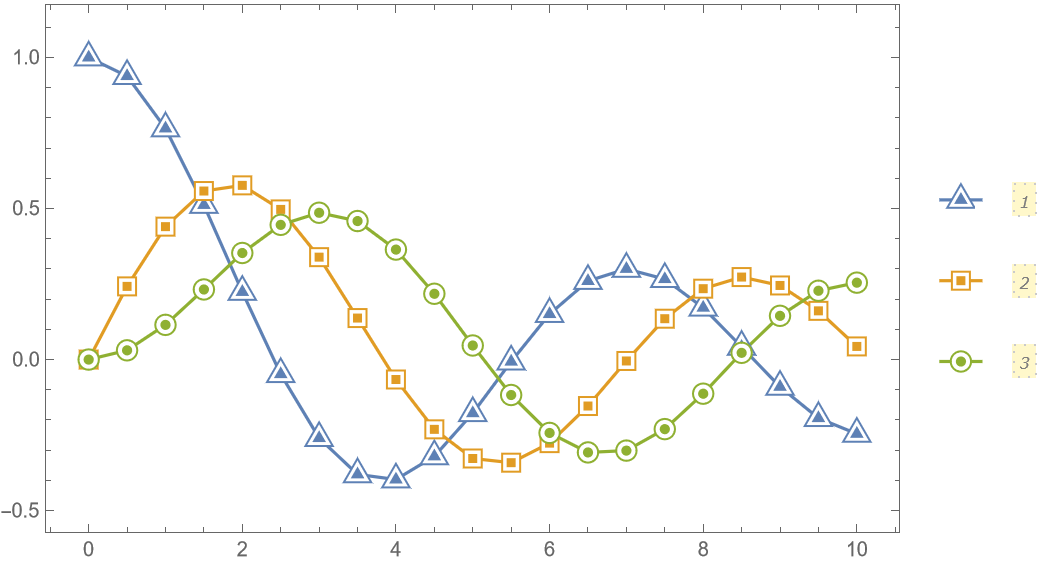
![em[name_String, size_ : 7] := ResourceFunction["PolygonMarker"][name, Offset[size],
{Dynamic@
EdgeForm@
Directive[CurrentValue["Color"], JoinForm["Round"], AbsoluteThickness[2], Opacity[1]],
FaceForm[White]}, ImagePadding -> 6];](https://www.wolframcloud.com/obj/resourcesystem/images/ddd/ddde2ab7-b449-427d-a364-bf9251afa485/4-0-0/6a859c4c8c54db6b.png)
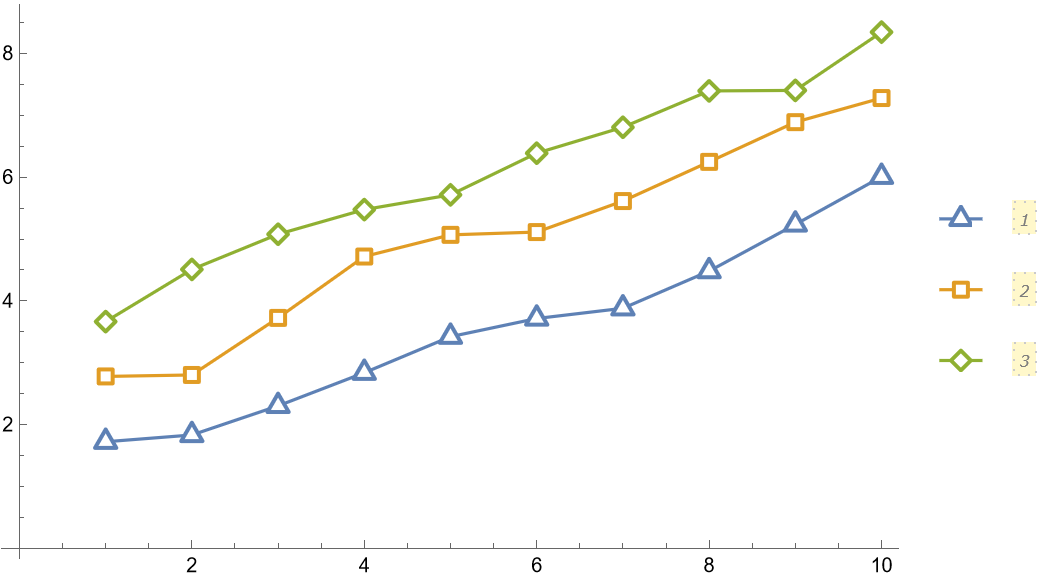
![ListPlot[Table[Accumulate@RandomReal[1, 10] + i, {i, 3}], PlotMarkers -> em /@ {"Triangle", "Square", "Diamond"}, Joined -> True, PlotLegends -> PointLegend[Automatic, LegendMarkerSize -> {40, 25}], ImageSize -> 450]](https://www.wolframcloud.com/obj/resourcesystem/images/ddd/ddde2ab7-b449-427d-a364-bf9251afa485/4-0-0/6e9f9b34a460158a.png)
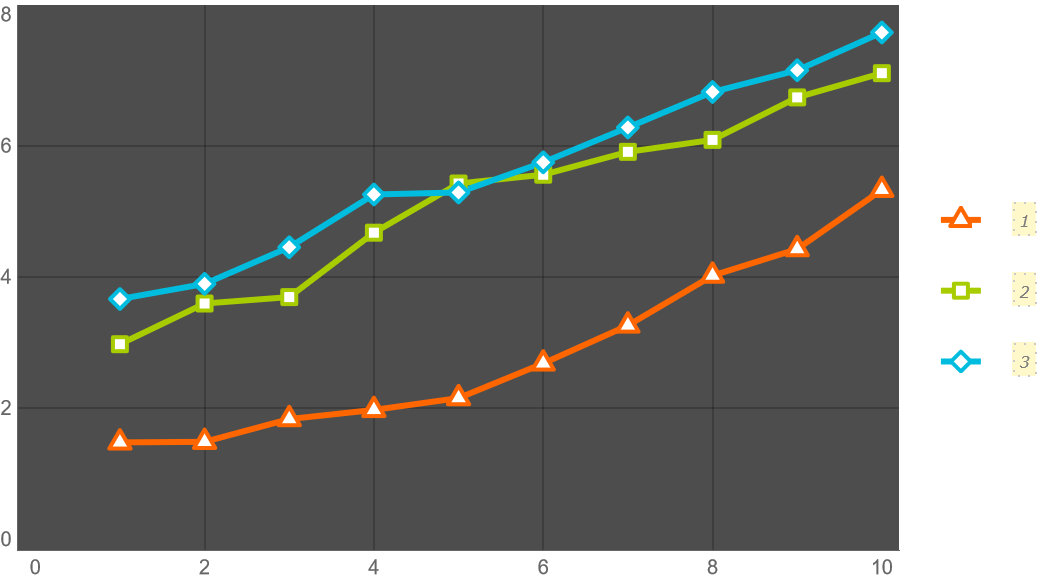
![ListPlot[Table[Accumulate@RandomReal[1, 10] + i, {i, 3}], PlotMarkers -> em /@ {"Triangle", "Square", "Diamond"}, Joined -> True, PlotLegends -> PointLegend[Automatic, LegendMarkerSize -> {40, 25}], PlotTheme -> "Marketing", ImageSize -> 450]](https://www.wolframcloud.com/obj/resourcesystem/images/ddd/ddde2ab7-b449-427d-a364-bf9251afa485/4-0-0/5ccc49ce7a106eeb.png)
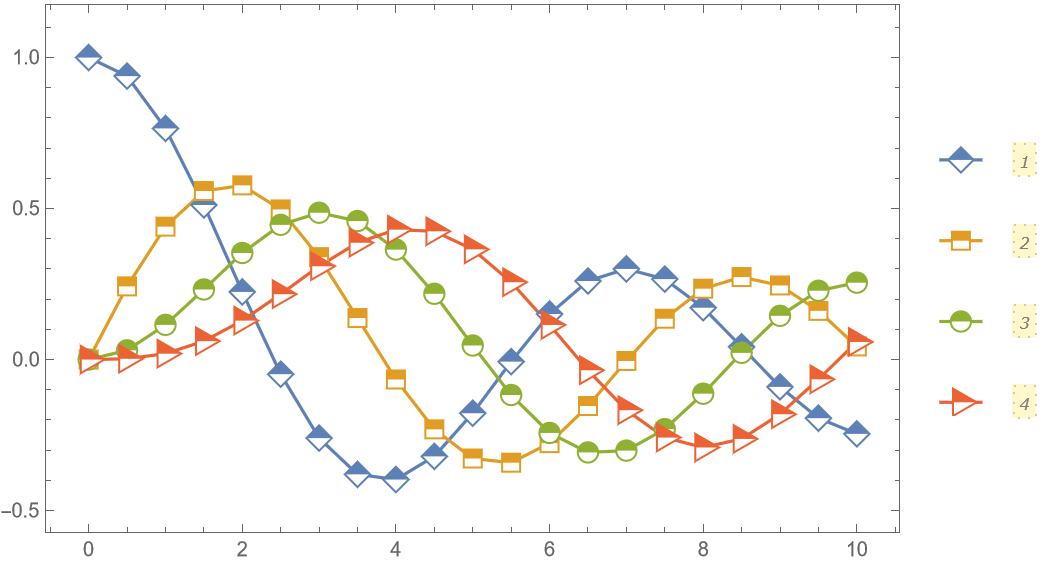
![fm2[name_String, size_ : 9] := ResourceFunction["PolygonMarker"][name, Offset@size, {
Dynamic@EdgeForm[{CurrentValue["Color"], Opacity[1]}],
Dynamic@FaceForm@Lighter[CurrentValue["Color"], 0.75]}];
data = Table[{x, BesselJ[k, x]}, {k, 0, 2}, {x, 0, 10, 0.5}];
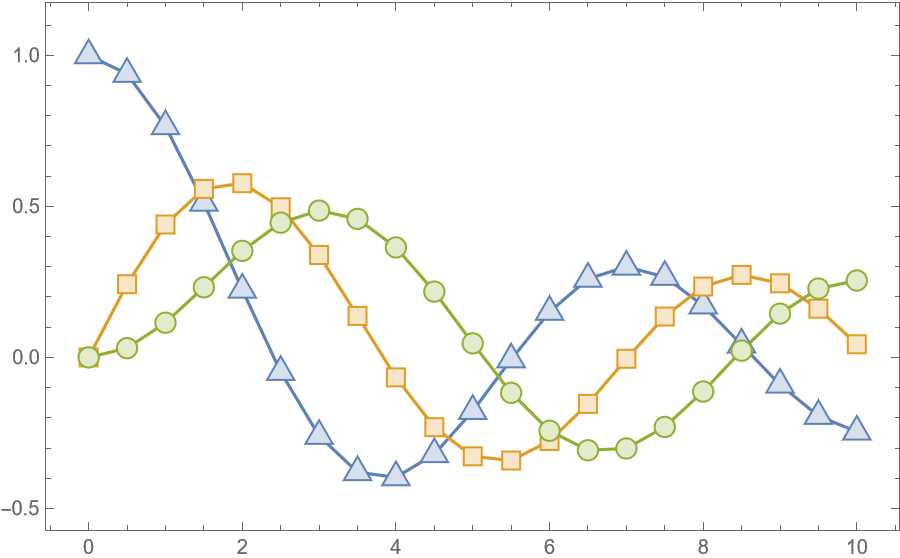
ListPlot[data, PlotMarkers -> fm2 /@ {"UpTriangle", "Square", "Circle"}, Joined -> True, Frame -> True, Axes -> False, ImageSize -> 450, PlotRangePadding -> {Scaled[.05], Scaled[.1]}]](https://www.wolframcloud.com/obj/resourcesystem/images/ddd/ddde2ab7-b449-427d-a364-bf9251afa485/4-0-0/65ea8e7df531d3a9.png)
![(* Evaluate this cell to get the example input *) CloudGet["https://www.wolframcloud.com/obj/7b5fc39f-1fe8-4961-86e4-5cfafd699ee0"]](https://www.wolframcloud.com/obj/resourcesystem/images/ddd/ddde2ab7-b449-427d-a364-bf9251afa485/4-0-0/55dcce5f0e6ccf9a.png)
![data = Table[{x, BesselJ[k, x]}, {k, 0, 3}, {x, 0, 10, 0.5}];
markers = {"Circle", "ThreePointedStar", "FourPointedStar", "FivePointedStar"};
colors = {Blue, Red, Darker@Green, Darker@Yellow};
Graphics[Table[{colors[[i]], Line[data[[i]]], FaceForm[White], EdgeForm[{colors[[i]], AbsoluteThickness[1], JoinForm["Miter"]}], ResourceFunction["PolygonMarker"][markers[[i]], Offset[7], data[[i]]]}, {i, Length[data]}], AspectRatio -> 1/2, ImageSize -> 450, Frame -> True]](https://www.wolframcloud.com/obj/resourcesystem/images/ddd/ddde2ab7-b449-427d-a364-bf9251afa485/4-0-0/494f5fa48f3a08a8.png)
![data = Table[{x, BesselJ[k, x]}, {k, 0, 4}, {x, 0, 10, 0.5}];
markers = {"Circle", "ThreePointedStar", "FourPointedStar", "DiagonalFourPointedStar", "FivePointedStar"};
colors = {Blue, Red, Green, Yellow, Orange};
background = Darker@Gray;
Graphics[{Table[{colors[[i]], AbsoluteThickness[1.5], Line[data[[i]]],
FaceForm[background], EdgeForm[None], ResourceFunction["PolygonMarker"][markers[[i]], Offset[7], data[[i]]]}, {i, Length[data]}], Table[{FaceForm[None], EdgeForm[{colors[[i]], AbsoluteThickness[1.5], JoinForm["Miter"]}], ResourceFunction["PolygonMarker"][markers[[i]], Offset[7], data[[i]]]}, {i, Length[data]}]}, AspectRatio -> 1/2, ImageSize -> 500, Frame -> True, Background -> background, FrameStyle -> White, ImagePadding -> {{30, 20}, {25, 20}}]](https://www.wolframcloud.com/obj/resourcesystem/images/ddd/ddde2ab7-b449-427d-a364-bf9251afa485/4-0-0/51c5ee7a9cd1c1d7.png)
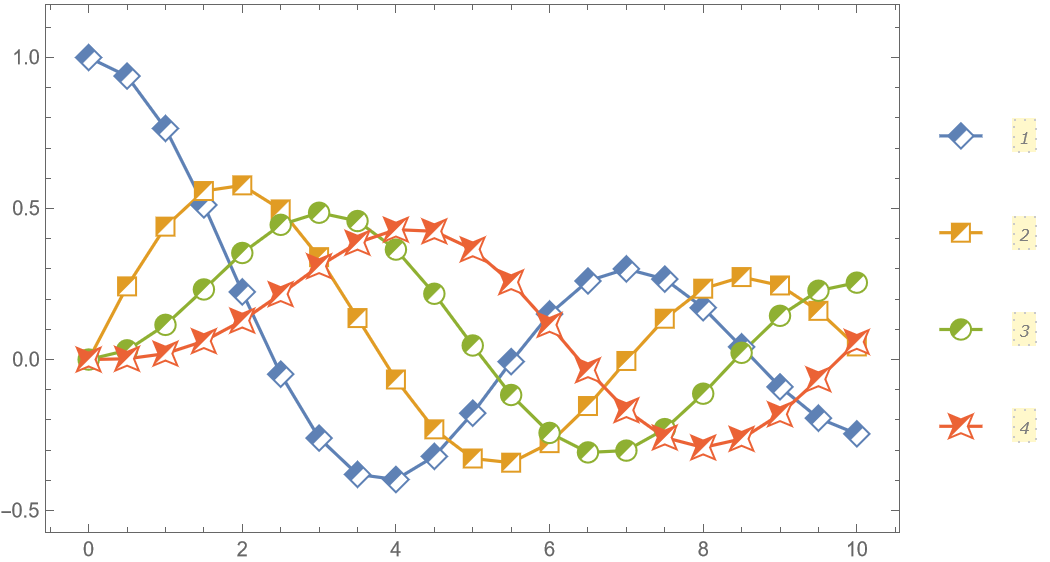
![cfm[name_String, size_ : 9] := Show[
ResourceFunction["PolygonMarker"][name, Offset@size, {
FaceForm[White],
Dynamic@
EdgeForm[{CurrentValue["Color"], AbsoluteThickness[1], Opacity[1]}]}],
ResourceFunction["PolygonMarker"][name, Offset[size/2], EdgeForm[None]]];
data = Table[{x, BesselJ[k, x]}, {k, 0, 2}, {x, 0, 10, 0.5}];
ListPlot[data, PlotMarkers -> cfm /@ {"UpTriangle", "Square", "Circle"}, Joined -> True, Frame -> True, Axes -> False, ImageSize -> 450, PlotRangePadding -> {Scaled[.05], Scaled[.1]}, PlotLegends -> PointLegend[Automatic, LegendMarkerSize -> {40, 30}], ImageSize -> 450]](https://www.wolframcloud.com/obj/resourcesystem/images/ddd/ddde2ab7-b449-427d-a364-bf9251afa485/4-0-0/263a04a0c3a2bf3a.png)
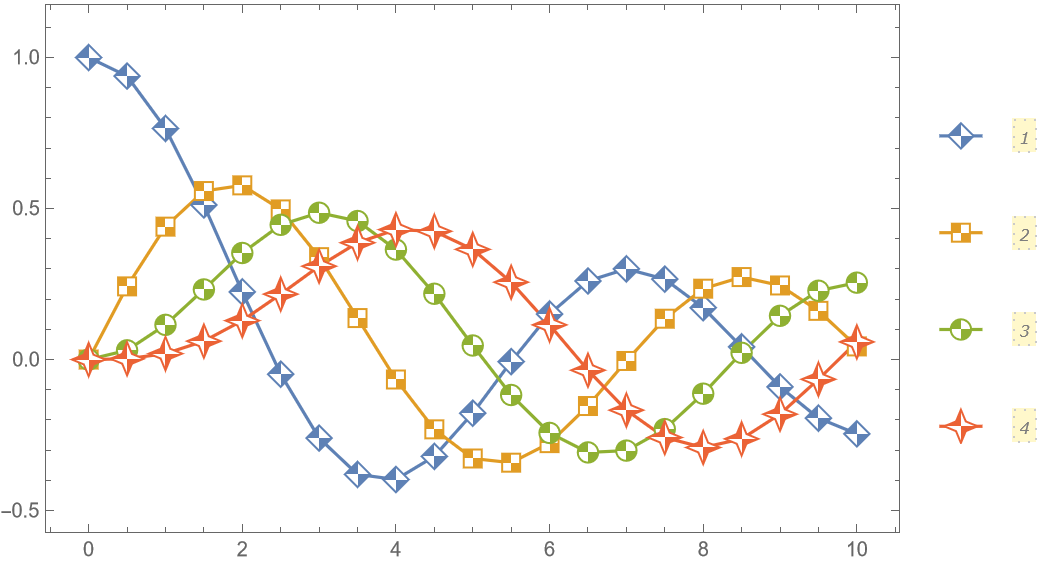
![hfm1[name_String, size_ : 9] := Show[
ResourceFunction["PolygonMarker"][name, Offset@size, {
FaceForm[White],
Dynamic@
EdgeForm[{CurrentValue["Color"], AbsoluteThickness[1], Opacity[1]}]}],
ResourceFunction["PolygonMarker"][name, Offset@size, EdgeForm[None]] /. {x_?Negative, y_?NumericQ} :> {0, y}];
data = Table[{x, BesselJ[k, x]}, {k, 0, 2}, {x, 0, 10, 0.5}];
ListPlot[data, PlotMarkers -> hfm1 /@ {"UpTriangle", "Square", "Circle"}, Joined -> True, Frame -> True, Axes -> False, ImageSize -> 450, PlotRangePadding -> {Scaled[.05], Scaled[.1]}, PlotLegends -> PointLegend[Automatic, LegendMarkerSize -> {40, 30}], ImageSize -> 450]](https://www.wolframcloud.com/obj/resourcesystem/images/ddd/ddde2ab7-b449-427d-a364-bf9251afa485/4-0-0/6906307d62ba7655.png)

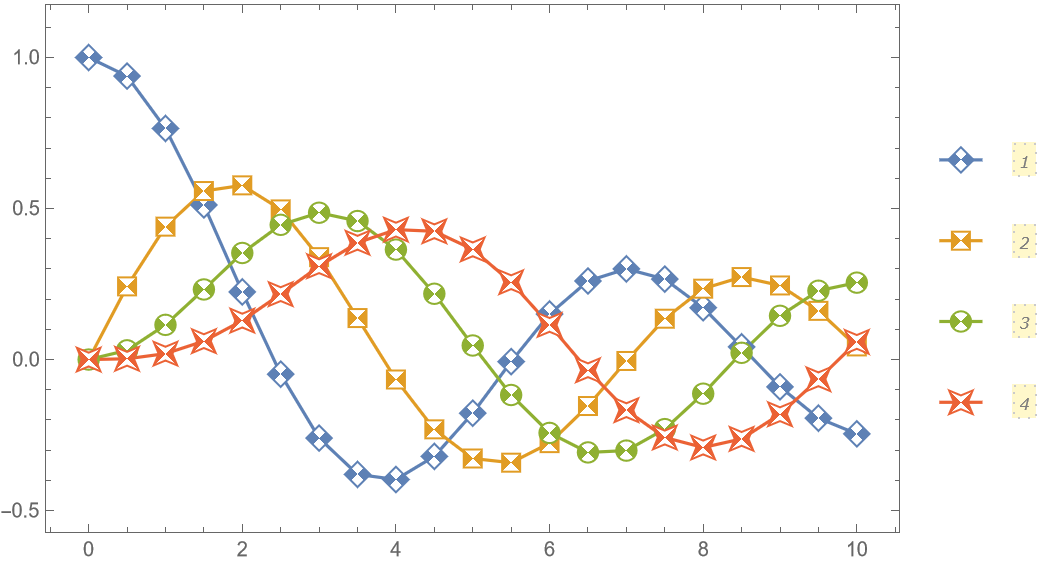
![hfm2[name_String, size_ : 9] := Show[
ResourceFunction["PolygonMarker"][name, Offset@size, {
FaceForm[White],
Dynamic@
EdgeForm[{CurrentValue["Color"], AbsoluteThickness[1], Opacity[1]}]}],
Graphics[{EdgeForm[None], Replace[RegionDifference[ResourceFunction["PolygonMarker"][name],
Rectangle[{-10, -10}, {10, 0}]], p : {x_, y_} :> Offset[size p, {0, 0}], {-2}]}]];
data = Table[{x, BesselJ[k, x]}, {k, 0, 3}, {x, 0, 10, 0.5}];
ListPlot[data, PlotMarkers -> hfm2 /@ {"Diamond", "Square", "Circle", "RightTriangle"}, Joined -> True, Frame -> True, Axes -> False, ImageSize -> 450, PlotRangePadding -> {Scaled[.05], Scaled[.1]}, PlotLegends -> PointLegend[Automatic, LegendMarkerSize -> {40, 30}], ImageSize -> 450]](https://www.wolframcloud.com/obj/resourcesystem/images/ddd/ddde2ab7-b449-427d-a364-bf9251afa485/4-0-0/1f49fcbd372abd23.png)
![hfm3[name_String, size_ : 9] := Show[
ResourceFunction["PolygonMarker"][name, Offset@size, {
FaceForm[White],
Dynamic@
EdgeForm[{CurrentValue["Color"], AbsoluteThickness[1], Opacity[1]}]}],
Graphics[{EdgeForm[None], Replace[RegionDifference[ResourceFunction["PolygonMarker"][name],
Triangle[{{-10, -10}, {10, 10}, {10, -10}}]], p : {x_, y_} :> Offset[size p, {0, 0}], {-2}]}]];
data = Table[{x, BesselJ[k, x]}, {k, 0, 3}, {x, 0, 10, 0.5}];
ListPlot[data, PlotMarkers -> hfm3 /@ {"Diamond", "Square", "Circle", "DiagonalFourPointedStar"}, Joined -> True, Frame -> True, Axes -> False, ImageSize -> 450, PlotRangePadding -> {Scaled[.05], Scaled[.1]}, PlotLegends -> PointLegend[Automatic, LegendMarkerSize -> {40, 38}], ImageSize -> 450]](https://www.wolframcloud.com/obj/resourcesystem/images/ddd/ddde2ab7-b449-427d-a364-bf9251afa485/4-0-0/1c2627af21963f9d.png)
![cfm1[name_String, size_ : 9] := Show[
ResourceFunction["PolygonMarker"][name, Offset@size, {
FaceForm[White],
Dynamic@
EdgeForm[{CurrentValue["Color"], AbsoluteThickness[1], Opacity[1]}]}],
Graphics[{EdgeForm[None], Replace[RegionDifference[
RegionDifference[ResourceFunction["PolygonMarker"][name], Rectangle[{0, 0}, {10, 10}]], Rectangle[{0, 0}, {-10, -10}]], p : {x_, y_} :> Offset[size p, {0, 0}], {-2}]}]];
data = Table[{x, BesselJ[k, x]}, {k, 0, 3}, {x, 0, 10, 0.5}];
ListPlot[data, PlotMarkers -> cfm1 /@ {"Diamond", "Square", "Circle", "FourPointedStar"}, Joined -> True, Frame -> True, Axes -> False, ImageSize -> 450, PlotRangePadding -> {Scaled[.05], Scaled[.1]}, PlotLegends -> PointLegend[Automatic, LegendMarkerSize -> {40, 38}], ImageSize -> 450]](https://www.wolframcloud.com/obj/resourcesystem/images/ddd/ddde2ab7-b449-427d-a364-bf9251afa485/4-0-0/79ead46b7eeacf89.png)
![cfm2[name_String, size_ : 9] := Show[
ResourceFunction["PolygonMarker"][name, Offset@size, {
FaceForm[White],
Dynamic@
EdgeForm[{CurrentValue["Color"], AbsoluteThickness[1], Opacity[1]}]}],
Graphics[{EdgeForm[None], Replace[RegionDifference[
RegionDifference[ResourceFunction["PolygonMarker"][name], Triangle[{{-10, 10}, {10, 10}, {0, 0}}]], Triangle[{{-10, -10}, {10, -10}, {0, 0}}]], p : {x_, y_} :> Offset[size p, {0, 0}], {-2}]}]];
data = Table[{x, BesselJ[k, x]}, {k, 0, 3}, {x, 0, 10, 0.5}];
ListPlot[data, PlotMarkers -> cfm2 /@ {"Diamond", "Square", "Circle", "DiagonalFourPointedStar"}, Joined -> True, Frame -> True, Axes -> False, ImageSize -> 450, PlotRangePadding -> {Scaled[.05], Scaled[.1]}, PlotLegends -> PointLegend[Automatic, LegendMarkerSize -> {40, 30}], ImageSize -> 450]](https://www.wolframcloud.com/obj/resourcesystem/images/ddd/ddde2ab7-b449-427d-a364-bf9251afa485/4-0-0/098072d30c4d2367.png)
![pts[l_String] := First[Cases[
ImportString[
ExportString[Style[l, FontFamily -> "Verdana", FontSize -> 20], "PDF"], If[$VersionNumber >= 12.2, {"PDF", "PageGraphics"}, {"PDF", "Pages"}]], c_FilledCurve :> c[[2, 1]], Infinity]];](https://www.wolframcloud.com/obj/resourcesystem/images/ddd/ddde2ab7-b449-427d-a364-bf9251afa485/4-0-0/353b9cd1877731a2.png)
![(* Evaluate this cell to get the example input *) CloudGet["https://www.wolframcloud.com/obj/de10f0e3-b786-47a4-935d-d348838da080"]](https://www.wolframcloud.com/obj/resourcesystem/images/ddd/ddde2ab7-b449-427d-a364-bf9251afa485/4-0-0/05b65b4b0893a706.png)
![(* Evaluate this cell to get the example input *) CloudGet["https://www.wolframcloud.com/obj/95e4c2e0-e0a8-487a-a62c-24ae3af4658f"]](https://www.wolframcloud.com/obj/resourcesystem/images/ddd/ddde2ab7-b449-427d-a364-bf9251afa485/4-0-0/0fbc8f223bd453f0.png)

![(* Evaluate this cell to get the example input *) CloudGet["https://www.wolframcloud.com/obj/2a61e0d6-4905-4032-8c8e-2e3af25edf09"]](https://www.wolframcloud.com/obj/resourcesystem/images/ddd/ddde2ab7-b449-427d-a364-bf9251afa485/4-0-0/76059d9b06dd5bcc.png)