Wolfram Function Repository
Instant-use add-on functions for the Wolfram Language
Function Repository Resource:
Query Reactome for pathway overrepresentation and expression analysis
ResourceFunction["ReactomeEnrichmentAnalysis"][data] returns a dataset of enriched Reactome pathways based on the data analysis. | |
ResourceFunction["ReactomeEnrichmentAnalysis"][data,"Summary"] returns a summary result of enriched Reactome pathways based on the data analysis. | |
ResourceFunction["ReactomeEnrichmentAnalysis"][token,"Result"] returns a dataset of enriched Reactome pathways based on the token associated with the previously queried data. |
| "Interactors" | False | whether to include all available protein-protein interactors for the analysis |
| "Species" | All | species used to filter the results; NCBI Taxonomy identifier, species name, or Reactome database identifiers can be used; see the list of species for the Reactome database |
| "PageSize" | 20 | pathways per page |
| "Page" | 1 | page number |
| "SortBy" | "ENTITIES_PVALUE" | property used to sort the results; allowed values include: "ENTITIES_PVALUE", "NAME", "TOTAL_ENTITIES", "TOTAL_INTERACTORS", "TOTAL_REACTIONS", "FOUND_ENTITIES", "FOUND_INTERACTORS", "FOUND_REACTIONS", "ENTITIES_RATIO", "ENTITIES_FDR", "REACTIONS_RATIO" |
| "Order" | "ASC" | "ASC" (ascending) or "DESC" (descending) order to sort the results |
| "Resource" | "TOTAL" | resource used to filter the results; allowed values include: "TOTAL", "UNIPROT", "ENSEMBL", "CHEBI", "IUPHAR", "MIRBASE", "NCBI_PROTEIN", "EMBL", "COMPOUND", "ENTITIES_FDR", "PUBCHEM_COMPOUND" |
| "PValue" | 1 | p-value threshold; results with p-value equal to or less than the supplied threshold will be returned |
| "IncludeDisease" | True | whether the disease pathways be included in the results |
| "Min" | None | minimum number of entities that a pathways should have to be included in the results |
| "Max" | None | maximum number of entities that a pathways should have to be included in the results |
| "ImportableOnly" | False | whether to include only importable resources |
| "HumanProjection" | False | for identifiers of different species, whether to project the results to Homo Sapiens |
| "Header" | False | whether to treat a first item in the data list as a header |
Find overrepresented pathways for the list of genes:
| In[1]:= |
| Out[1]= | 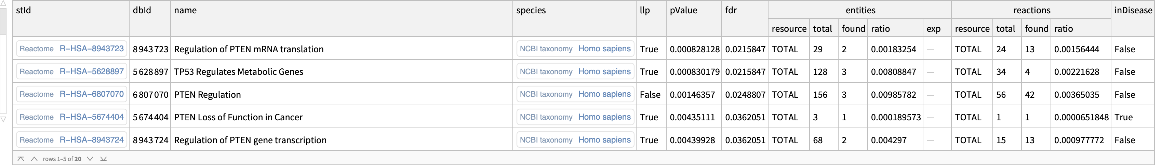 |
Define a sample dataset of Ensembl genes and their expression levels:
| In[2]:= |
| Out[2]= | 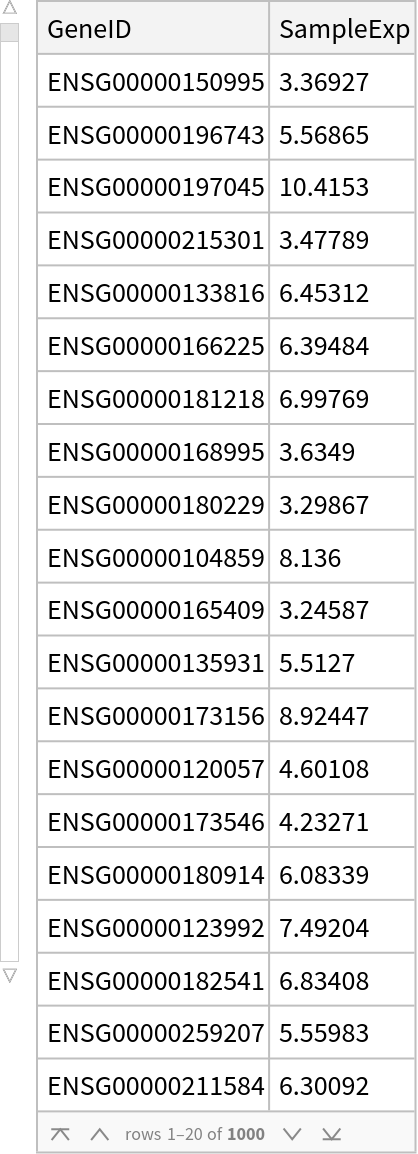 |
Get a summary result:
| In[3]:= |
| Out[3]= | 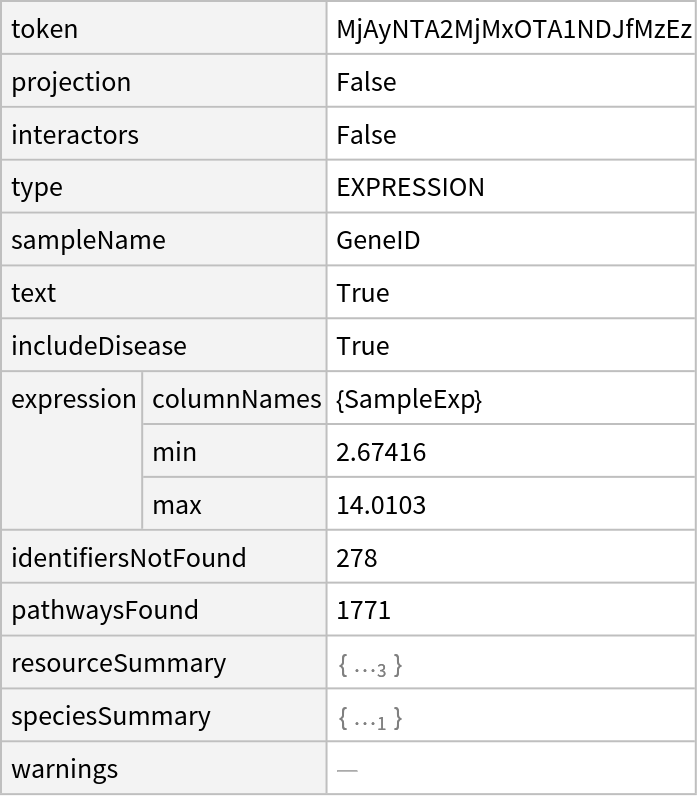 |
Retrieve a dataset of enriched Reactome pathways:
| In[4]:= |
| Out[4]= | 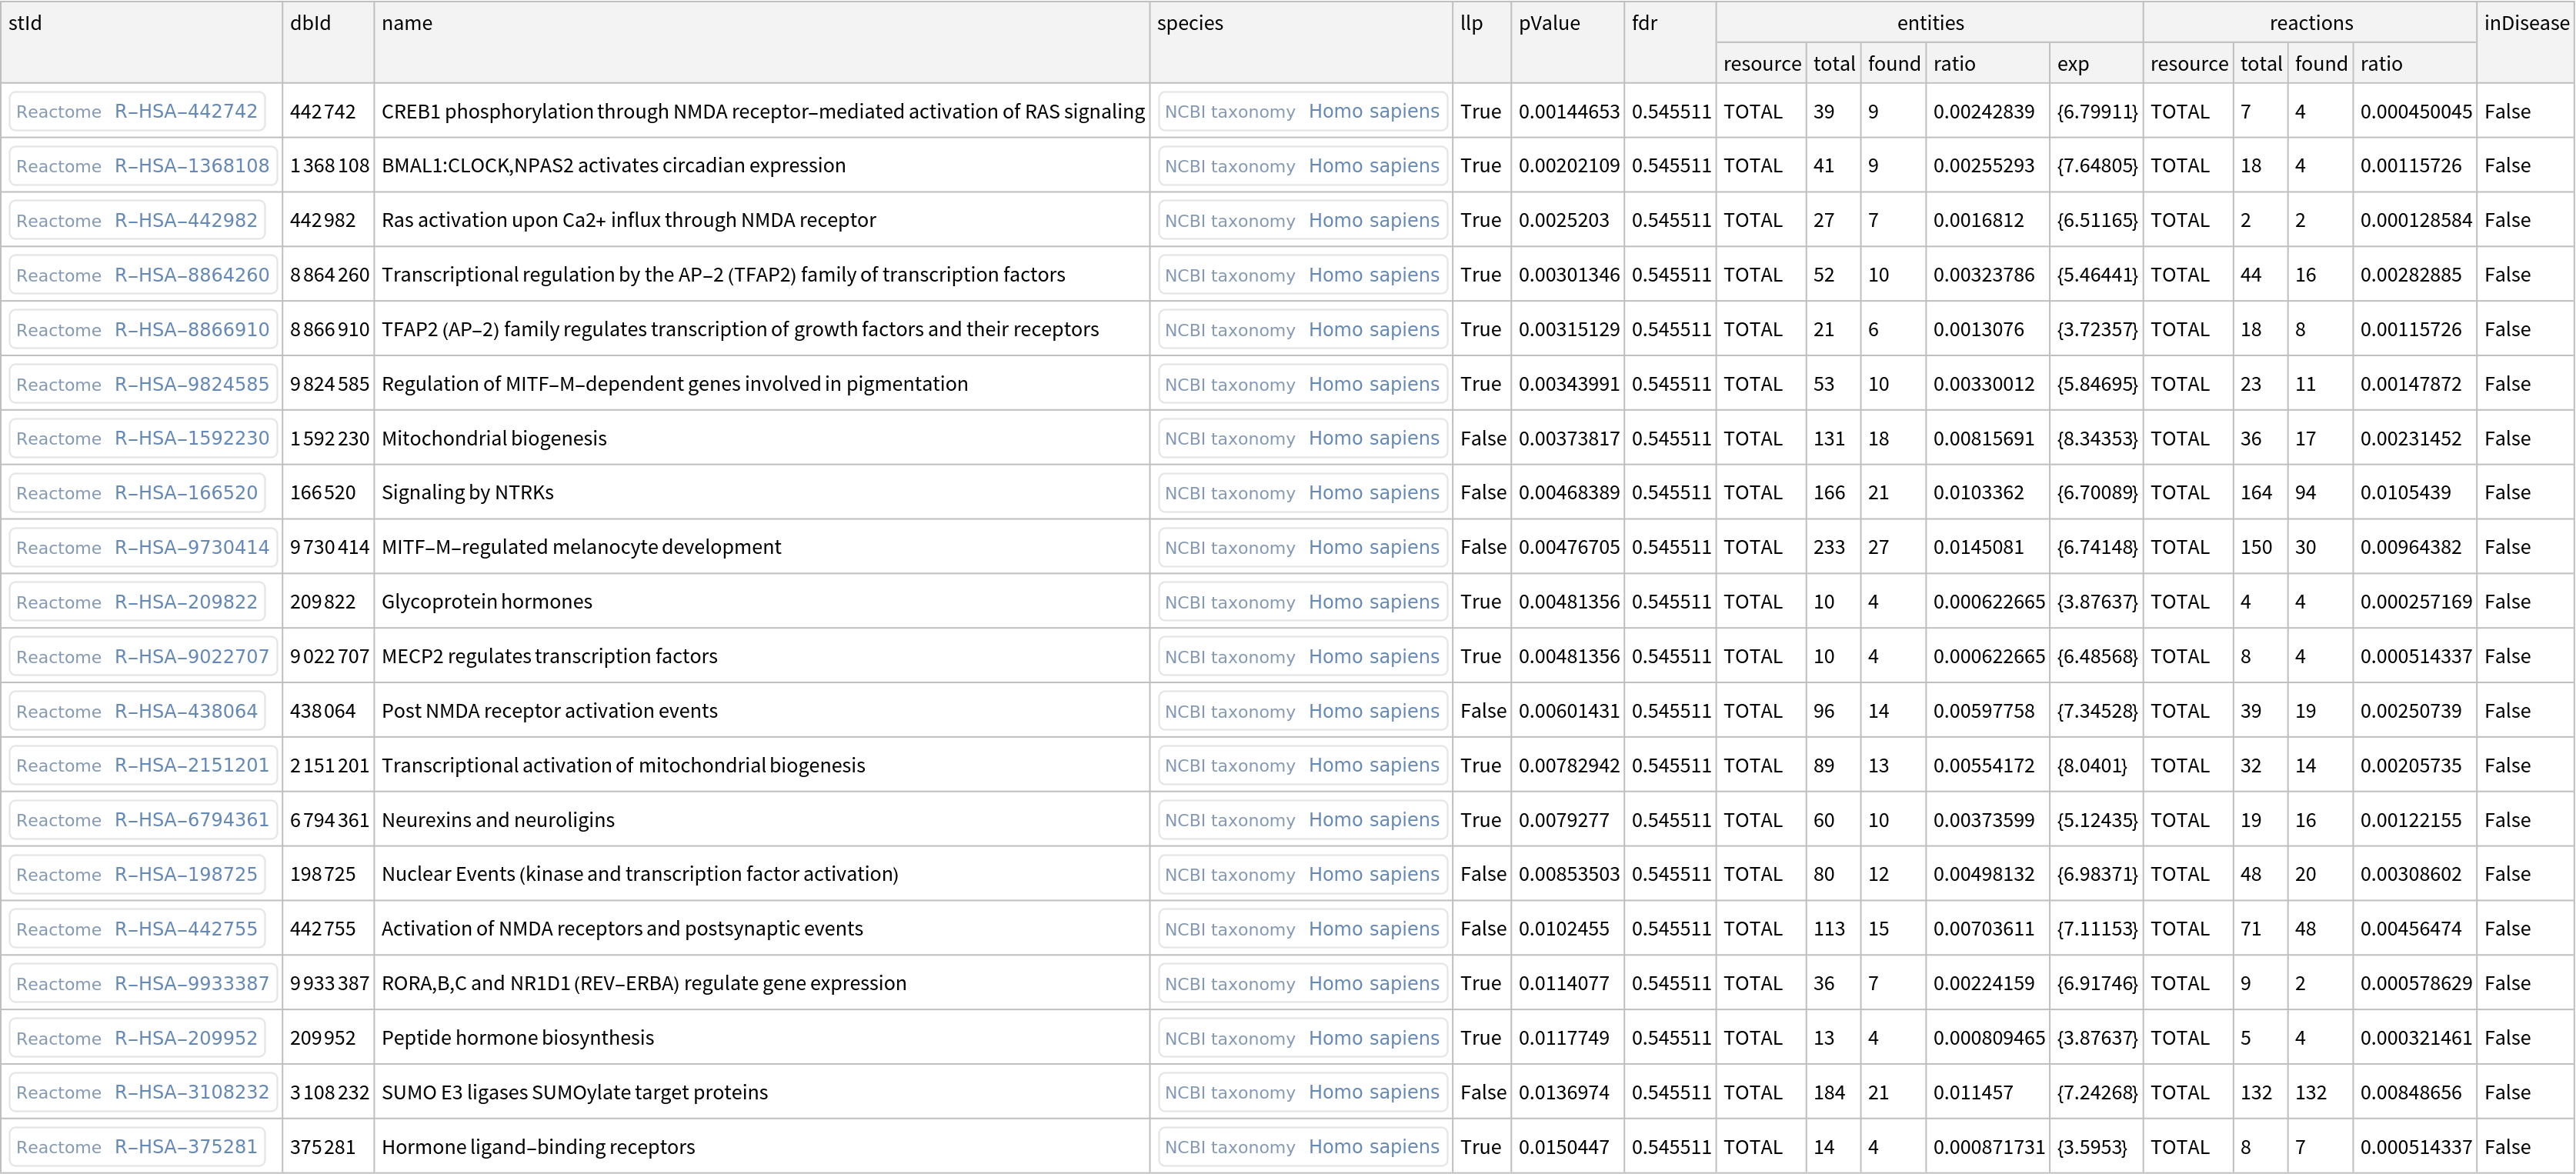 |
Use a token from the analysis in the ResourceFunction["ReactomePathway"] to retrieve results overlaid on a selected pathway:
| In[5]:= |
| Out[5]= | 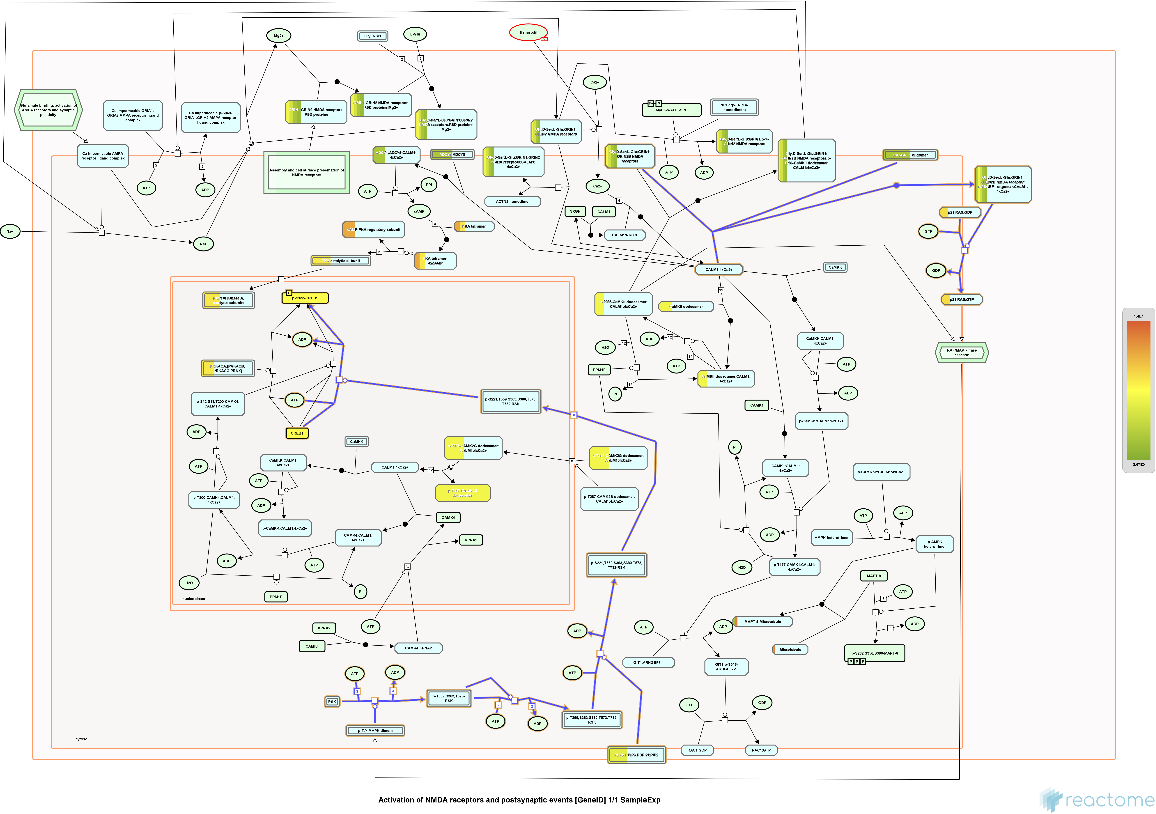 |
Find overrepresented pathways for the list of mouse genes:
| In[6]:= | ![mussum = ResourceFunction[
"ReactomeEnrichmentAnalysis"][{"ENSMUSG00000030660", "ENSMUSG00000021326", "ENSMUSG00000013663", "ENSMUST00000077925"}, "Summary"]](https://www.wolframcloud.com/obj/resourcesystem/images/c07/c0789a98-fcd0-4836-a93d-8f0350cdb3a7/64a4ad2ed175b62e.png) |
| Out[6]= | 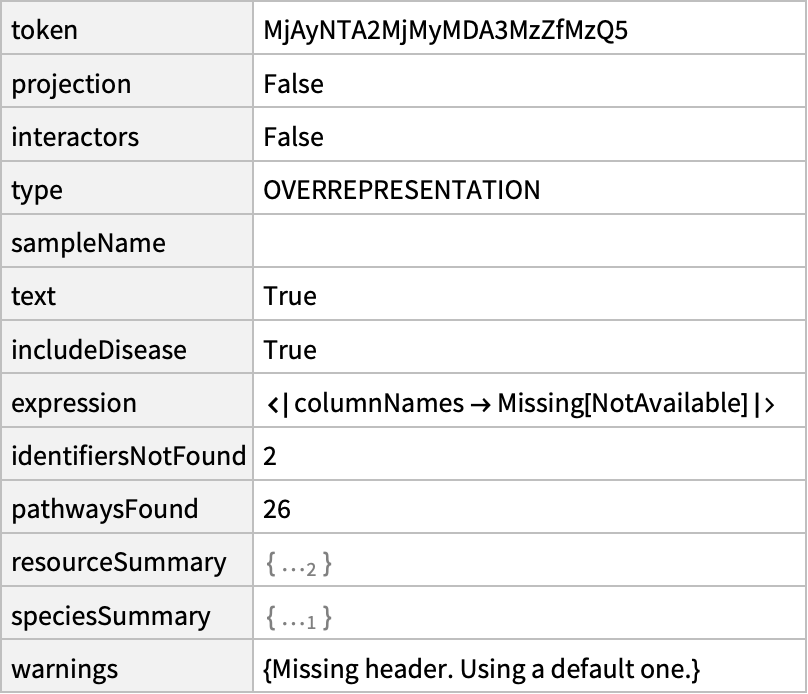 |
Use a token from the analysis and get the details on the enriched pathways:
| In[7]:= |
| Out[7]= | 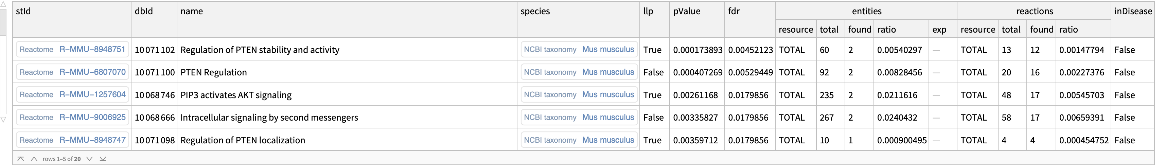 |
Use a token from the analysis to highlight overrepresentation results on a selected human pathway:
| In[8]:= | ![Manipulate[
Show[ResourceFunction["ReactomePathways"][
muspath[path, 1]["ExternalID"], "Image", "Token" -> mussum["token"],
"DiagramProfile" -> "Standard", "AnalysisProfile" -> "Strosobar"],
ImageSize -> 600], {path, 1, 10, 1}, ControlType -> Setter]](https://www.wolframcloud.com/obj/resourcesystem/images/c07/c0789a98-fcd0-4836-a93d-8f0350cdb3a7/6d8d4f99770f8789.png) |
| Out[8]= | 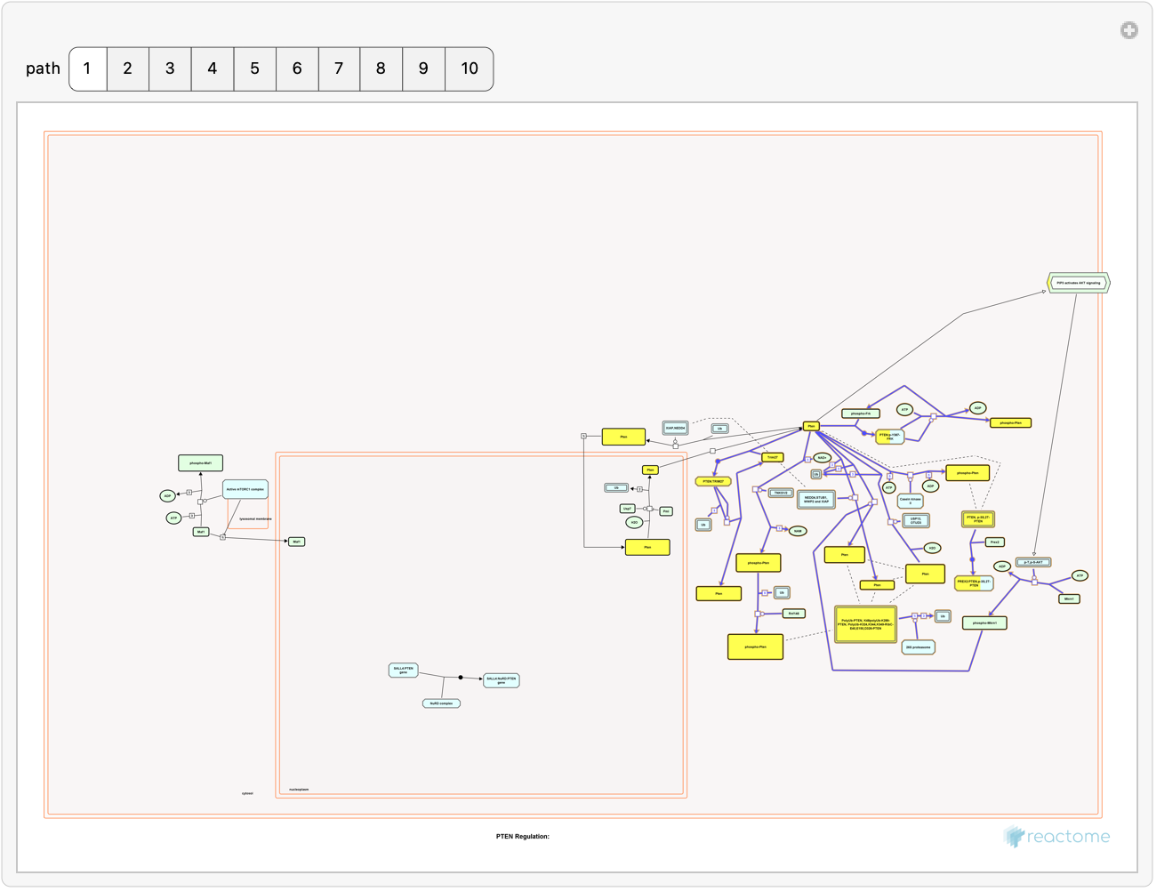 |
Find enriched Reactome pathways including interactors:
| In[9]:= | ![ResourceFunction[
"ReactomeEnrichmentAnalysis"][{"SNX4", "A2M", "SICO1B3", "SICO1A2", "STARD3", "ALOXE3", "SMARCA2", "CYP19A1", "TPI1", "SNRK"}, "Interactors" -> True]](https://www.wolframcloud.com/obj/resourcesystem/images/c07/c0789a98-fcd0-4836-a93d-8f0350cdb3a7/7fb12dd3676de2bc.png) |
| Out[9]= |  |
Find enriched Reactome pathways for dogs:
| In[10]:= | ![ResourceFunction[
"ReactomeEnrichmentAnalysis"][{"SNX4", "A2M", "SICO1B3", "SICO1A2", "STARD3", "ALOXE3", "SMARCA2", "CYP19A1", "TPI1", "SNRK"}, "Species" -> "Canis lupus familiaris"]](https://www.wolframcloud.com/obj/resourcesystem/images/c07/c0789a98-fcd0-4836-a93d-8f0350cdb3a7/032547488a813294.png) |
| Out[10]= | 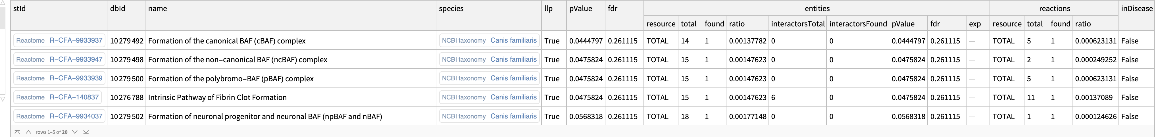 |
Set the size of the enrichment analysis output to five:
| In[11]:= | ![ResourceFunction[
"ReactomeEnrichmentAnalysis"][{"SNX4", "A2M", "SICO1B3", "SICO1A2", "STARD3", "ALOXE3", "SMARCA2", "CYP19A1", "TPI1", "SNRK"}, "PageSize" -> 5]](https://www.wolframcloud.com/obj/resourcesystem/images/c07/c0789a98-fcd0-4836-a93d-8f0350cdb3a7/635f6521796d7771.png) |
| Out[11]= | 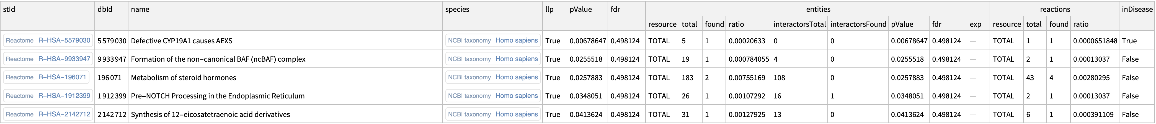 |
Show the second set of results from the enrichment analysis:
| In[12]:= | ![ResourceFunction[
"ReactomeEnrichmentAnalysis"][{"SNX4", "A2M", "SICO1B3", "SICO1A2", "STARD3", "ALOXE3", "SMARCA2", "CYP19A1", "TPI1", "SNRK"}, "Page" -> 2]](https://www.wolframcloud.com/obj/resourcesystem/images/c07/c0789a98-fcd0-4836-a93d-8f0350cdb3a7/3cac0ef16ab412cc.png) |
| Out[12]= | 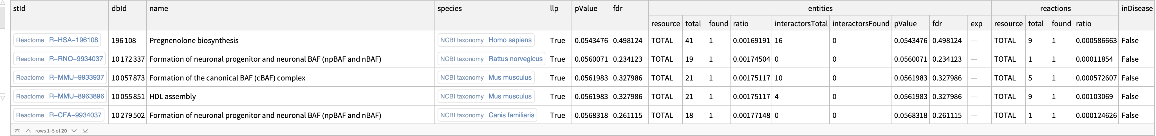 |
Sort the results of the enrichment analysis by the name of a pathway:
| In[13]:= | ![ResourceFunction[
"ReactomeEnrichmentAnalysis"][{"SNX4", "A2M", "SICO1B3", "SICO1A2", "STARD3", "ALOXE3", "SMARCA2", "CYP19A1", "TPI1", "SNRK"}, "SortBy" -> "NAME"]](https://www.wolframcloud.com/obj/resourcesystem/images/c07/c0789a98-fcd0-4836-a93d-8f0350cdb3a7/719d6ce509a85b2d.png) |
| Out[13]= | 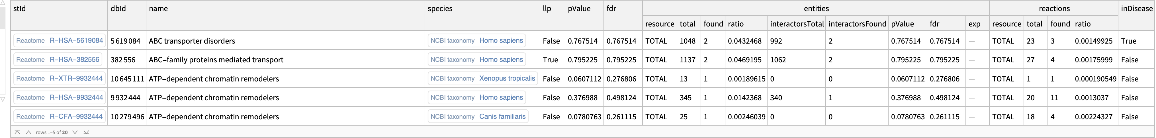 |
Sort the enrichment analysis results by pathway name in descending order:
| In[14]:= | ![ResourceFunction[
"ReactomeEnrichmentAnalysis"][{"SNX4", "A2M", "SICO1B3", "SICO1A2", "STARD3", "ALOXE3", "SMARCA2", "CYP19A1", "TPI1", "SNRK"}, "SortBy" -> "NAME", "Order" -> "DESC"]](https://www.wolframcloud.com/obj/resourcesystem/images/c07/c0789a98-fcd0-4836-a93d-8f0350cdb3a7/743c60d81223a7c7.png) |
| Out[14]= | 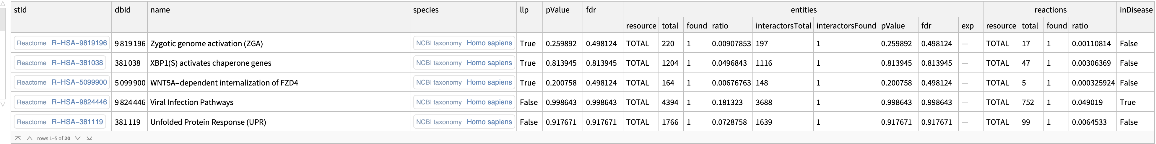 |
Find enriched Reactome pathways based on the UniProt:
| In[15]:= | ![ResourceFunction[
"ReactomeEnrichmentAnalysis"][{"SNX4", "A2M", "SICO1B3", "SICO1A2", "STARD3", "ALOXE3", "SMARCA2", "CYP19A1", "TPI1", "SNRK"}, "Resource" -> "UNIPROT"]](https://www.wolframcloud.com/obj/resourcesystem/images/c07/c0789a98-fcd0-4836-a93d-8f0350cdb3a7/6952269118dc364b.png) |
| Out[15]= | 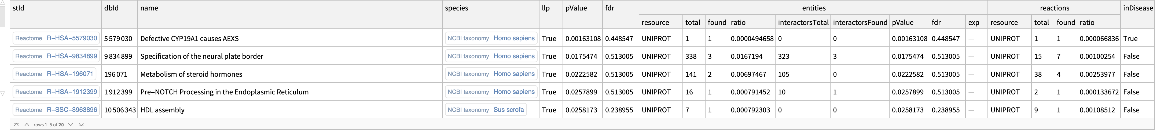 |
Find enriched Reactome pathways with a p-value of 0.05 or less:
| In[16]:= | ![ResourceFunction[
"ReactomeEnrichmentAnalysis"][{"SNX4", "A2M", "SICO1B3", "SICO1A2", "STARD3", "ALOXE3", "SMARCA2", "CYP19A1", "TPI1", "SNRK"}, "PValue" -> 0.05]](https://www.wolframcloud.com/obj/resourcesystem/images/c07/c0789a98-fcd0-4836-a93d-8f0350cdb3a7/6b6942eeb63d8b32.png) |
| Out[16]= | 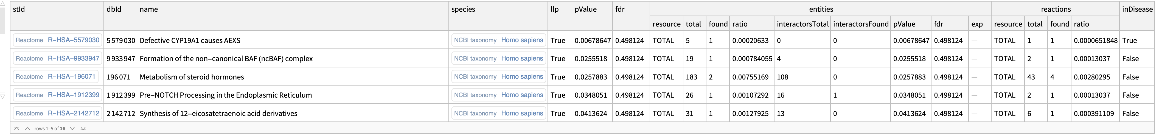 |
Find enriched Reactome pathways, excluding disease-related pathways:
| In[17]:= | ![ResourceFunction[
"ReactomeEnrichmentAnalysis"][{"SNX4", "A2M", "SICO1B3", "SICO1A2", "STARD3", "ALOXE3", "SMARCA2", "CYP19A1", "TPI1", "SNRK"}, "IncludeDisease" -> False]](https://www.wolframcloud.com/obj/resourcesystem/images/c07/c0789a98-fcd0-4836-a93d-8f0350cdb3a7/2ab36647d5eb821f.png) |
| Out[17]= | 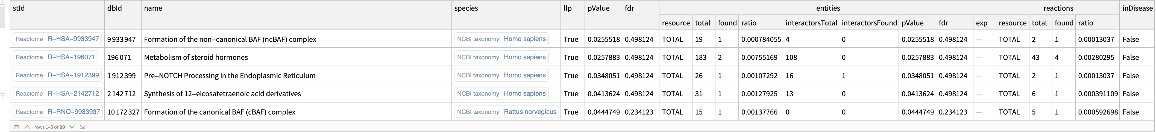 |
Set minimum and maximum numbers of contained entities per identified pathway:
| In[18]:= | ![ResourceFunction[
"ReactomeEnrichmentAnalysis"][{"SNX4", "A2M", "SICO1B3", "SICO1A2", "STARD3", "ALOXE3", "SMARCA2", "CYP19A1", "TPI1", "SNRK"}, "Min" -> 5, "Max" -> 10]](https://www.wolframcloud.com/obj/resourcesystem/images/c07/c0789a98-fcd0-4836-a93d-8f0350cdb3a7/204c2c0b1a072ee2.png) |
| Out[18]= |
Find enriched Reactome pathways, filtering for resources that are importable:
| In[19]:= | ![ResourceFunction[
"ReactomeEnrichmentAnalysis"][{"ENSCAFG00845024647", "ENSCAFG00845016387", "ENSCAFG00845000279"}, "ImportableOnly" -> True]](https://www.wolframcloud.com/obj/resourcesystem/images/c07/c0789a98-fcd0-4836-a93d-8f0350cdb3a7/0d804a8ecb617dd2.png) |
| Out[19]= | 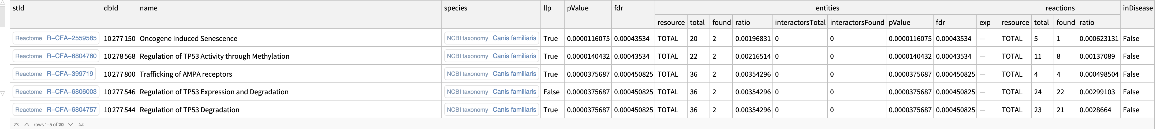 |
Project canine gene data to orthologous enriched pathways in humans:
| In[20]:= | ![ResourceFunction[
"ReactomeEnrichmentAnalysis"][{"ENSCAFG00845024647", "ENSCAFG00845016387", "ENSCAFG00845000279"}, "HumanProjection" -> True]](https://www.wolframcloud.com/obj/resourcesystem/images/c07/c0789a98-fcd0-4836-a93d-8f0350cdb3a7/25eaa8d794f7fd46.png) |
| Out[20]= | 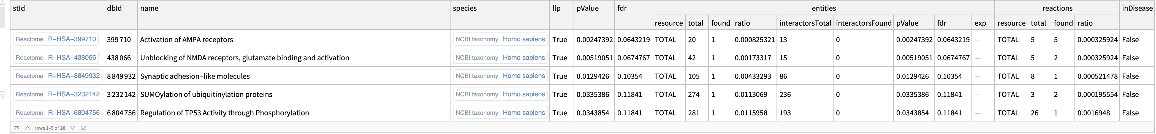 |
Treat the first row of the plain text data as a header:
| In[21]:= |
| Out[21]= | 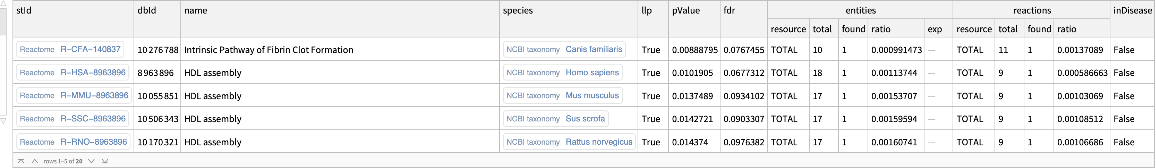 |
Wolfram Language 14.0 (January 2024) or above
This work is licensed under a Creative Commons Attribution 4.0 International License