Basic Examples (8)
Find the discontinuities and plot a function:
Explicitly give the discontinuity:
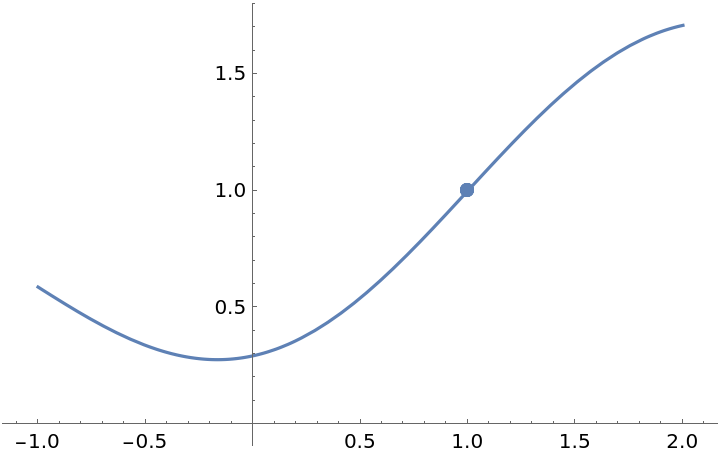
Plot a function with a removable discontinuity:
Explicitly give the discontinuity:
Remove the discontinuity:
Remove the discontinuity but show the break point:
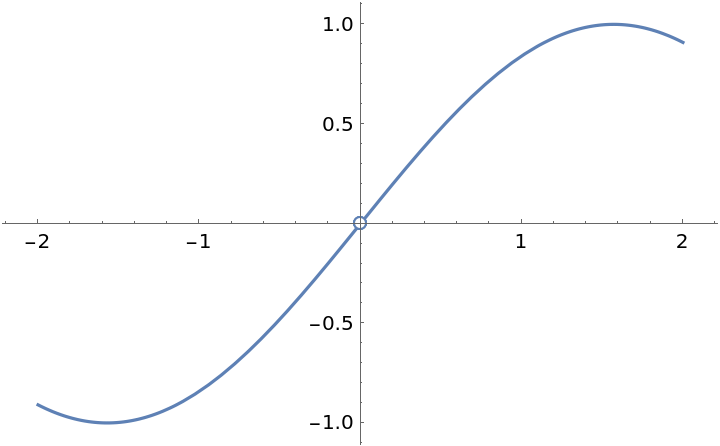
Plot a function with an asymptote at x=-1, a horizontal asymptote at y=0, a jump discontinuity at x=2, and a removable discontinuity at x=3:
"FindAsymptote" misses the horizontal asymptote at y=0:
An example from the resource function FunctionDiscontinuities:
Plot the result using the Plot command and the option ExclusionsStyle:
Use EnhancedPlot to obtain a much better plot:
It is not necessary to call on the resource function Asymptotes to find the vertical asymptotes of the following function since they are among the discontinuities found by the resource function FunctionDiscontinuities:
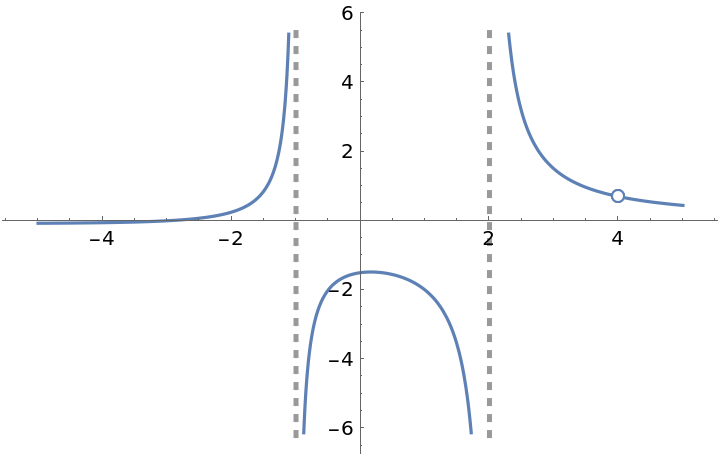
Plot a function with asymptotes and a removable discontinuity:
Remove the singularity by appropriately defining the function at x=3 so that f(3)=limn→3f(x):
Explicitly list the jump point and add the asymptotes manually:
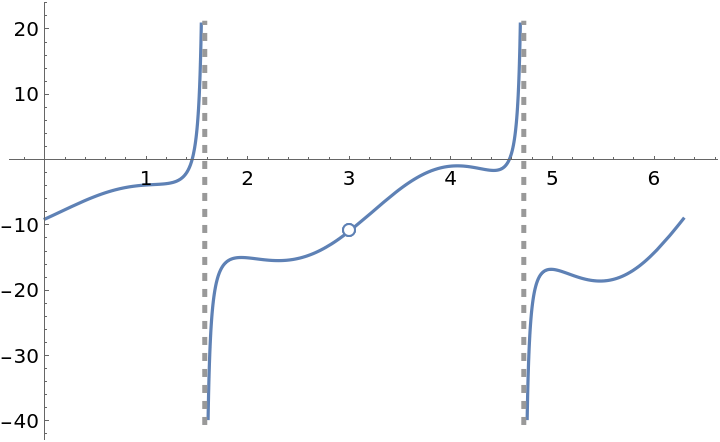
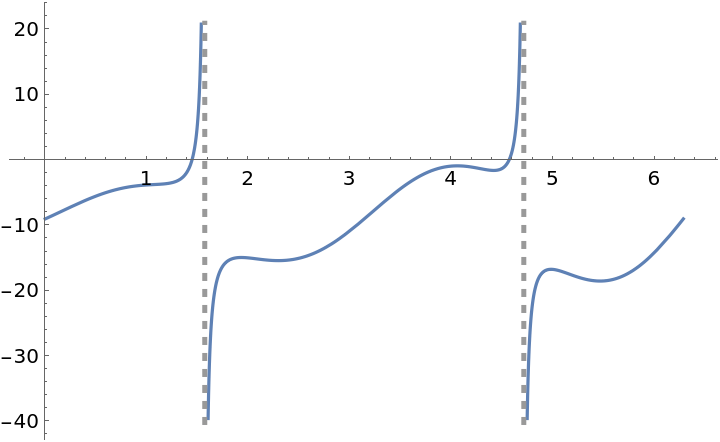
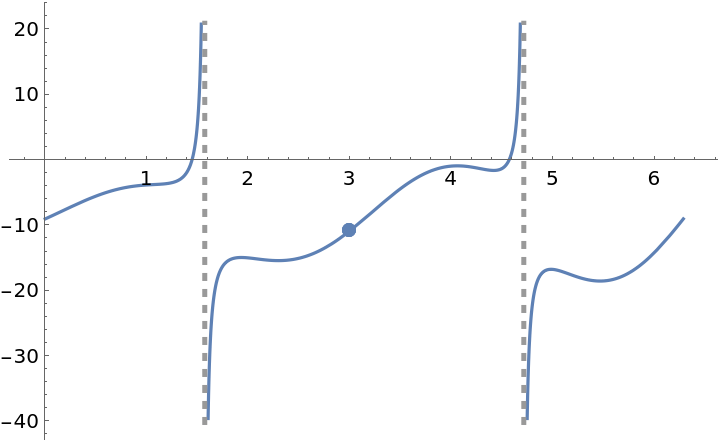
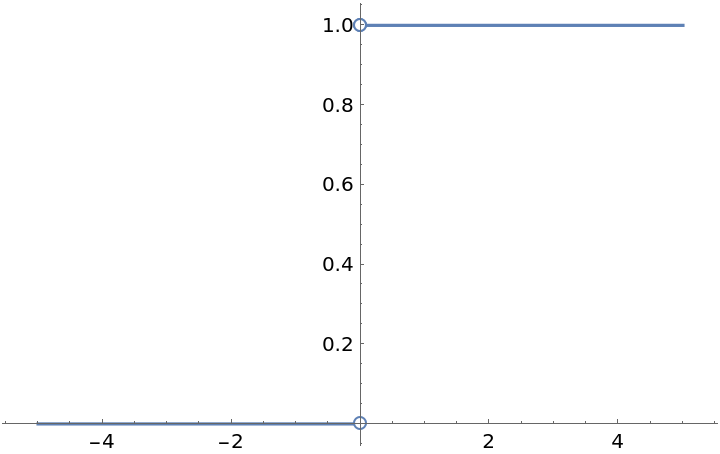
Plot a function with a jump discontinuity:
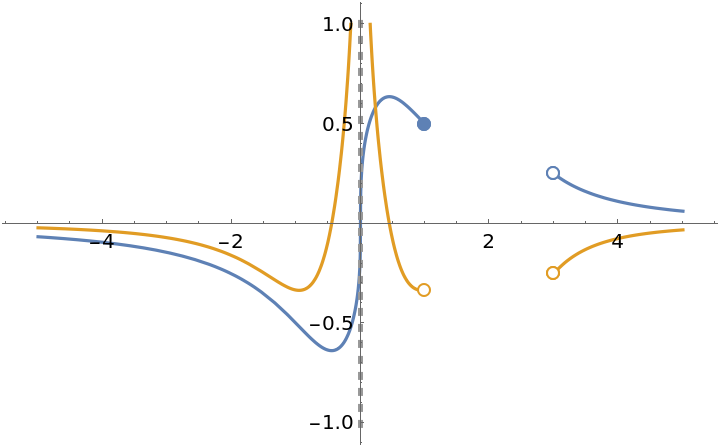
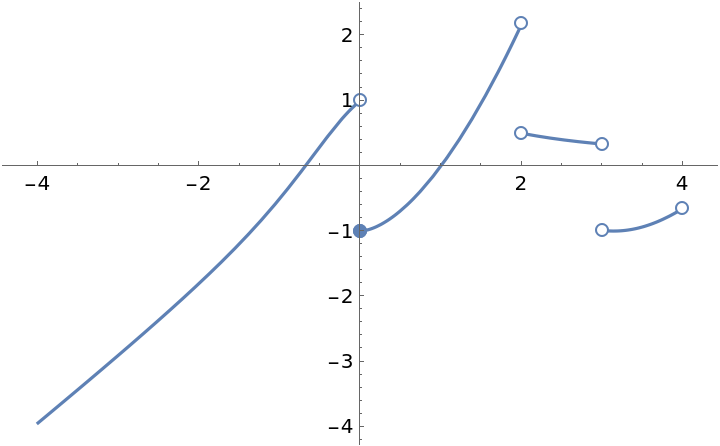
A function with an odd root over a domain consisting of two disjoint intervals with one interval containing negative numbers. Plot the function and its derivative:
Options (17)
Asymptote and AsymptoteStyle (1)
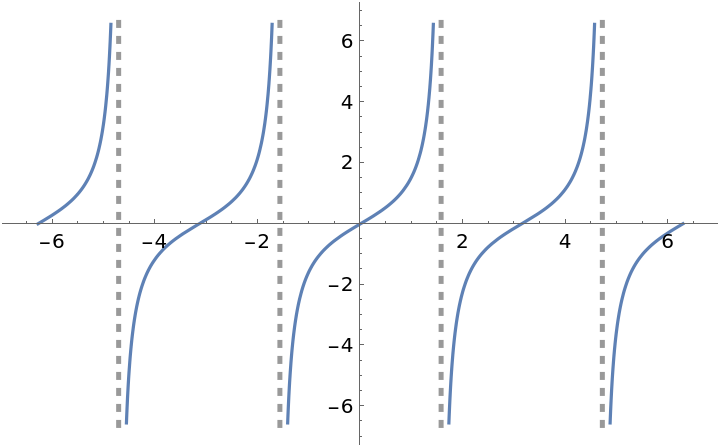
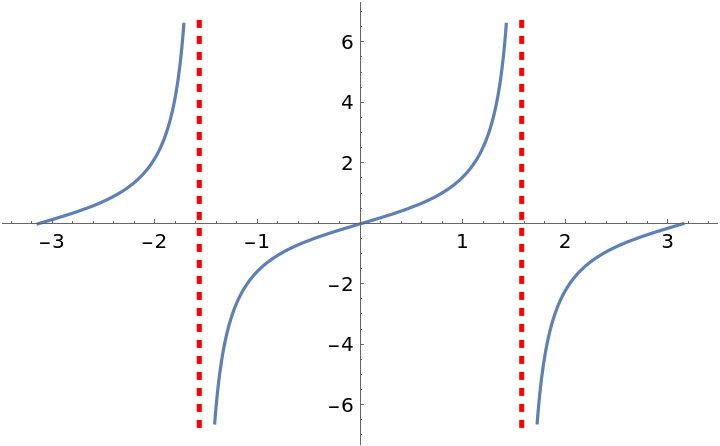
Plot a function with two vertical asymptotes and apply a style to the asymptotes:
DrawPoint and DrawPointStyle (2)
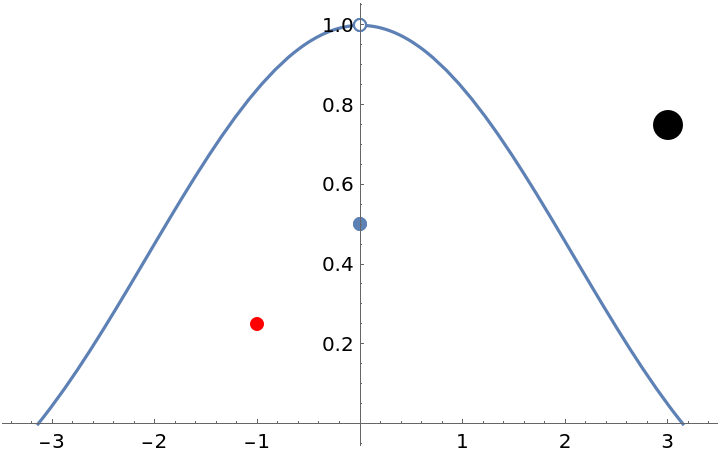
Plot a curve with a removable discontinuity and two points drawn off the curve:
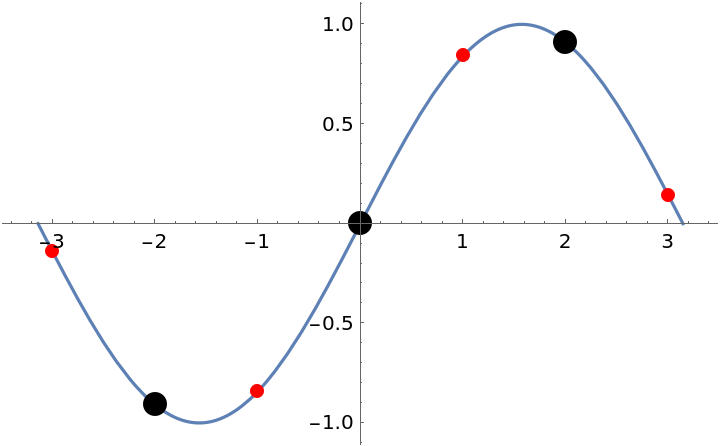
Plot a curve with a removable discontinuity and several points drawn on the curve:
Exception (1)
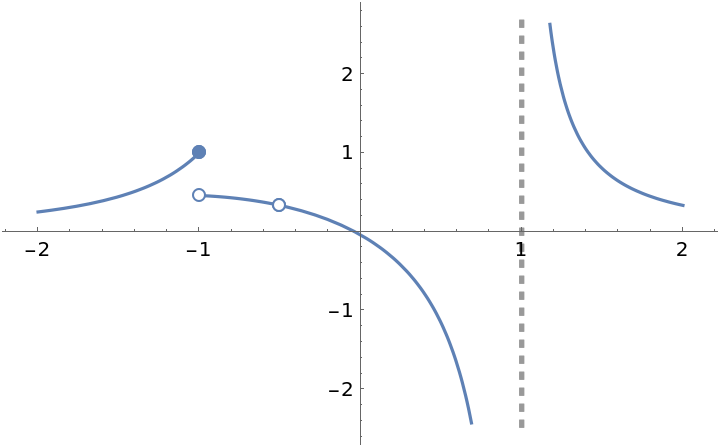
Create plot with several exceptions; a removable discontinuity (at x=-1/2), a jump discontinuity (at x=-1) and an infinite discontinuity (at x=1):
FindAsymptotes (2)
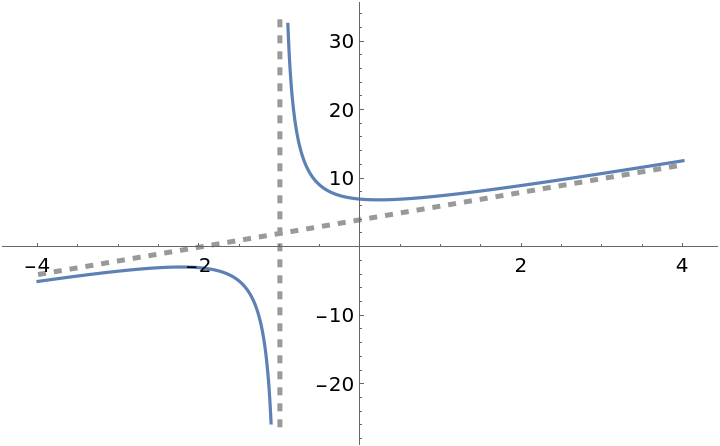
Setting "FindAsymptotes"→True uses the resource function Asymptotes to find the asymptotes (one vertical and one oblique) of the following function:
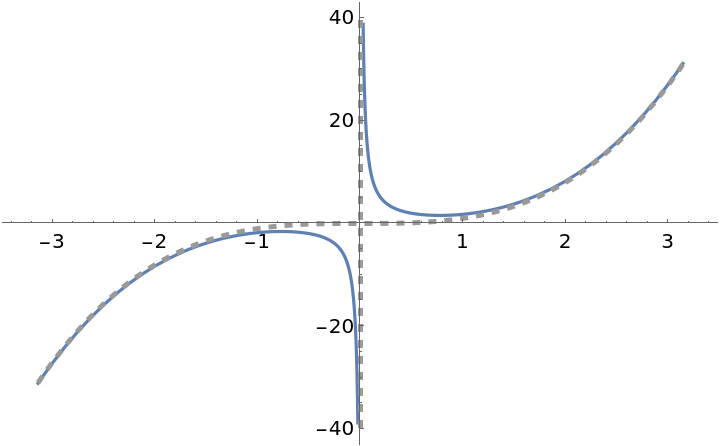
Plot a function with asymptotes (vertical and other):
FindExceptions (3)
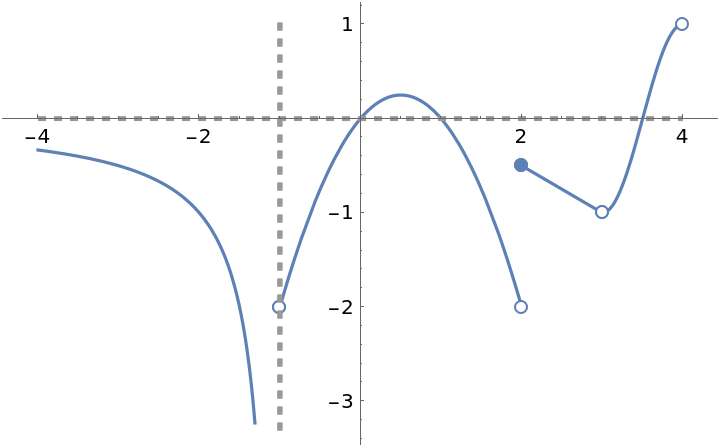
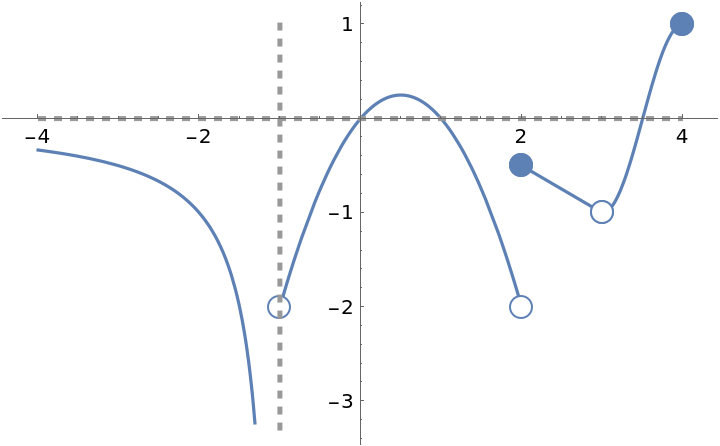
Setting "FindExceptions"→True uses the resource function FunctionDiscontinuities to find the discontinuities:
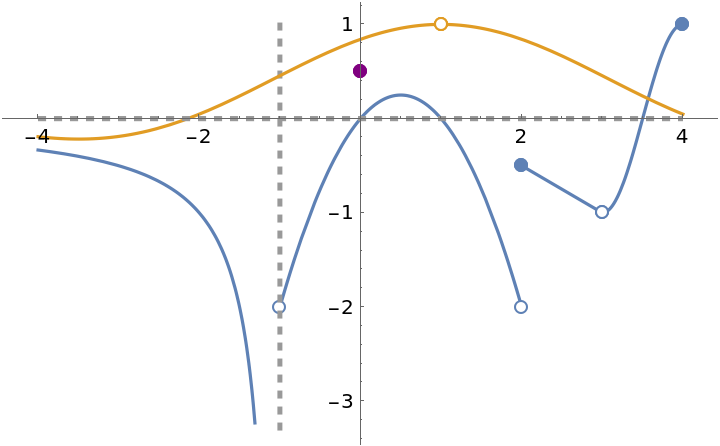
Plot two functions:
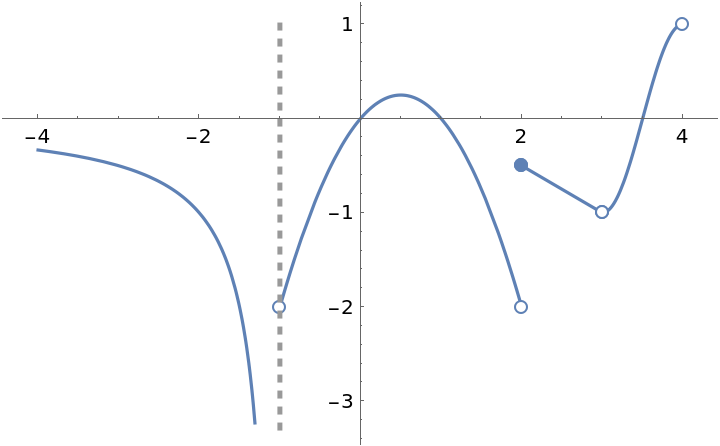
If a point is listed as an exception but isn’t an exception, then a solid point is plotted on the graph:
HorizontalAsymptote and HorizontalAsymptoteStyle (1)
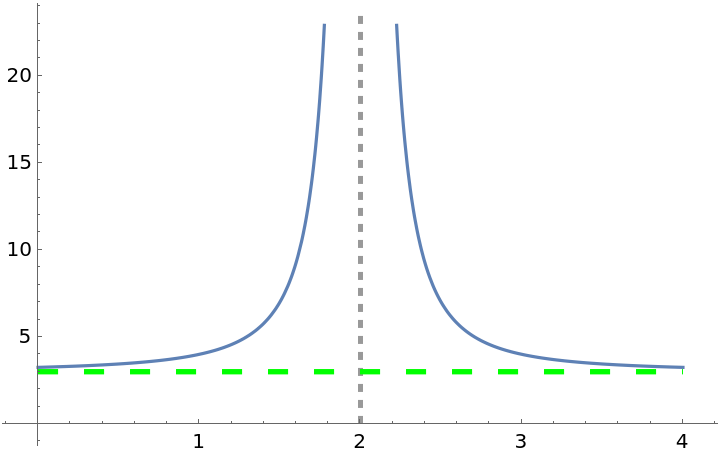
Plot a function with its horizontal asymptote:
PointStyle (1)
Make the points bigger:
PowerBehavior (1)
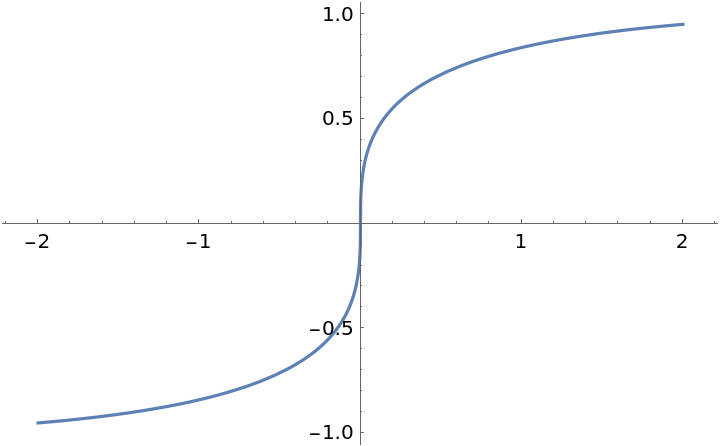
By default, the Wolfram Language returns the principal root of a number. If the number is real and negative and the root is odd, then the principal root is an imaginary number. Setting "PowerBehavior" to Real (the default) will force EnhancedPlot to plot the positive root:
ZeroToNull (5)
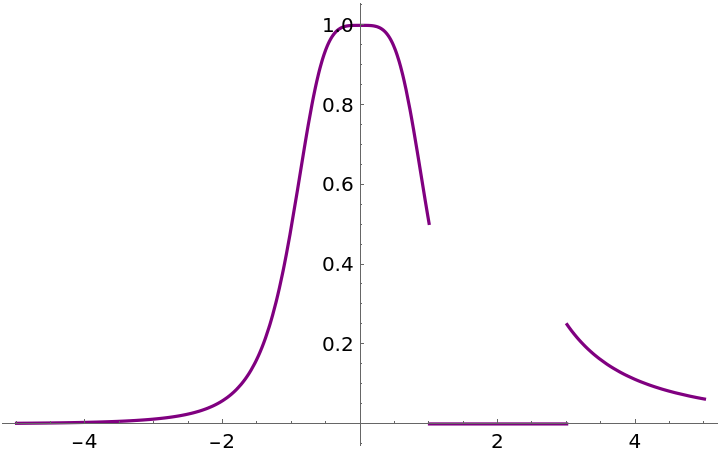
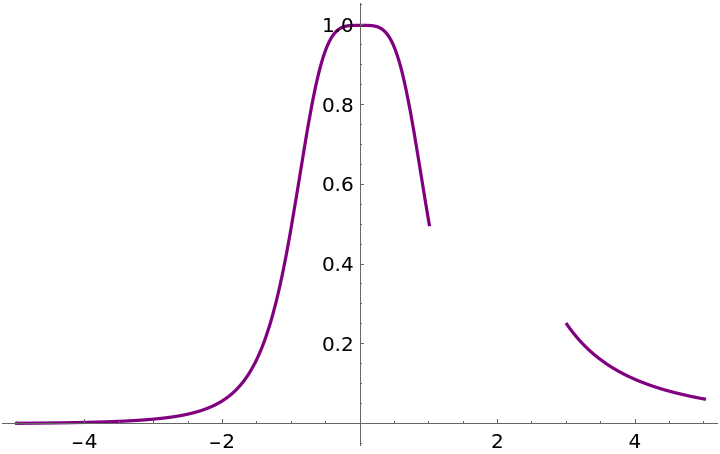
By default, the Wolfram Language does not produce a correct plot of a piecewise function whose domain consists of disjoint intervals. The reason is that it uses 0 as the default value if none of the conditions apply:
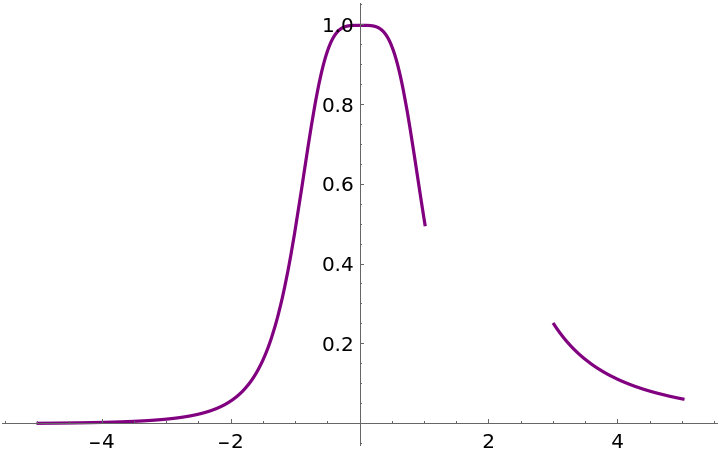
A correct plot is obtained by manually setting the default value of the Piecewise to Null:
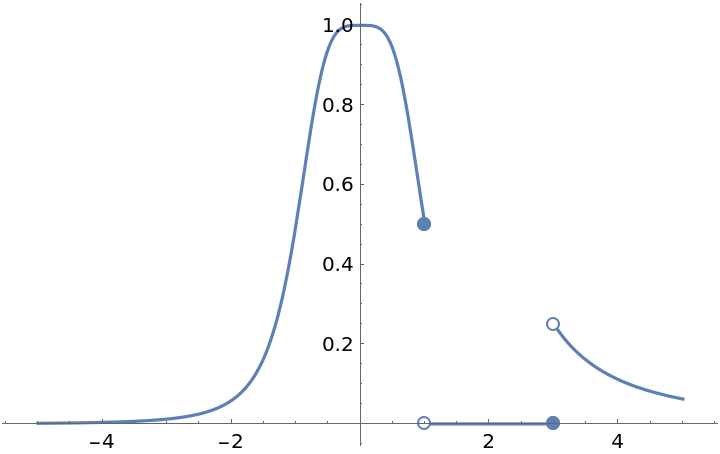
EnhancedPlot automatically sets the default value of Piecewise to Null:
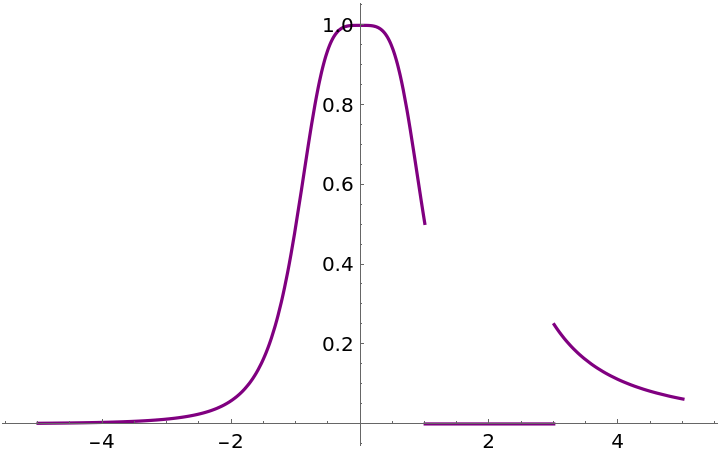
Return default Plot behavior by setting the option "ZeroToNull" to False:
Note that with the option "ZeroToNull" set to False, "FindExceptions" will list the break points as jump discontinuities:
Possible Issues (4)
The resource function Asymptotes can be very slow:
This contributes a significant amount of time to EnhancedPlot if the setting "FindAsymptotes"→True is used:
On the other hand, "FindExceptions" is very fast:
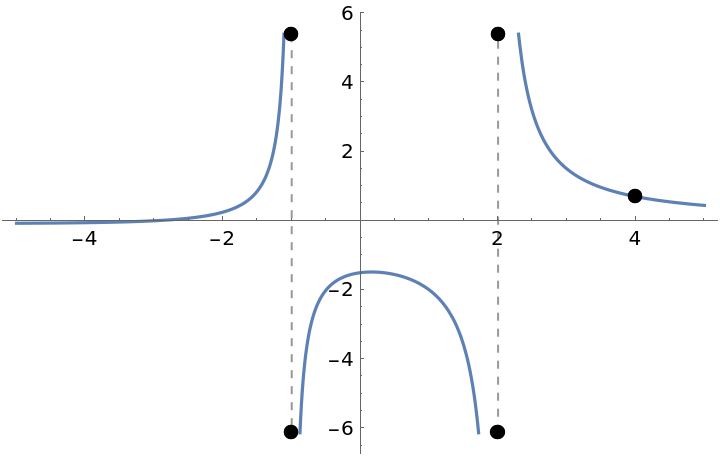
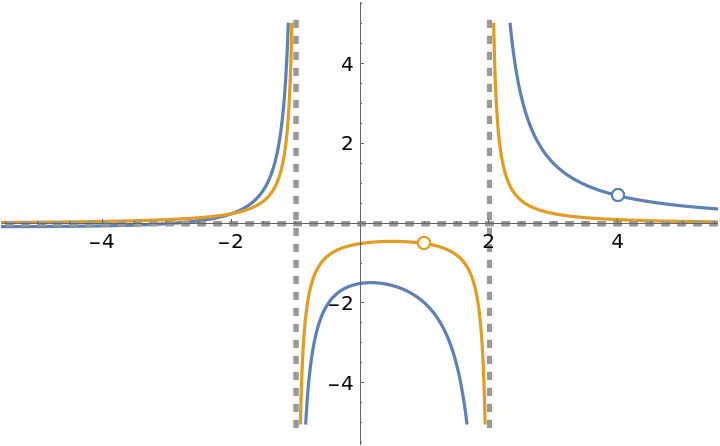
The resource function Asymptotes can miss the asymptotes of some functions:
The resource function FunctionDiscontinuities will find the exceptions:
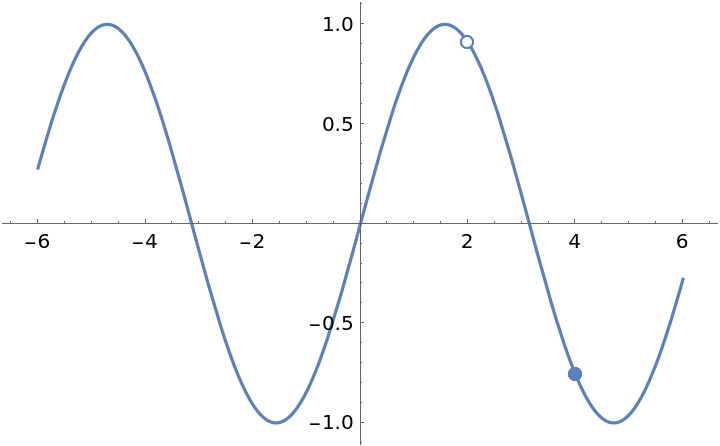
EnhancedPlot sometimes misses a removable discontinuity:
However, the discontinuity can be listed manually:
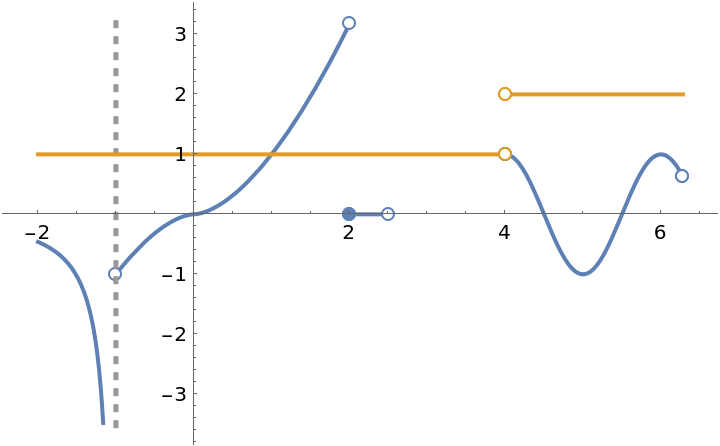
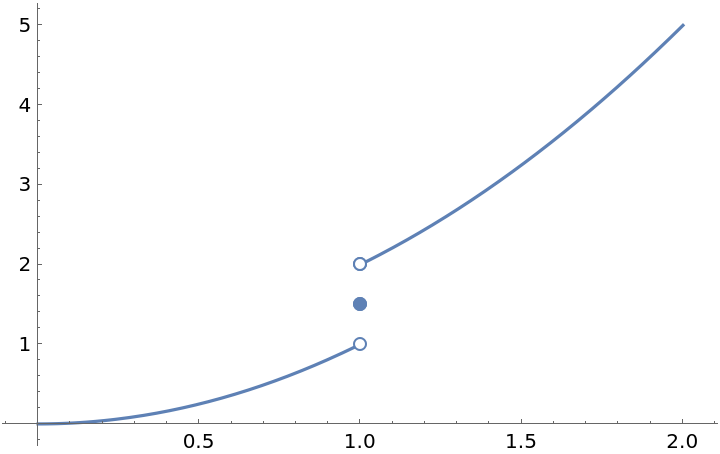
When a discontinuity denoted by a filled circle is overlapped by a empty circle, the filled circle is covered by the empty circle. That is, the empty circle is not really empty (see behavior at x=4):
![f[x_] := \[Piecewise] {
{x^2, x < 1},
{x^2 + 1, x > 1},
{1.5, x == 1}
}
ResourceFunction["EnhancedPlot"][f[x], {x, 0, 2}, "FindExceptions" -> True]](https://www.wolframcloud.com/obj/resourcesystem/images/ad8/ad846957-ea4b-4872-be92-fa22a1355ebe/62be4656ae068b80.png)
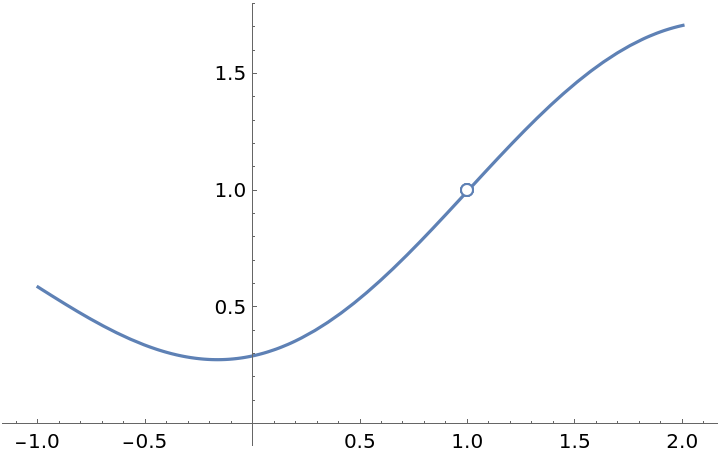
![f[x_] := \[Piecewise] {
{x^2, x < 1},
{x^2 + 1, x > 1},
{1.5, x == 1}
}
ResourceFunction["EnhancedPlot"][f[x], {x, 0, 2}, "Exception" -> 1]](https://www.wolframcloud.com/obj/resourcesystem/images/ad8/ad846957-ea4b-4872-be92-fa22a1355ebe/16e184f70f26996c.png)


![f[x_] := \!\(\*
TagBox[GridBox[{
{"\[Piecewise]", GridBox[{
{
RowBox[{
FractionBox[
SuperscriptBox[
RowBox[{"Sin", "[",
RowBox[{"x", "-", "1"}], "]"}], "2"],
RowBox[{"x", "-", "1"}]], "+", "1"}],
RowBox[{"x", "!=", "1"}]},
{"1",
RowBox[{"x", "==", "1"}]}
},
AllowedDimensions->{2, Automatic},
Editable->True,
GridBoxAlignment->{"Columns" -> {{Left}}, "ColumnsIndexed" -> {}, "Rows" -> {{Baseline}}, "RowsIndexed" -> {}},
GridBoxItemSize->{"Columns" -> {{Automatic}}, "ColumnsIndexed" -> {}, "Rows" -> {{1.}}, "RowsIndexed" -> {}},
GridBoxSpacings->{"Columns" -> {
Offset[0.27999999999999997`], {
Offset[0.84]},
Offset[0.27999999999999997`]}, "ColumnsIndexed" -> {}, "Rows" -> {
Offset[0.2], {
Offset[0.4]},
Offset[0.2]}, "RowsIndexed" -> {}},
Selectable->True]}
},
GridBoxAlignment->{"Columns" -> {{Left}}, "ColumnsIndexed" -> {}, "Rows" -> {{Baseline}}, "RowsIndexed" -> {}},
GridBoxItemSize->{"Columns" -> {{Automatic}}, "ColumnsIndexed" -> {}, "Rows" -> {{1.}}, "RowsIndexed" -> {}},
GridBoxSpacings->{"Columns" -> {
Offset[0.27999999999999997`], {
Offset[0.35]},
Offset[0.27999999999999997`]}, "ColumnsIndexed" -> {}, "Rows" -> {
Offset[0.2], {
Offset[0.4]},
Offset[0.2]}, "RowsIndexed" -> {}}],
"Piecewise",
DeleteWithContents->True,
Editable->False,
SelectWithContents->True,
Selectable->False,
StripWrapperBoxes->True]\)
ResourceFunction["EnhancedPlot"][f[x], {x, -1, 2}, "FindExceptions" -> True, AxesOrigin -> {0, 0}]](https://www.wolframcloud.com/obj/resourcesystem/images/ad8/ad846957-ea4b-4872-be92-fa22a1355ebe/646288fb2ff9728a.png)
![f[x_] := \!\(\*
TagBox[GridBox[{
{"\[Piecewise]", GridBox[{
{
RowBox[{
FractionBox[
SuperscriptBox[
RowBox[{"Sin", "[",
RowBox[{"x", "-", "1"}], "]"}], "2"],
RowBox[{"x", "-", "1"}]], "+", "1"}],
RowBox[{"x", "!=", "1"}]},
{"1",
RowBox[{"x", "==", "1"}]}
},
AllowedDimensions->{2, Automatic},
Editable->True,
GridBoxAlignment->{"Columns" -> {{Left}}, "ColumnsIndexed" -> {}, "Rows" -> {{Baseline}}, "RowsIndexed" -> {}},
GridBoxItemSize->{"Columns" -> {{Automatic}}, "ColumnsIndexed" -> {}, "Rows" -> {{1.}}, "RowsIndexed" -> {}},
GridBoxSpacings->{"Columns" -> {
Offset[0.27999999999999997`], {
Offset[0.84]},
Offset[0.27999999999999997`]}, "ColumnsIndexed" -> {}, "Rows" -> {
Offset[0.2], {
Offset[0.4]},
Offset[0.2]}, "RowsIndexed" -> {}},
Selectable->True]}
},
GridBoxAlignment->{"Columns" -> {{Left}}, "ColumnsIndexed" -> {}, "Rows" -> {{Baseline}}, "RowsIndexed" -> {}},
GridBoxItemSize->{"Columns" -> {{Automatic}}, "ColumnsIndexed" -> {}, "Rows" -> {{1.}}, "RowsIndexed" -> {}},
GridBoxSpacings->{"Columns" -> {
Offset[0.27999999999999997`], {
Offset[0.35]},
Offset[0.27999999999999997`]}, "ColumnsIndexed" -> {}, "Rows" -> {
Offset[0.2], {
Offset[0.4]},
Offset[0.2]}, "RowsIndexed" -> {}}],
"Piecewise",
DeleteWithContents->True,
Editable->False,
SelectWithContents->True,
Selectable->False,
StripWrapperBoxes->True]\)
ResourceFunction["EnhancedPlot"][f[x], {x, -1, 2}, "Exception" -> 1, AxesOrigin -> {0, 0}]](https://www.wolframcloud.com/obj/resourcesystem/images/ad8/ad846957-ea4b-4872-be92-fa22a1355ebe/718c2e10b5bc7221.png)
![Clear[f]
f[x_] := \!\(\*
TagBox[GridBox[{
{"\[Piecewise]", GridBox[{
{
FractionBox["1",
RowBox[{"1", "+", "x"}]],
RowBox[{"x", "<",
RowBox[{"-", "1"}]}]},
{
RowBox[{"x", "-",
SuperscriptBox["x", "2"]}],
RowBox[{
RowBox[{"-", "1"}], "<", "x", "<", "2"}]},
{
RowBox[{
FractionBox["1", "2"],
RowBox[{"(",
RowBox[{"1", "-", "x"}], ")"}]}],
RowBox[{"2", "<=", "x", "<", "3"}]},
{
RowBox[{"Cos", "[",
RowBox[{"\[Pi]", " ", "x"}], "]"}],
RowBox[{"3", "<", "x", "<", "4"}]}
},
AllowedDimensions->{2, Automatic},
Editable->True,
GridBoxAlignment->{"Columns" -> {{Left}}, "Rows" -> {{Baseline}}},
GridBoxItemSize->{"Columns" -> {{Automatic}}, "Rows" -> {{1.}}},
GridBoxSpacings->{"Columns" -> {
Offset[0.27999999999999997`], {
Offset[0.84]},
Offset[0.27999999999999997`]}, "Rows" -> {
Offset[0.2], {
Offset[0.4]},
Offset[0.2]}},
Selectable->True]}
},
GridBoxAlignment->{"Columns" -> {{Left}}, "Rows" -> {{Baseline}}},
GridBoxItemSize->{"Columns" -> {{Automatic}}, "Rows" -> {{1.}}},
GridBoxSpacings->{"Columns" -> {
Offset[0.27999999999999997`], {
Offset[0.35]},
Offset[0.27999999999999997`]}, "Rows" -> {
Offset[0.2], {
Offset[0.4]},
Offset[0.2]}}],
"Piecewise",
DeleteWithContents->True,
Editable->False,
SelectWithContents->True,
Selectable->False,
StripWrapperBoxes->True]\)
ResourceFunction["EnhancedPlot"][f[x], {x, -4, 4}, "FindExceptions" -> True, "Asymptote" -> -1, "HorizontalAsymptote" -> 0]](https://www.wolframcloud.com/obj/resourcesystem/images/ad8/ad846957-ea4b-4872-be92-fa22a1355ebe/07845a4e24b03ebf.png)
![Clear[f]
f[x_] := \!\(\*
TagBox[GridBox[{
{"\[Piecewise]", GridBox[{
{
FractionBox["1",
RowBox[{"1", "+", "x"}]],
RowBox[{"x", "<",
RowBox[{"-", "1"}]}]},
{
RowBox[{"x", "-",
SuperscriptBox["x", "2"]}],
RowBox[{
RowBox[{"-", "1"}], "<", "x", "<", "2"}]},
{
RowBox[{
FractionBox["1", "2"],
RowBox[{"(",
RowBox[{"1", "-", "x"}], ")"}]}],
RowBox[{"2", "<=", "x", "<", "3"}]},
{
RowBox[{"Cos", "[",
RowBox[{"\[Pi]", " ", "x"}], "]"}],
RowBox[{"3", "<", "x", "<", "4"}]}
},
AllowedDimensions->{2, Automatic},
Editable->True,
GridBoxAlignment->{"Columns" -> {{Left}}, "Rows" -> {{Baseline}}},
GridBoxItemSize->{"Columns" -> {{Automatic}}, "Rows" -> {{1.}}},
GridBoxSpacings->{"Columns" -> {
Offset[0.27999999999999997`], {
Offset[0.84]},
Offset[0.27999999999999997`]}, "Rows" -> {
Offset[0.2], {
Offset[0.4]},
Offset[0.2]}},
Selectable->True]}
},
GridBoxAlignment->{"Columns" -> {{Left}}, "Rows" -> {{Baseline}}},
GridBoxItemSize->{"Columns" -> {{Automatic}}, "Rows" -> {{1.}}},
GridBoxSpacings->{"Columns" -> {
Offset[0.27999999999999997`], {
Offset[0.35]},
Offset[0.27999999999999997`]}, "Rows" -> {
Offset[0.2], {
Offset[0.4]},
Offset[0.2]}}],
"Piecewise",
DeleteWithContents->True,
Editable->False,
SelectWithContents->True,
Selectable->False,
StripWrapperBoxes->True]\)
ResourceFunction["EnhancedPlot"][f[x], {x, -4, 4}, "FindExceptions" -> True, "FindAsymptotes" -> True]](https://www.wolframcloud.com/obj/resourcesystem/images/ad8/ad846957-ea4b-4872-be92-fa22a1355ebe/3f63642f0d7decdb.png)

![f[x_] := (x^2 - 9)/(x - 3) Sin[2 x] + Tan[x] - 9
ResourceFunction["EnhancedPlot"][f[x], {x, 0, 2 \[Pi]}, "FindExceptions" -> True]](https://www.wolframcloud.com/obj/resourcesystem/images/ad8/ad846957-ea4b-4872-be92-fa22a1355ebe/05018316016cbe34.png)

![f[x_] := \!\(\*
TagBox[GridBox[{
{"\[Piecewise]", GridBox[{
{
RowBox[{
RowBox[{
FractionBox[
RowBox[{
SuperscriptBox["x", "2"], "-", "9"}],
RowBox[{"x", "-", "3"}]],
RowBox[{"Sin", "[",
RowBox[{"2", "x"}], "]"}]}], "+",
RowBox[{"Tan", "[", "x", "]"}], "-", "9"}],
RowBox[{"x", "!=", "3"}]},
{
RowBox[{
RowBox[{"-", "9"}], "+",
RowBox[{"6", " ",
RowBox[{"Sin", "[", "6", "]"}]}], "+",
RowBox[{"Tan", "[", "3", "]"}]}],
RowBox[{"x", "==", "3"}]}
},
AllowedDimensions->{2, Automatic},
Editable->True,
GridBoxAlignment->{"Columns" -> {{Left}}, "ColumnsIndexed" -> {}, "Rows" -> {{Baseline}}, "RowsIndexed" -> {}},
GridBoxItemSize->{"Columns" -> {{Automatic}}, "ColumnsIndexed" -> {}, "Rows" -> {{1.}}, "RowsIndexed" -> {}},
GridBoxSpacings->{"Columns" -> {
Offset[0.27999999999999997`], {
Offset[0.84]},
Offset[0.27999999999999997`]}, "ColumnsIndexed" -> {}, "Rows" -> {
Offset[0.2], {
Offset[0.4]},
Offset[0.2]}, "RowsIndexed" -> {}},
Selectable->True]}
},
GridBoxAlignment->{"Columns" -> {{Left}}, "ColumnsIndexed" -> {}, "Rows" -> {{Baseline}}, "RowsIndexed" -> {}},
GridBoxItemSize->{"Columns" -> {{Automatic}}, "ColumnsIndexed" -> {}, "Rows" -> {{1.}}, "RowsIndexed" -> {}},
GridBoxSpacings->{"Columns" -> {
Offset[0.27999999999999997`], {
Offset[0.35]},
Offset[0.27999999999999997`]}, "ColumnsIndexed" -> {}, "Rows" -> {
Offset[0.2], {
Offset[0.4]},
Offset[0.2]}, "RowsIndexed" -> {}}],
"Piecewise",
DeleteWithContents->True,
Editable->False,
SelectWithContents->True,
Selectable->False,
StripWrapperBoxes->True]\)
ResourceFunction["EnhancedPlot"][f[x], {x, 0, 2 \[Pi]}, "FindExceptions" -> True]](https://www.wolframcloud.com/obj/resourcesystem/images/ad8/ad846957-ea4b-4872-be92-fa22a1355ebe/5354dec8e97e4e0c.png)
![f[x_] := \!\(\*
TagBox[GridBox[{
{"\[Piecewise]", GridBox[{
{
RowBox[{
RowBox[{
FractionBox[
RowBox[{
SuperscriptBox["x", "2"], "-", "9"}],
RowBox[{"x", "-", "3"}]],
RowBox[{"Sin", "[",
RowBox[{"2", "x"}], "]"}]}], "+",
RowBox[{"Tan", "[", "x", "]"}], "-", "9"}],
RowBox[{"x", "!=", "3"}]},
{
RowBox[{
RowBox[{"-", "9"}], "+",
RowBox[{"6", " ",
RowBox[{"Sin", "[", "6", "]"}]}], "+",
RowBox[{"Tan", "[", "3", "]"}]}],
RowBox[{"x", "==", "3"}]}
},
AllowedDimensions->{2, Automatic},
Editable->True,
GridBoxAlignment->{"Columns" -> {{Left}}, "ColumnsIndexed" -> {}, "Rows" -> {{Baseline}}, "RowsIndexed" -> {}},
GridBoxItemSize->{"Columns" -> {{Automatic}}, "ColumnsIndexed" -> {}, "Rows" -> {{1.}}, "RowsIndexed" -> {}},
GridBoxSpacings->{"Columns" -> {
Offset[0.27999999999999997`], {
Offset[0.84]},
Offset[0.27999999999999997`]}, "ColumnsIndexed" -> {}, "Rows" -> {
Offset[0.2], {
Offset[0.4]},
Offset[0.2]}, "RowsIndexed" -> {}},
Selectable->True]}
},
GridBoxAlignment->{"Columns" -> {{Left}}, "ColumnsIndexed" -> {}, "Rows" -> {{Baseline}}, "RowsIndexed" -> {}},
GridBoxItemSize->{"Columns" -> {{Automatic}}, "ColumnsIndexed" -> {}, "Rows" -> {{1.}}, "RowsIndexed" -> {}},
GridBoxSpacings->{"Columns" -> {
Offset[0.27999999999999997`], {
Offset[0.35]},
Offset[0.27999999999999997`]}, "ColumnsIndexed" -> {}, "Rows" -> {
Offset[0.2], {
Offset[0.4]},
Offset[0.2]}, "RowsIndexed" -> {}}],
"Piecewise",
DeleteWithContents->True,
Editable->False,
SelectWithContents->True,
Selectable->False,
StripWrapperBoxes->True]\)
ResourceFunction["EnhancedPlot"][f[x], {x, 0, 2 \[Pi]}, "Exception" -> 3, "Asymptote" -> {\[Pi]/2, (3 \[Pi])/2}]](https://www.wolframcloud.com/obj/resourcesystem/images/ad8/ad846957-ea4b-4872-be92-fa22a1355ebe/2869602b35ad725c.png)
![ResourceFunction["EnhancedPlot"][{\!\(\*
TagBox[GridBox[{
{"\[Piecewise]", GridBox[{
{
FractionBox[
SuperscriptBox["x",
RowBox[{"1", "/", "3"}]],
RowBox[{"1", "+",
SuperscriptBox["x", "2"]}]],
RowBox[{"x", "<=", "1"}]},
{
FractionBox["1",
SuperscriptBox[
RowBox[{"(",
RowBox[{"1", "-", "x"}], ")"}], "2"]],
RowBox[{"x", ">", "3"}]}
},
AllowedDimensions->{2, Automatic},
Editable->True,
GridBoxAlignment->{"Columns" -> {{Left}}, "ColumnsIndexed" -> {}, "Rows" -> {{Baseline}}, "RowsIndexed" -> {}},
GridBoxItemSize->{"Columns" -> {{Automatic}}, "ColumnsIndexed" -> {}, "Rows" -> {{1.}}, "RowsIndexed" -> {}},
GridBoxSpacings->{"Columns" -> {
Offset[0.27999999999999997`], {
Offset[0.84]},
Offset[0.27999999999999997`]}, "ColumnsIndexed" -> {}, "Rows" -> {
Offset[0.2], {
Offset[0.4]},
Offset[0.2]}, "RowsIndexed" -> {}},
Selectable->True]}
},
GridBoxAlignment->{"Columns" -> {{Left}}, "ColumnsIndexed" -> {}, "Rows" -> {{Baseline}}, "RowsIndexed" -> {}},
GridBoxItemSize->{"Columns" -> {{Automatic}}, "ColumnsIndexed" -> {}, "Rows" -> {{1.}}, "RowsIndexed" -> {}},
GridBoxSpacings->{"Columns" -> {
Offset[0.27999999999999997`], {
Offset[0.35]},
Offset[0.27999999999999997`]}, "ColumnsIndexed" -> {}, "Rows" -> {
Offset[0.2], {
Offset[0.4]},
Offset[0.2]}, "RowsIndexed" -> {}}],
"Piecewise",
DeleteWithContents->True,
Editable->False,
SelectWithContents->True,
Selectable->False,
StripWrapperBoxes->True]\) , \!\(\*
TagBox[GridBox[{
{"\[Piecewise]", GridBox[{
{
RowBox[{
RowBox[{"-",
FractionBox[
RowBox[{"2", " ",
SuperscriptBox["x",
RowBox[{"4", "/", "3"}]]}],
SuperscriptBox[
RowBox[{"(",
RowBox[{"1", "+",
SuperscriptBox["x", "2"]}], ")"}], "2"]]}], "+",
FractionBox["1",
RowBox[{"3", " ",
SuperscriptBox["x",
RowBox[{"2", "/", "3"}]], " ",
RowBox[{"(",
RowBox[{"1", "+",
SuperscriptBox["x", "2"]}], ")"}]}]]}],
RowBox[{"x", "<", "1"}]},
{
RowBox[{"-",
FractionBox["2",
SuperscriptBox[
RowBox[{"(",
RowBox[{
RowBox[{"-", "1"}], "+", "x"}], ")"}], "3"]]}],
RowBox[{"x", ">", "3"}]}
},
AllowedDimensions->{2, Automatic},
Editable->True,
GridBoxAlignment->{"Columns" -> {{Left}}, "Rows" -> {{Baseline}}},
GridBoxItemSize->{"Columns" -> {{Automatic}}, "Rows" -> {{1.}}},
GridBoxSpacings->{"Columns" -> {
Offset[0.27999999999999997`], {
Offset[0.84]},
Offset[0.27999999999999997`]}, "Rows" -> {
Offset[0.2], {
Offset[0.4]},
Offset[0.2]}},
Selectable->True]}
},
GridBoxAlignment->{"Columns" -> {{Left}}, "Rows" -> {{Baseline}}},
GridBoxItemSize->{"Columns" -> {{Automatic}}, "Rows" -> {{1.}}},
GridBoxSpacings->{"Columns" -> {
Offset[0.27999999999999997`], {
Offset[0.35]},
Offset[0.27999999999999997`]}, "Rows" -> {
Offset[0.2], {
Offset[0.4]},
Offset[0.2]}}],
"Piecewise",
DeleteWithContents->True,
Editable->False,
SelectWithContents->True,
Selectable->False,
StripWrapperBoxes->True]\)}, {x, -5, 5}, "FindExceptions" -> True, PlotRange -> {-1, 1}]](https://www.wolframcloud.com/obj/resourcesystem/images/ad8/ad846957-ea4b-4872-be92-fa22a1355ebe/6610d84c3daff4be.png)
![ResourceFunction["EnhancedPlot"][Tan[x], {x, -\[Pi], \[Pi]}, "Asymptote" -> {-(\[Pi]/2), \[Pi]/2}, "AsymptoteStyle" -> {{Dashed, Red}}]](https://www.wolframcloud.com/obj/resourcesystem/images/ad8/ad846957-ea4b-4872-be92-fa22a1355ebe/527ef3ae0f23a9f4.png)
![f[x_] := \!\(\*
TagBox[GridBox[{
{"\[Piecewise]", GridBox[{
{
FractionBox[
RowBox[{"Sin", "[", "x", "]"}], "x"],
RowBox[{"x", "!=", "0"}]},
{".5",
RowBox[{"x", "==", "0"}]}
},
AllowedDimensions->{2, Automatic},
Editable->True,
GridBoxAlignment->{"Columns" -> {{Left}}, "ColumnsIndexed" -> {}, "Rows" -> {{Baseline}}, "RowsIndexed" -> {}},
GridBoxItemSize->{"Columns" -> {{Automatic}}, "ColumnsIndexed" -> {}, "Rows" -> {{1.}}, "RowsIndexed" -> {}},
GridBoxSpacings->{"Columns" -> {
Offset[0.27999999999999997`], {
Offset[0.84]},
Offset[0.27999999999999997`]}, "ColumnsIndexed" -> {}, "Rows" -> {
Offset[0.2], {
Offset[0.4]},
Offset[0.2]}, "RowsIndexed" -> {}},
Selectable->True]}
},
GridBoxAlignment->{"Columns" -> {{Left}}, "ColumnsIndexed" -> {}, "Rows" -> {{Baseline}}, "RowsIndexed" -> {}},
GridBoxItemSize->{"Columns" -> {{Automatic}}, "ColumnsIndexed" -> {}, "Rows" -> {{1.}}, "RowsIndexed" -> {}},
GridBoxSpacings->{"Columns" -> {
Offset[0.27999999999999997`], {
Offset[0.35]},
Offset[0.27999999999999997`]}, "ColumnsIndexed" -> {}, "Rows" -> {
Offset[0.2], {
Offset[0.4]},
Offset[0.2]}, "RowsIndexed" -> {}}],
"Piecewise",
DeleteWithContents->True,
Editable->False,
SelectWithContents->True,
Selectable->False]\)
ResourceFunction["EnhancedPlot"][f[x], {x, -\[Pi], \[Pi]}, "Exception" -> 0, "DrawPoint" -> {{-1, 1/4}, {3, 3/4}}, "DrawPointStyle" -> {Red, AbsolutePointSize[15]}, AxesOrigin -> {0, 0}]](https://www.wolframcloud.com/obj/resourcesystem/images/ad8/ad846957-ea4b-4872-be92-fa22a1355ebe/7cf035946d9f8caf.png)
![f[x_] := Sin[x]
ResourceFunction["EnhancedPlot"][f[x], {x, -\[Pi], \[Pi]}, "Exception" -> 0, "DrawPoint" -> Range[-3, 3], "DrawPointStyle" -> {Red, AbsolutePointSize[12]}]](https://www.wolframcloud.com/obj/resourcesystem/images/ad8/ad846957-ea4b-4872-be92-fa22a1355ebe/6af36bcdcd88e0cc.png)
![Clear[f]
f[x_] := \!\(\*
TagBox[GridBox[{
{"\[Piecewise]", GridBox[{
{
FractionBox["1",
SuperscriptBox["x", "2"]],
RowBox[{"x", "<=",
RowBox[{"-", "1"}]}]},
{
RowBox[{
FractionBox[
RowBox[{"Sin", "[",
RowBox[{"x", "+",
RowBox[{"1", "/", "2"}]}], "]"}],
RowBox[{"x", "+",
RowBox[{"1", "/", "2"}]}]], "+",
FractionBox["1",
RowBox[{"x", "-", "1"}]]}],
RowBox[{
RowBox[{"-", "1"}], "<", "x", "<", "1"}]},
{
FractionBox["1",
RowBox[{
SuperscriptBox["x", "2"], "-", "1"}]],
RowBox[{"x", ">=", "1"}]}
},
AllowedDimensions->{2, Automatic},
Editable->True,
GridBoxAlignment->{"Columns" -> {{Left}}, "ColumnsIndexed" -> {}, "Rows" -> {{Baseline}}, "RowsIndexed" -> {}},
GridBoxItemSize->{"Columns" -> {{Automatic}}, "ColumnsIndexed" -> {}, "Rows" -> {{1.}}, "RowsIndexed" -> {}},
GridBoxSpacings->{"Columns" -> {
Offset[0.27999999999999997`], {
Offset[0.84]},
Offset[0.27999999999999997`]}, "ColumnsIndexed" -> {}, "Rows" -> {
Offset[0.2], {
Offset[0.4]},
Offset[0.2]}, "RowsIndexed" -> {}},
Selectable->True]}
},
GridBoxAlignment->{"Columns" -> {{Left}}, "ColumnsIndexed" -> {}, "Rows" -> {{Baseline}}, "RowsIndexed" -> {}},
GridBoxItemSize->{"Columns" -> {{Automatic}}, "ColumnsIndexed" -> {}, "Rows" -> {{1.}}, "RowsIndexed" -> {}},
GridBoxSpacings->{"Columns" -> {
Offset[0.27999999999999997`], {
Offset[0.35]},
Offset[0.27999999999999997`]}, "ColumnsIndexed" -> {}, "Rows" -> {
Offset[0.2], {
Offset[0.4]},
Offset[0.2]}, "RowsIndexed" -> {}}],
"Piecewise",
DeleteWithContents->True,
Editable->False,
SelectWithContents->True,
Selectable->False,
StripWrapperBoxes->True]\)
ResourceFunction["EnhancedPlot"][f[x], {x, -2, 2}, "Exception" -> {-1, -1/2}, "Asymptote" -> 1]](https://www.wolframcloud.com/obj/resourcesystem/images/ad8/ad846957-ea4b-4872-be92-fa22a1355ebe/7f9d45e5d3b8b55c.png)

![Clear[f]
f[x_] := \!\(\*
TagBox[GridBox[{
{"\[Piecewise]", GridBox[{
{
FractionBox["1",
SuperscriptBox["x", "2"]],
RowBox[{"x", "<=",
RowBox[{"-", "1"}]}]},
{
RowBox[{
FractionBox[
RowBox[{"Sin", "[",
RowBox[{"x", "+",
RowBox[{"1", "/", "2"}]}], "]"}],
RowBox[{"x", "+",
RowBox[{"1", "/", "2"}]}]], "+",
FractionBox["1",
RowBox[{"x", "-", "1"}]]}],
RowBox[{
RowBox[{"-", "1"}], "<", "x", "<", "1"}]},
{
FractionBox["1",
RowBox[{
SuperscriptBox["x", "2"], "-", "1"}]],
RowBox[{"x", ">=", "1"}]}
},
AllowedDimensions->{2, Automatic},
Editable->True,
GridBoxAlignment->{"Columns" -> {{Left}}, "ColumnsIndexed" -> {}, "Rows" -> {{Baseline}}, "RowsIndexed" -> {}},
GridBoxItemSize->{"Columns" -> {{Automatic}}, "ColumnsIndexed" -> {}, "Rows" -> {{1.}}, "RowsIndexed" -> {}},
GridBoxSpacings->{"Columns" -> {
Offset[0.27999999999999997`], {
Offset[0.84]},
Offset[0.27999999999999997`]}, "ColumnsIndexed" -> {}, "Rows" -> {
Offset[0.2], {
Offset[0.4]},
Offset[0.2]}, "RowsIndexed" -> {}},
Selectable->True]}
},
GridBoxAlignment->{"Columns" -> {{Left}}, "ColumnsIndexed" -> {}, "Rows" -> {{Baseline}}, "RowsIndexed" -> {}},
GridBoxItemSize->{"Columns" -> {{Automatic}}, "ColumnsIndexed" -> {}, "Rows" -> {{1.}}, "RowsIndexed" -> {}},
GridBoxSpacings->{"Columns" -> {
Offset[0.27999999999999997`], {
Offset[0.35]},
Offset[0.27999999999999997`]}, "ColumnsIndexed" -> {}, "Rows" -> {
Offset[0.2], {
Offset[0.4]},
Offset[0.2]}, "RowsIndexed" -> {}}],
"Piecewise",
DeleteWithContents->True,
Editable->False,
SelectWithContents->True,
Selectable->False,
StripWrapperBoxes->True]\)
ResourceFunction["EnhancedPlot"][f[x], {x, -2, 2}, "FindExceptions" -> True, "Asymptote" -> 1]](https://www.wolframcloud.com/obj/resourcesystem/images/ad8/ad846957-ea4b-4872-be92-fa22a1355ebe/4b6624cb24e47a3d.png)
![f[x_] := (-12 - x + x^2)/(8 + 2 x - 5 x^2 + x^3);
ResourceFunction[
"EnhancedPlot"][{f[x], (x - 1)/((x - 1) (x^2 - x - 2))}, {x, -6, 6}, "FindExceptions" -> True, "FindAsymptotes" -> True, PlotRange -> 5]](https://www.wolframcloud.com/obj/resourcesystem/images/ad8/ad846957-ea4b-4872-be92-fa22a1355ebe/29f653353c9bad54.png)
![ResourceFunction["EnhancedPlot"][1/(x - 2)^2 + 3, {x, 0, 4}, "Asymptote" -> {2}, "HorizontalAsymptote" -> 3, "HorizontalAsymptoteStyle" -> {{Green, Dashing[Large]}}, AxesOrigin -> {0, 0}]](https://www.wolframcloud.com/obj/resourcesystem/images/ad8/ad846957-ea4b-4872-be92-fa22a1355ebe/090201c3471b81e7.png)

![ResourceFunction["EnhancedPlot"][1/(x - 2)^2 + 3, {x, 0, 4}, "FindAsymptotes" -> True, "HorizontalAsymptoteStyle" -> {{Green, Dashing[Large]}}, AxesOrigin -> {0, 0}]](https://www.wolframcloud.com/obj/resourcesystem/images/ad8/ad846957-ea4b-4872-be92-fa22a1355ebe/478deefc1894346e.png)
![Clear[f]
f[x_] := \!\(\*
TagBox[GridBox[{
{"\[Piecewise]", GridBox[{
{
FractionBox["1",
RowBox[{"1", "+", "x"}]],
RowBox[{"x", "<",
RowBox[{"-", "1"}]}]},
{
RowBox[{"x", "-",
SuperscriptBox["x", "2"]}],
RowBox[{
RowBox[{"-", "1"}], "<", "x", "<", "2"}]},
{
RowBox[{
FractionBox["1", "2"],
RowBox[{"(",
RowBox[{"1", "-", "x"}], ")"}]}],
RowBox[{"2", "<=", "x", "<", "3"}]},
{
RowBox[{"Cos", "[",
RowBox[{"\[Pi]", " ", "x"}], "]"}],
RowBox[{"3", "<", "x", "<=", "4"}]}
},
AllowedDimensions->{2, Automatic},
Editable->True,
GridBoxAlignment->{"Columns" -> {{Left}}, "Rows" -> {{Baseline}}},
GridBoxItemSize->{"Columns" -> {{Automatic}}, "Rows" -> {{1.}}},
GridBoxSpacings->{"Columns" -> {
Offset[0.27999999999999997`], {
Offset[0.84]},
Offset[0.27999999999999997`]}, "Rows" -> {
Offset[0.2], {
Offset[0.4]},
Offset[0.2]}},
Selectable->True]}
},
GridBoxAlignment->{"Columns" -> {{Left}}, "Rows" -> {{Baseline}}},
GridBoxItemSize->{"Columns" -> {{Automatic}}, "Rows" -> {{1.}}},
GridBoxSpacings->{"Columns" -> {
Offset[0.27999999999999997`], {
Offset[0.35]},
Offset[0.27999999999999997`]}, "Rows" -> {
Offset[0.2], {
Offset[0.4]},
Offset[0.2]}}],
"Piecewise",
DeleteWithContents->True,
Editable->False,
SelectWithContents->True,
Selectable->False,
StripWrapperBoxes->True]\)
ResourceFunction["EnhancedPlot"][f[x], {x, -4, 4}, "FindExceptions" -> True, "HorizontalAsymptote" -> 0, "PointStyle" -> AbsolutePointSize[12]]](https://www.wolframcloud.com/obj/resourcesystem/images/ad8/ad846957-ea4b-4872-be92-fa22a1355ebe/4b4ba3a3163647b9.png)
![Clear[f]
f[x_] := \!\(\*
TagBox[GridBox[{
{"\[Piecewise]", GridBox[{
{
FractionBox["1",
RowBox[{"1", "+", "x"}]],
RowBox[{"x", "<",
RowBox[{"-", "1"}]}]},
{
RowBox[{"x", "-",
SuperscriptBox["x", "2"]}],
RowBox[{
RowBox[{"-", "1"}], "<", "x", "<", "2"}]},
{
RowBox[{
FractionBox["1", "2"],
RowBox[{"(",
RowBox[{"1", "-", "x"}], ")"}]}],
RowBox[{"2", "<=", "x", "<", "3"}]},
{
RowBox[{"Cos", "[",
RowBox[{"\[Pi]", " ", "x"}], "]"}],
RowBox[{"3", "<", "x", "<=", "4"}]}
},
AllowedDimensions->{2, Automatic},
Editable->True,
GridBoxAlignment->{"Columns" -> {{Left}}, "Rows" -> {{Baseline}}},
GridBoxItemSize->{"Columns" -> {{Automatic}}, "Rows" -> {{1.}}},
GridBoxSpacings->{"Columns" -> {
Offset[0.27999999999999997`], {
Offset[0.84]},
Offset[0.27999999999999997`]}, "Rows" -> {
Offset[0.2], {
Offset[0.4]},
Offset[0.2]}},
Selectable->True]}
},
GridBoxAlignment->{"Columns" -> {{Left}}, "Rows" -> {{Baseline}}},
GridBoxItemSize->{"Columns" -> {{Automatic}}, "Rows" -> {{1.}}},
GridBoxSpacings->{"Columns" -> {
Offset[0.27999999999999997`], {
Offset[0.35]},
Offset[0.27999999999999997`]}, "Rows" -> {
Offset[0.2], {
Offset[0.4]},
Offset[0.2]}}],
"Piecewise",
DeleteWithContents->True,
Editable->False,
SelectWithContents->True,
Selectable->False,
StripWrapperBoxes->True]\)
ResourceFunction[
"EnhancedPlot"][{f[x], Sin[x - 1]/(x - 1)}, {x, -4, 4}, "FindExceptions" -> True, "HorizontalAsymptote" -> 0, "DrawPoint" -> {{0, 1/2}}, "DrawPointStyle" -> Purple]](https://www.wolframcloud.com/obj/resourcesystem/images/ad8/ad846957-ea4b-4872-be92-fa22a1355ebe/7e574f94c5948140.png)
![Clear[f]
f[x_] := \!\(\*
TagBox[GridBox[{
{"\[Piecewise]", GridBox[{
{
FractionBox["1",
RowBox[{"1", "+",
SuperscriptBox["x", "4"]}]],
RowBox[{"x", "<", "1"}]},
{
FractionBox["1",
SuperscriptBox[
RowBox[{"(",
RowBox[{"1", "-", "x"}], ")"}], "2"]],
RowBox[{"x", ">", "3"}]}
},
AllowedDimensions->{2, Automatic},
Editable->True,
GridBoxAlignment->{"Columns" -> {{Left}}, "ColumnsIndexed" -> {}, "Rows" -> {{Baseline}}, "RowsIndexed" -> {}},
GridBoxItemSize->{"Columns" -> {{Automatic}}, "ColumnsIndexed" -> {}, "Rows" -> {{1.}}, "RowsIndexed" -> {}},
GridBoxSpacings->{"Columns" -> {
Offset[0.27999999999999997`], {
Offset[0.84]},
Offset[0.27999999999999997`]}, "ColumnsIndexed" -> {}, "Rows" -> {
Offset[0.2], {
Offset[0.4]},
Offset[0.2]}, "RowsIndexed" -> {}},
Selectable->True]}
},
GridBoxAlignment->{"Columns" -> {{Left}}, "ColumnsIndexed" -> {}, "Rows" -> {{Baseline}}, "RowsIndexed" -> {}},
GridBoxItemSize->{"Columns" -> {{Automatic}}, "ColumnsIndexed" -> {}, "Rows" -> {{1.}}, "RowsIndexed" -> {}},
GridBoxSpacings->{"Columns" -> {
Offset[0.27999999999999997`], {
Offset[0.35]},
Offset[0.27999999999999997`]}, "ColumnsIndexed" -> {}, "Rows" -> {
Offset[0.2], {
Offset[0.4]},
Offset[0.2]}, "RowsIndexed" -> {}}],
"Piecewise",
DeleteWithContents->True,
Editable->False,
SelectWithContents->True,
Selectable->False,
StripWrapperBoxes->True]\)
Plot[f[x], {x, -5, 5}, PlotStyle -> Purple]](https://www.wolframcloud.com/obj/resourcesystem/images/ad8/ad846957-ea4b-4872-be92-fa22a1355ebe/3b6ebbe3806715e2.png)
![Clear[f]
f[x_] := \!\(\*
TagBox[GridBox[{
{"\[Piecewise]", GridBox[{
{
FractionBox["1",
RowBox[{"1", "+",
SuperscriptBox["x", "4"]}]],
RowBox[{"x", "<", "1"}]},
{
FractionBox["1",
SuperscriptBox[
RowBox[{"(",
RowBox[{"1", "-", "x"}], ")"}], "2"]],
RowBox[{"x", ">", "3"}]},
{"Null", "True"}
},
AllowedDimensions->{2, Automatic},
Editable->True,
GridBoxAlignment->{"Columns" -> {{Left}}, "ColumnsIndexed" -> {}, "Rows" -> {{Baseline}}, "RowsIndexed" -> {}},
GridBoxItemSize->{"Columns" -> {{Automatic}}, "ColumnsIndexed" -> {}, "Rows" -> {{1.}}, "RowsIndexed" -> {}},
GridBoxSpacings->{"Columns" -> {
Offset[0.27999999999999997`], {
Offset[0.84]},
Offset[0.27999999999999997`]}, "ColumnsIndexed" -> {}, "Rows" -> {
Offset[0.2], {
Offset[0.4]},
Offset[0.2]}, "RowsIndexed" -> {}},
Selectable->True]}
},
GridBoxAlignment->{"Columns" -> {{Left}}, "ColumnsIndexed" -> {}, "Rows" -> {{Baseline}}, "RowsIndexed" -> {}},
GridBoxItemSize->{"Columns" -> {{Automatic}}, "ColumnsIndexed" -> {}, "Rows" -> {{1.}}, "RowsIndexed" -> {}},
GridBoxSpacings->{"Columns" -> {
Offset[0.27999999999999997`], {
Offset[0.35]},
Offset[0.27999999999999997`]}, "ColumnsIndexed" -> {}, "Rows" -> {
Offset[0.2], {
Offset[0.4]},
Offset[0.2]}, "RowsIndexed" -> {}}],
"Piecewise",
DeleteWithContents->True,
Editable->False,
SelectWithContents->True,
Selectable->False,
StripWrapperBoxes->True]\)
Plot[f[x], {x, -5, 5}, PlotStyle -> Purple]](https://www.wolframcloud.com/obj/resourcesystem/images/ad8/ad846957-ea4b-4872-be92-fa22a1355ebe/000dd263941f61c1.png)
![Clear[f]
f[x_] := \!\(\*
TagBox[GridBox[{
{"\[Piecewise]", GridBox[{
{
FractionBox["1",
RowBox[{"1", "+",
SuperscriptBox["x", "4"]}]],
RowBox[{"x", "<=", "1"}]},
{
FractionBox["1",
SuperscriptBox[
RowBox[{"(",
RowBox[{"1", "-", "x"}], ")"}], "2"]],
RowBox[{"x", ">=", "3"}]}
},
AllowedDimensions->{2, Automatic},
Editable->True,
GridBoxAlignment->{"Columns" -> {{Left}}, "ColumnsIndexed" -> {}, "Rows" -> {{Baseline}}, "RowsIndexed" -> {}},
GridBoxItemSize->{"Columns" -> {{Automatic}}, "ColumnsIndexed" -> {}, "Rows" -> {{1.}}, "RowsIndexed" -> {}},
GridBoxSpacings->{"Columns" -> {
Offset[0.27999999999999997`], {
Offset[0.84]},
Offset[0.27999999999999997`]}, "ColumnsIndexed" -> {}, "Rows" -> {
Offset[0.2], {
Offset[0.4]},
Offset[0.2]}, "RowsIndexed" -> {}},
Selectable->True]}
},
GridBoxAlignment->{"Columns" -> {{Left}}, "ColumnsIndexed" -> {}, "Rows" -> {{Baseline}}, "RowsIndexed" -> {}},
GridBoxItemSize->{"Columns" -> {{Automatic}}, "ColumnsIndexed" -> {}, "Rows" -> {{1.}}, "RowsIndexed" -> {}},
GridBoxSpacings->{"Columns" -> {
Offset[0.27999999999999997`], {
Offset[0.35]},
Offset[0.27999999999999997`]}, "ColumnsIndexed" -> {}, "Rows" -> {
Offset[0.2], {
Offset[0.4]},
Offset[0.2]}, "RowsIndexed" -> {}}],
"Piecewise",
DeleteWithContents->True,
Editable->False,
SelectWithContents->True,
Selectable->False,
StripWrapperBoxes->True]\)
ResourceFunction["EnhancedPlot"][f[x], {x, -5, 5}, PlotStyle -> Purple]](https://www.wolframcloud.com/obj/resourcesystem/images/ad8/ad846957-ea4b-4872-be92-fa22a1355ebe/33592cb352e875e4.png)
![Clear[f]
f[x_] := \!\(\*
TagBox[GridBox[{
{"\[Piecewise]", GridBox[{
{
FractionBox["1",
RowBox[{"1", "+",
SuperscriptBox["x", "4"]}]],
RowBox[{"x", "<=", "1"}]},
{
FractionBox["1",
SuperscriptBox[
RowBox[{"(",
RowBox[{"1", "-", "x"}], ")"}], "2"]],
RowBox[{"x", ">", "3"}]}
},
AllowedDimensions->{2, Automatic},
Editable->True,
GridBoxAlignment->{"Columns" -> {{Left}}, "ColumnsIndexed" -> {}, "Rows" -> {{Baseline}}, "RowsIndexed" -> {}},
GridBoxItemSize->{"Columns" -> {{Automatic}}, "ColumnsIndexed" -> {}, "Rows" -> {{1.}}, "RowsIndexed" -> {}},
GridBoxSpacings->{"Columns" -> {
Offset[0.27999999999999997`], {
Offset[0.84]},
Offset[0.27999999999999997`]}, "ColumnsIndexed" -> {}, "Rows" -> {
Offset[0.2], {
Offset[0.4]},
Offset[0.2]}, "RowsIndexed" -> {}},
Selectable->True]}
},
GridBoxAlignment->{"Columns" -> {{Left}}, "ColumnsIndexed" -> {}, "Rows" -> {{Baseline}}, "RowsIndexed" -> {}},
GridBoxItemSize->{"Columns" -> {{Automatic}}, "ColumnsIndexed" -> {}, "Rows" -> {{1.}}, "RowsIndexed" -> {}},
GridBoxSpacings->{"Columns" -> {
Offset[0.27999999999999997`], {
Offset[0.35]},
Offset[0.27999999999999997`]}, "ColumnsIndexed" -> {}, "Rows" -> {
Offset[0.2], {
Offset[0.4]},
Offset[0.2]}, "RowsIndexed" -> {}}],
"Piecewise",
DeleteWithContents->True,
Editable->False,
SelectWithContents->True,
Selectable->False,
StripWrapperBoxes->True]\)
ResourceFunction["EnhancedPlot"][f[x], {x, -5, 5}, PlotStyle -> Purple, "ZeroToNull" -> False]](https://www.wolframcloud.com/obj/resourcesystem/images/ad8/ad846957-ea4b-4872-be92-fa22a1355ebe/11371954c6cb9802.png)
![Clear[f]
f[x_] := \!\(\*
TagBox[GridBox[{
{"\[Piecewise]", GridBox[{
{
RowBox[{
FractionBox["1",
RowBox[{"1", "+",
SuperscriptBox["x", "2"]}]], "+", "x"}],
RowBox[{"x", "<",
RowBox[{"-", "1"}]}]},
{
RowBox[{
SuperscriptBox["x",
RowBox[{"5", "/", "3"}]], "-", "1"}],
RowBox[{
RowBox[{"-", "1"}], "<=", "x", "<", "2"}]},
{
RowBox[{"1", "/", "x"}],
RowBox[{"2", "<", "x", "<", "3"}]},
{
RowBox[{"Cos", "[", "x", "]"}],
RowBox[{"3", "<", "x", "<", "4"}]}
},
AllowedDimensions->{2, Automatic},
Editable->True,
GridBoxAlignment->{"Columns" -> {{Left}}, "Rows" -> {{Baseline}}},
GridBoxItemSize->{"Columns" -> {{Automatic}}, "Rows" -> {{1.}}},
GridBoxSpacings->{"Columns" -> {
Offset[0.27999999999999997`], {
Offset[0.84]},
Offset[0.27999999999999997`]}, "Rows" -> {
Offset[0.2], {
Offset[0.4]},
Offset[0.2]}},
Selectable->True]}
},
GridBoxAlignment->{"Columns" -> {{Left}}, "Rows" -> {{Baseline}}},
GridBoxItemSize->{"Columns" -> {{Automatic}}, "Rows" -> {{1.}}},
GridBoxSpacings->{"Columns" -> {
Offset[0.27999999999999997`], {
Offset[0.35]},
Offset[0.27999999999999997`]}, "Rows" -> {
Offset[0.2], {
Offset[0.4]},
Offset[0.2]}}],
"Piecewise",
DeleteWithContents->True,
Editable->False,
SelectWithContents->True,
Selectable->False,
StripWrapperBoxes->True]\)
ResourceFunction["Asymptotes"][f[x], x, y]](https://www.wolframcloud.com/obj/resourcesystem/images/ad8/ad846957-ea4b-4872-be92-fa22a1355ebe/10462d8ef6c379e1.png)
![Clear[f]
f[x_] := \!\(\*
TagBox[GridBox[{
{"\[Piecewise]", GridBox[{
{
RowBox[{
FractionBox["1",
RowBox[{"1", "+",
SuperscriptBox["x", "2"]}]], "+", "x"}],
RowBox[{"x", "<", "0"}]},
{
RowBox[{
SuperscriptBox["x",
RowBox[{"5", "/", "3"}]], "-", "1"}],
RowBox[{"0", "<=", "x", "<", "2"}]},
{
RowBox[{"1", "/", "x"}],
RowBox[{"2", "<", "x", "<", "3"}]},
{
RowBox[{"Cos", "[", "x", "]"}],
RowBox[{"3", "<", "x", "<", "4"}]}
},
AllowedDimensions->{2, Automatic},
Editable->True,
GridBoxAlignment->{"Columns" -> {{Left}}, "Rows" -> {{Baseline}}},
GridBoxItemSize->{"Columns" -> {{Automatic}}, "Rows" -> {{1.}}},
GridBoxSpacings->{"Columns" -> {
Offset[0.27999999999999997`], {
Offset[0.84]},
Offset[0.27999999999999997`]}, "Rows" -> {
Offset[0.2], {
Offset[0.4]},
Offset[0.2]}},
Selectable->True]}
},
GridBoxAlignment->{"Columns" -> {{Left}}, "Rows" -> {{Baseline}}},
GridBoxItemSize->{"Columns" -> {{Automatic}}, "Rows" -> {{1.}}},
GridBoxSpacings->{"Columns" -> {
Offset[0.27999999999999997`], {
Offset[0.35]},
Offset[0.27999999999999997`]}, "Rows" -> {
Offset[0.2], {
Offset[0.4]},
Offset[0.2]}}],
"Piecewise",
DeleteWithContents->True,
Editable->False,
SelectWithContents->True,
Selectable->False,
StripWrapperBoxes->True]\)
ResourceFunction["EnhancedPlot"][f[x], {x, -4, 4}, "FindExceptions" -> True, "FindAsymptotes" -> True]](https://www.wolframcloud.com/obj/resourcesystem/images/ad8/ad846957-ea4b-4872-be92-fa22a1355ebe/046d48bcacf7d3bc.png)
![Clear[f]
f[x_] := \!\(\*
TagBox[GridBox[{
{"\[Piecewise]", GridBox[{
{
RowBox[{
FractionBox["1",
RowBox[{"1", "+",
SuperscriptBox["x", "2"]}]], "+", "x"}],
RowBox[{"x", "<", "0"}]},
{
RowBox[{
SuperscriptBox["x",
RowBox[{"5", "/", "3"}]], "-", "1"}],
RowBox[{"0", "<=", "x", "<", "2"}]},
{
RowBox[{"1", "/", "x"}],
RowBox[{"2", "<", "x", "<", "3"}]},
{
RowBox[{"Cos", "[", "x", "]"}],
RowBox[{"3", "<", "x", "<", "4"}]}
},
AllowedDimensions->{2, Automatic},
Editable->True,
GridBoxAlignment->{"Columns" -> {{Left}}, "Rows" -> {{Baseline}}},
GridBoxItemSize->{"Columns" -> {{Automatic}}, "Rows" -> {{1.}}},
GridBoxSpacings->{"Columns" -> {
Offset[0.27999999999999997`], {
Offset[0.84]},
Offset[0.27999999999999997`]}, "Rows" -> {
Offset[0.2], {
Offset[0.4]},
Offset[0.2]}},
Selectable->True]}
},
GridBoxAlignment->{"Columns" -> {{Left}}, "Rows" -> {{Baseline}}},
GridBoxItemSize->{"Columns" -> {{Automatic}}, "Rows" -> {{1.}}},
GridBoxSpacings->{"Columns" -> {
Offset[0.27999999999999997`], {
Offset[0.35]},
Offset[0.27999999999999997`]}, "Rows" -> {
Offset[0.2], {
Offset[0.4]},
Offset[0.2]}}],
"Piecewise",
DeleteWithContents->True,
Editable->False,
SelectWithContents->True,
Selectable->False,
StripWrapperBoxes->True]\)
ResourceFunction["EnhancedPlot"][f[x], {x, -4, 4}, "FindExceptions" -> True]](https://www.wolframcloud.com/obj/resourcesystem/images/ad8/ad846957-ea4b-4872-be92-fa22a1355ebe/726175335be5cc93.png)

![Clear[f]
f[x_] := \!\(\*
TagBox[GridBox[{
{"\[Piecewise]", GridBox[{
{
FractionBox["1",
RowBox[{"1", "+",
RowBox[{"x", " ",
SuperscriptBox[
RadicalBox["x", "3",
MultilineFunction->None,
SurdForm->True], "2"]}]}]],
RowBox[{"x", "<",
RowBox[{"-", "1"}]}]},
{
RowBox[{"Sin", "[",
RowBox[{"4", " ", "x"}], "]"}],
RowBox[{
RowBox[{"-", "1"}], "<=", "x", "<", "0"}]},
{"0",
RowBox[{"x", "==", "0"}]},
{
RowBox[{"Sin", "[",
RowBox[{"4", " ", "x"}], "]"}],
RowBox[{"0", "<", "x", "<",
FractionBox["1", "2"]}]},
{"2",
RowBox[{
FractionBox["1", "2"], "<=", "x", "<", "1"}]},
{
FractionBox["\[Pi]", "2"],
RowBox[{"x", "==", "1"}]},
{
FractionBox["1",
RowBox[{"1", "-", "x"}]],
RowBox[{"x", ">", "1"}]}
},
AllowedDimensions->{2, Automatic},
Editable->True,
GridBoxAlignment->{"Columns" -> {{Left}}, "Rows" -> {{Baseline}}},
GridBoxItemSize->{"Columns" -> {{Automatic}}, "Rows" -> {{1.}}},
GridBoxSpacings->{"Columns" -> {
Offset[0.27999999999999997`], {
Offset[0.84]},
Offset[0.27999999999999997`]}, "Rows" -> {
Offset[0.2], {
Offset[0.4]},
Offset[0.2]}},
Selectable->True]}
},
GridBoxAlignment->{"Columns" -> {{Left}}, "Rows" -> {{Baseline}}},
GridBoxItemSize->{"Columns" -> {{Automatic}}, "Rows" -> {{1.}}},
GridBoxSpacings->{"Columns" -> {
Offset[0.27999999999999997`], {
Offset[0.35]},
Offset[0.27999999999999997`]}, "Rows" -> {
Offset[0.2], {
Offset[0.4]},
Offset[0.2]}}],
"Piecewise",
DeleteWithContents->True,
Editable->False,
SelectWithContents->True,
Selectable->False,
StripWrapperBoxes->True]\)
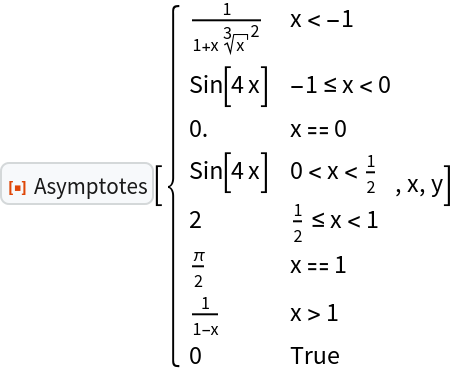
ResourceFunction["Asymptotes"][f[x], x, y]](https://www.wolframcloud.com/obj/resourcesystem/images/ad8/ad846957-ea4b-4872-be92-fa22a1355ebe/0eeb5f981910fa0b.png)
![Clear[f]
f[x_] := \!\(\*
TagBox[GridBox[{
{"\[Piecewise]", GridBox[{
{
FractionBox["1",
RowBox[{"1", "+",
RowBox[{"x", " ",
SuperscriptBox[
RadicalBox["x", "3",
MultilineFunction->None,
SurdForm->True], "2"]}]}]],
RowBox[{"x", "<",
RowBox[{"-", "1"}]}]},
{
RowBox[{"Sin", "[",
RowBox[{"4", " ", "x"}], "]"}],
RowBox[{
RowBox[{"-", "1"}], "<=", "x", "<", "0"}]},
{"0",
RowBox[{"x", "==", "0"}]},
{
RowBox[{"Sin", "[",
RowBox[{"4", " ", "x"}], "]"}],
RowBox[{"0", "<", "x", "<",
FractionBox["1", "2"]}]},
{"2",
RowBox[{
FractionBox["1", "2"], "<=", "x", "<", "1"}]},
{
FractionBox["\[Pi]", "2"],
RowBox[{"x", "==", "1"}]},
{
FractionBox["1",
RowBox[{"1", "-", "x"}]],
RowBox[{"x", ">", "1"}]}
},
AllowedDimensions->{2, Automatic},
Editable->True,
GridBoxAlignment->{"Columns" -> {{Left}}, "Rows" -> {{Baseline}}},
GridBoxItemSize->{"Columns" -> {{Automatic}}, "Rows" -> {{1.}}},
GridBoxSpacings->{"Columns" -> {
Offset[0.27999999999999997`], {
Offset[0.84]},
Offset[0.27999999999999997`]}, "Rows" -> {
Offset[0.2], {
Offset[0.4]},
Offset[0.2]}},
Selectable->True]}
},
GridBoxAlignment->{"Columns" -> {{Left}}, "Rows" -> {{Baseline}}},
GridBoxItemSize->{"Columns" -> {{Automatic}}, "Rows" -> {{1.}}},
GridBoxSpacings->{"Columns" -> {
Offset[0.27999999999999997`], {
Offset[0.35]},
Offset[0.27999999999999997`]}, "Rows" -> {
Offset[0.2], {
Offset[0.4]},
Offset[0.2]}}],
"Piecewise",
DeleteWithContents->True,
Editable->False,
SelectWithContents->True,
Selectable->False,
StripWrapperBoxes->True]\)
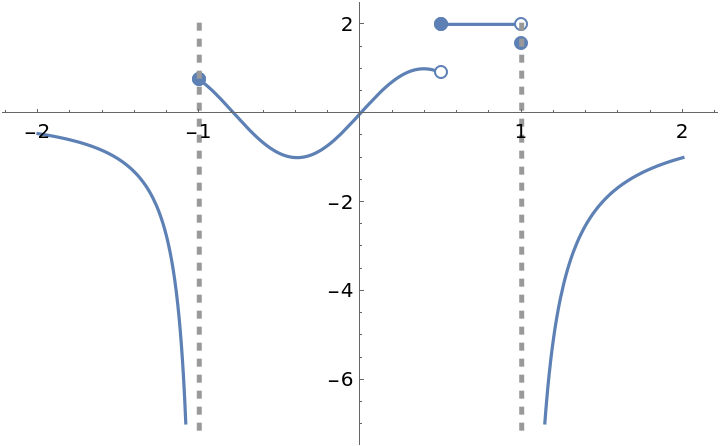
ResourceFunction["EnhancedPlot"][f[x], {x, -2, 2}, "FindExceptions" -> True]](https://www.wolframcloud.com/obj/resourcesystem/images/ad8/ad846957-ea4b-4872-be92-fa22a1355ebe/5046abac6202ff2c.png)
![Clear[g]
g[x_] := \!\(\*
TagBox[GridBox[{
{"\[Piecewise]", GridBox[{
{
FractionBox["1",
RowBox[{"1", "+",
RowBox[{"x", " ",
SuperscriptBox[
RadicalBox["x", "3",
MultilineFunction->None,
SurdForm->True], "2"]}]}]],
RowBox[{"x", "<",
RowBox[{"-", "1"}]}]},
{
RadicalBox[
SuperscriptBox["x", "5"], "3",
MultilineFunction->None,
SurdForm->True],
RowBox[{
RowBox[{"-", "1"}], "<", "x", "<", "2"}]},
{"0",
RowBox[{"2", "<=", "x", "<", "2.5"}]},
{
RowBox[{"Cos", "[",
RowBox[{"\[Pi]", " ", "x"}], "]"}],
RowBox[{"4", "<=", "x", "<",
RowBox[{"2", "\[Pi]"}]}]}
},
AllowedDimensions->{2, Automatic},
Editable->True,
GridBoxAlignment->{"Columns" -> {{Left}}, "Rows" -> {{Baseline}}},
GridBoxItemSize->{"Columns" -> {{Automatic}}, "Rows" -> {{1.}}},
GridBoxSpacings->{"Columns" -> {
Offset[0.27999999999999997`], {
Offset[0.84]},
Offset[0.27999999999999997`]}, "Rows" -> {
Offset[0.2], {
Offset[0.4]},
Offset[0.2]}},
Selectable->True]}
},
GridBoxAlignment->{"Columns" -> {{Left}}, "Rows" -> {{Baseline}}},
GridBoxItemSize->{"Columns" -> {{Automatic}}, "Rows" -> {{1.}}},
GridBoxSpacings->{"Columns" -> {
Offset[0.27999999999999997`], {
Offset[0.35]},
Offset[0.27999999999999997`]}, "Rows" -> {
Offset[0.2], {
Offset[0.4]},
Offset[0.2]}}],
"Piecewise",
DeleteWithContents->True,
Editable->False,
SelectWithContents->True,
Selectable->False,
StripWrapperBoxes->True]\)
h[x_] := \!\(\*
TagBox[GridBox[{
{"\[Piecewise]", GridBox[{
{"1",
RowBox[{"x", "<", "4"}]},
{"2",
RowBox[{"x", ">", "4"}]}
},
AllowedDimensions->{2, Automatic},
Editable->True,
GridBoxAlignment->{"Columns" -> {{Left}}, "ColumnsIndexed" -> {}, "Rows" -> {{Baseline}}, "RowsIndexed" -> {}},
GridBoxItemSize->{"Columns" -> {{Automatic}}, "ColumnsIndexed" -> {}, "Rows" -> {{1.}}, "RowsIndexed" -> {}},
GridBoxSpacings->{"Columns" -> {
Offset[0.27999999999999997`], {
Offset[0.84]},
Offset[0.27999999999999997`]}, "ColumnsIndexed" -> {}, "Rows" -> {
Offset[0.2], {
Offset[0.4]},
Offset[0.2]}, "RowsIndexed" -> {}},
Selectable->True]}
},
GridBoxAlignment->{"Columns" -> {{Left}}, "ColumnsIndexed" -> {}, "Rows" -> {{Baseline}}, "RowsIndexed" -> {}},
GridBoxItemSize->{"Columns" -> {{Automatic}}, "ColumnsIndexed" -> {}, "Rows" -> {{1.}}, "RowsIndexed" -> {}},
GridBoxSpacings->{"Columns" -> {
Offset[0.27999999999999997`], {
Offset[0.35]},
Offset[0.27999999999999997`]}, "ColumnsIndexed" -> {}, "Rows" -> {
Offset[0.2], {
Offset[0.4]},
Offset[0.2]}, "RowsIndexed" -> {}}],
"Piecewise",
DeleteWithContents->True,
Editable->False,
SelectWithContents->True,
Selectable->False,
StripWrapperBoxes->True]\)
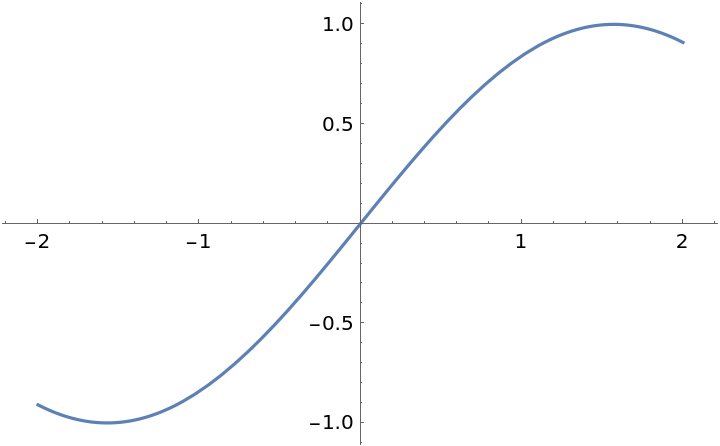
ResourceFunction["EnhancedPlot"][{g[x], h[x]}, {x, -2, 2 \[Pi]}, "FindExceptions" -> True, PlotStyle -> Thick]](https://www.wolframcloud.com/obj/resourcesystem/images/ad8/ad846957-ea4b-4872-be92-fa22a1355ebe/38751274a369f072.png)