Wolfram Function Repository
Instant-use add-on functions for the Wolfram Language
Function Repository Resource:
Compute the asymptotes to a given curve in two dimensions
ResourceFunction["Asymptotes"][expr,x,y] finds the asymptotes of the expression expr in terms of independent variable x and dependent variable y. | |
ResourceFunction["Asymptotes"][expr,x,y,type] finds the asymptotes of expr whose type matches the string argument type. |
Compute the asymptotes of a decaying exponential:
| In[1]:= |
| Out[1]= |
| In[2]:= |
| Out[2]= | 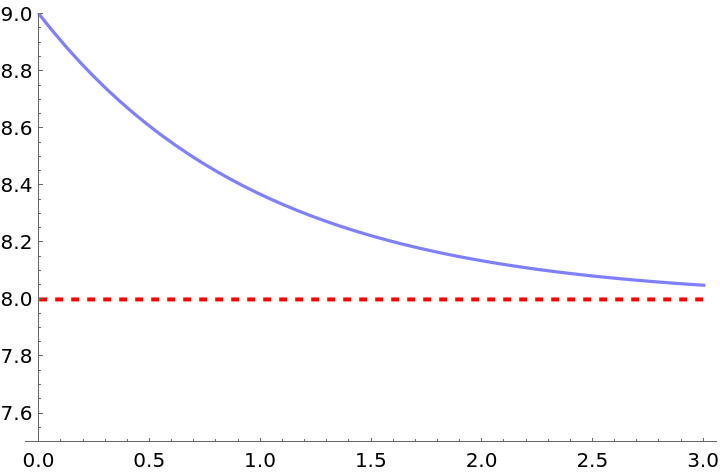 |
Compute the asymptotes of a hyperbola:
| In[3]:= |
| Out[3]= |
| In[4]:= | ![Plot[{1/x, 0}, {x, -3.5, 3.5}, PlotRange -> {-3.5, 3.5}, PlotStyle -> {Lighter[Blue, 0.5], {{Red, Dashed, Thick}}}, ExclusionsStyle -> {{Red, Dashed, Thick}, {PointSize -> 0.0}}]](https://www.wolframcloud.com/obj/resourcesystem/images/e24/e24c673d-3b75-496a-a2ab-20cb3a5fd000/41309aebd7cb7866.png) |
| Out[4]= | 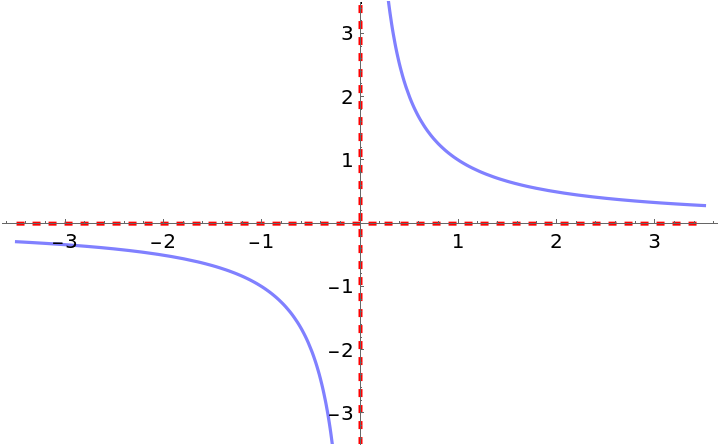 |
Compute the asymptotes of a rational function:
| In[5]:= |
| Out[5]= |
| In[6]:= |
| Out[6]= | 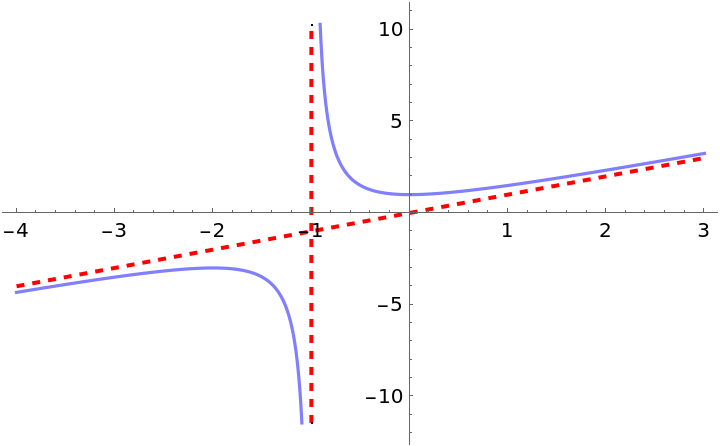 |
Compute only the oblique asymptotes of the previous function:
| In[7]:= |
| Out[7]= |
Compute the asymptotes of a periodic function:
| In[8]:= |
| Out[8]= |
| In[9]:= |
| Out[9]= | 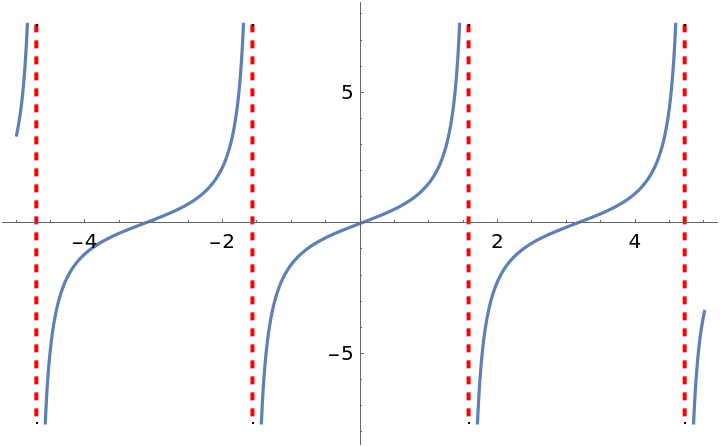 |
Compute the asymptotes of an algebraic function:
| In[10]:= |
| Out[10]= |
| In[11]:= |
| Out[11]= | 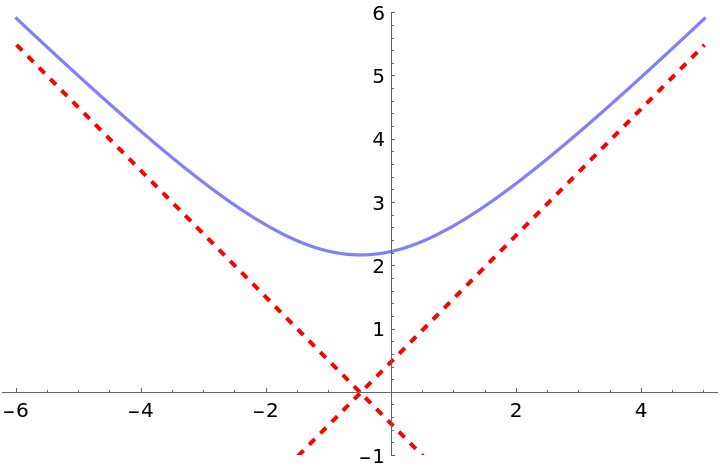 |
Compute a list of all asymptotes of the previous function:
| In[12]:= |
| Out[12]= |
Compute the asymptotes of another algebraic function:
| In[13]:= |
| Out[13]= |
| In[14]:= |
| Out[14]= | 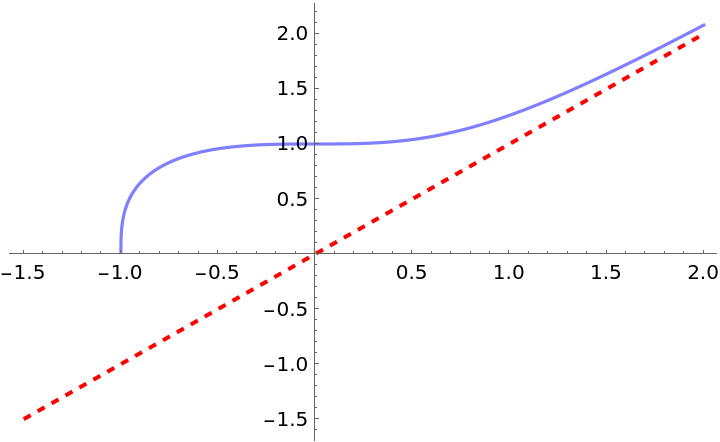 |
Compute the asymptotes of a transcendental function:
| In[15]:= |
| Out[15]= |
| In[16]:= |
| Out[16]= | 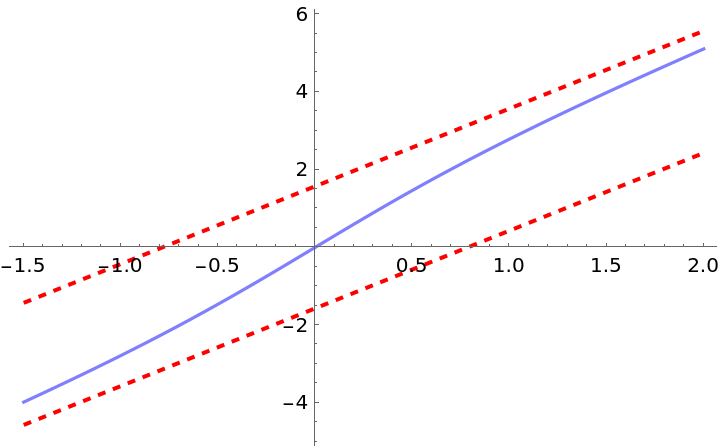 |
Implicitly defined curves can be specified using an expression with head Equal in the first argument:
| In[17]:= |
| Out[17]= |
| In[18]:= |
| Out[18]= |
In certain cases, parabolic asymptotes may be returned:
| In[19]:= |
| Out[19]= |
| In[20]:= |
| Out[20]= | 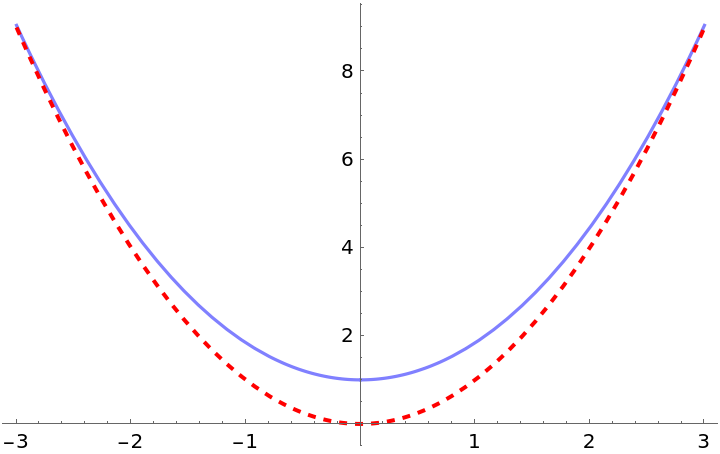 |
| In[21]:= |
| Out[21]= |
| In[22]:= | ![Plot[{(x^3 + 2 x^2 + 3 x + 4)/x, 3 + 2 x + x^2}, {x, -3, 3}, PlotStyle -> {Lighter[Blue, 0.5], {{Red, Dashed, Thick}}}, ExclusionsStyle -> {{Red, Dashed, Thick}, {PointSize -> 0.0}}]](https://www.wolframcloud.com/obj/resourcesystem/images/e24/e24c673d-3b75-496a-a2ab-20cb3a5fd000/70060c5482bba2e7.png) |
| Out[22]= | 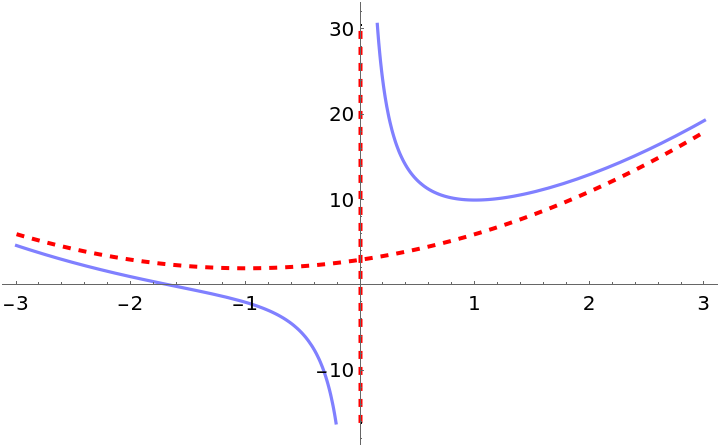 |
| In[23]:= |
| Out[23]= |
| In[24]:= | ![Plot[{(x^4 - 2 x^3 + 1)/x^2, -2 x + x^2}, {x, -3, 3}, PlotStyle -> {Lighter[Blue, 0.5], {{Red, Dashed, Thick}}}, ExclusionsStyle -> {{Red, Dashed, Thick}, {PointSize -> 0.02}}]](https://www.wolframcloud.com/obj/resourcesystem/images/e24/e24c673d-3b75-496a-a2ab-20cb3a5fd000/5b47e803d38c3972.png) |
| Out[24]= | 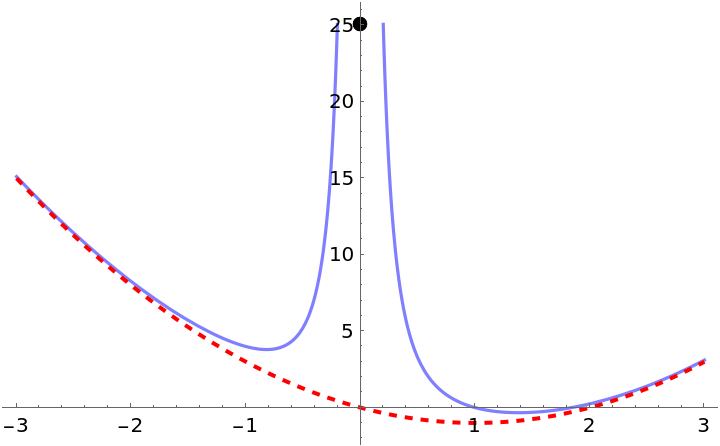 |
| In[25]:= |
| Out[25]= |
| In[26]:= |
| Out[26]= | 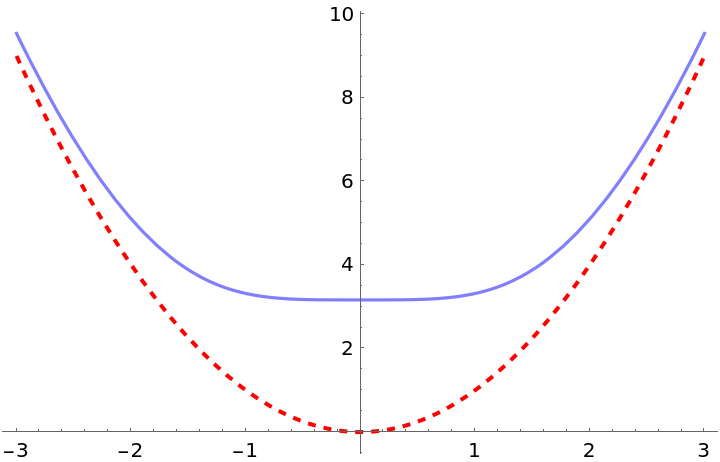 |
Asymptotes found that are neither linear or parabolic are classified as "Other":
| In[27]:= |
| Out[27]= |
| In[28]:= | ![Plot[{(37 x^5 + 2 x^2 + 3 x + 4)/(x^2 - x - 1), 113 + 74 x + 37 x^2 + 37 x^3}, {x, -3, 3}, PlotStyle -> {Lighter[Blue, 0.5], {{Red, Dashed, Thick}}}, ExclusionsStyle -> {{Red, Dashed, Thick}, {PointSize -> 0.02}}]](https://www.wolframcloud.com/obj/resourcesystem/images/e24/e24c673d-3b75-496a-a2ab-20cb3a5fd000/3bfc17643db7376b.png) |
| Out[28]= | 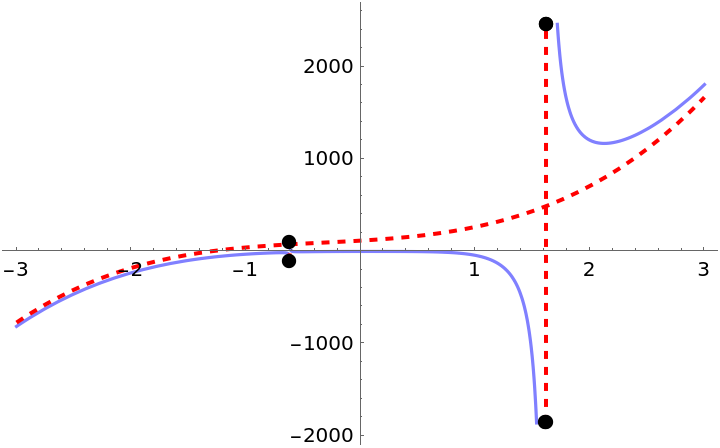 |
| In[29]:= |
| Out[29]= |
| In[30]:= |
| Out[30]= | 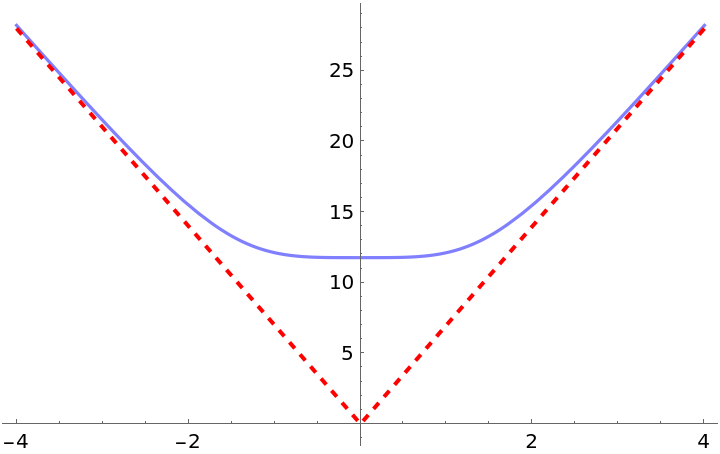 |
This work is licensed under a Creative Commons Attribution 4.0 International License