Wolfram Function Repository
Instant-use add-on functions for the Wolfram Language
Function Repository Resource:
Compute the regions on which an expression is monotonic
| ResourceFunction["FunctionMonotonicity"][f,x] returns an association of information about where f is increasing, decreasing or constant with respect to x. | |
| ResourceFunction["FunctionMonotonicity"][f,x,property] returns a specific property related to whether f is increasing, decreasing or constant with respect to x. | 
Compute the regions on which a curve is increasing, decreasing and constant:
| In[1]:= | ![ResourceFunction[
 "FunctionMonotonicity", ResourceSystemBase -> "https://www.wolframcloud.com/obj/resourcesystem/api/1.0"][(x + 2)^2 (x - 2)^2, x]](https://www.wolframcloud.com/obj/resourcesystem/images/a44/a4427158-10ce-4dc8-8f1d-f0c5a5a86536/14fb4b9a1ad70bd5.png) | 
| Out[1]= |  | 
Show plots as well as the regions:
| In[2]:= | ![ResourceFunction[
 "FunctionMonotonicity", ResourceSystemBase -> "https://www.wolframcloud.com/obj/resourcesystem/api/1.0"][(x + 2)^2 (x - 2)^2, x, All]](https://www.wolframcloud.com/obj/resourcesystem/images/a44/a4427158-10ce-4dc8-8f1d-f0c5a5a86536/67ac0afbd836f45a.png) | 
| Out[2]= |  | 
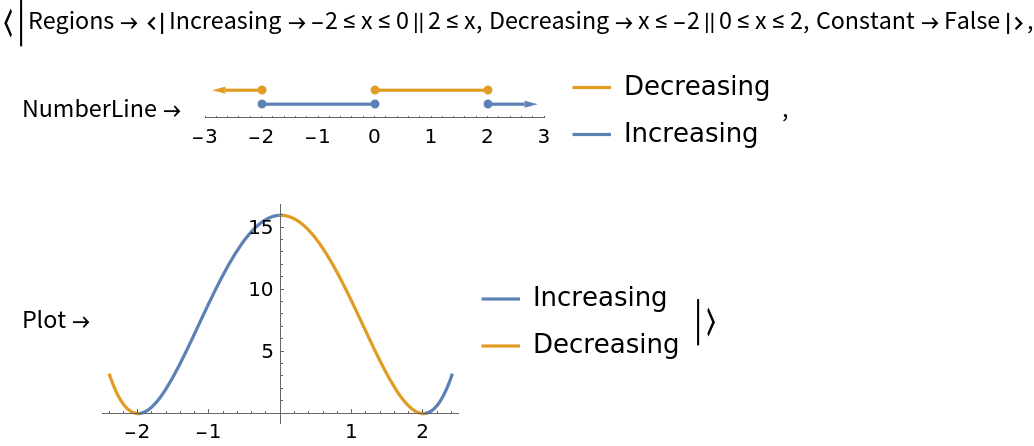
FunctionMonotonicity returns strict regions of increasing and decreasing, as can be seen in this piecewise expression:
| In[3]:= | ![f = Piecewise[{{x, x <= 0}, {0, 0 < x < 1}, {x - 1, x > 1}}];](https://www.wolframcloud.com/obj/resourcesystem/images/a44/a4427158-10ce-4dc8-8f1d-f0c5a5a86536/56d07f334f819bfc.png) | 
| In[4]:= | ![ResourceFunction[
 "FunctionMonotonicity", ResourceSystemBase -> "https://www.wolframcloud.com/obj/resourcesystem/api/1.0"][f, x, "Increasing"]](https://www.wolframcloud.com/obj/resourcesystem/images/a44/a4427158-10ce-4dc8-8f1d-f0c5a5a86536/5a00fc5629ceb57c.png) | 
| Out[4]= |  | 
| In[5]:= | ![ResourceFunction[
 "FunctionMonotonicity", ResourceSystemBase -> "https://www.wolframcloud.com/obj/resourcesystem/api/1.0"][f, x, "Plot"]](https://www.wolframcloud.com/obj/resourcesystem/images/a44/a4427158-10ce-4dc8-8f1d-f0c5a5a86536/5073965d102e01cf.png) | 
| Out[5]= |  | 
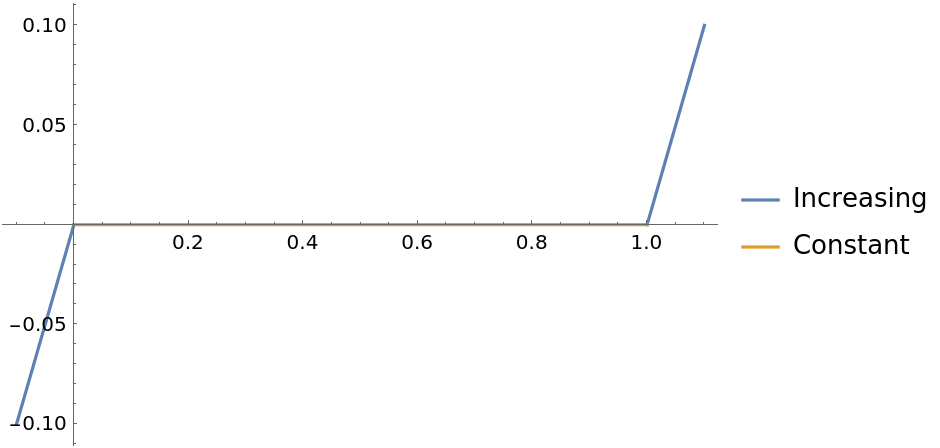
Return the "NumberLine" property to visualize the regions directly:
| In[6]:= | ![ResourceFunction[
 "FunctionMonotonicity", ResourceSystemBase -> "https://www.wolframcloud.com/obj/resourcesystem/api/1.0"][
 x^5 - 10 x^4 + 10 x^3 - x^2 - x, x, "NumberLine"]](https://www.wolframcloud.com/obj/resourcesystem/images/a44/a4427158-10ce-4dc8-8f1d-f0c5a5a86536/64844f05bdb0e6af.png) | 
| Out[6]= |  | 
Or return the "Plot" property to visualize the regions on the plot of the curve:
| In[7]:= | ![ResourceFunction[
 "FunctionMonotonicity", ResourceSystemBase -> "https://www.wolframcloud.com/obj/resourcesystem/api/1.0"][x^5 - 10 x^4 + 10 x^3 - x^2 - x, x, "Plot"]](https://www.wolframcloud.com/obj/resourcesystem/images/a44/a4427158-10ce-4dc8-8f1d-f0c5a5a86536/204076d8578966a7.png) | 
| Out[7]= |  | 
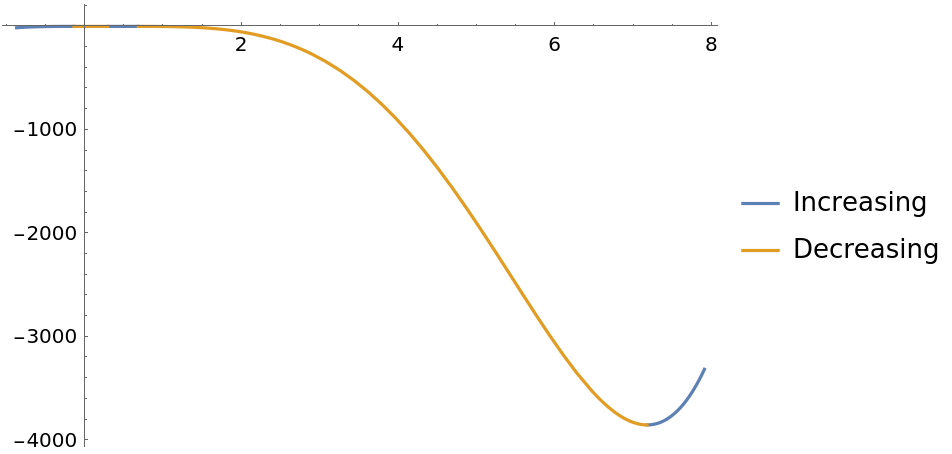
Note that a curve can be both increasing and decreasing at a given point:
| In[8]:= | ![ResourceFunction[
 "FunctionMonotonicity", ResourceSystemBase -> "https://www.wolframcloud.com/obj/resourcesystem/api/1.0"][x^2, x]](https://www.wolframcloud.com/obj/resourcesystem/images/a44/a4427158-10ce-4dc8-8f1d-f0c5a5a86536/39012709a3cd092f.png) | 
| Out[8]= |  | 
In this case, 0 is a member of both the increasing and decreasing regions. To test that this is true against the definition of a curve being strictly increasing for x≥0, use Resolve:
| In[9]:= | ![Resolve[ForAll[{x, y}, {x, y} \[Element] Reals && x >= 0 && y >= 0, Implies[x < y, x^2 < y^2]]]](https://www.wolframcloud.com/obj/resourcesystem/images/a44/a4427158-10ce-4dc8-8f1d-f0c5a5a86536/1d1d95fd2b7939e4.png) | 
| Out[9]= |  | 
Likewise to test if the curve is decreasing for x≤0:
| In[10]:= | ![Resolve[ForAll[{x, y}, {x, y} \[Element] Reals && x <= 0 && y <= 0, Implies[x < y, x^2 > y^2]]]](https://www.wolframcloud.com/obj/resourcesystem/images/a44/a4427158-10ce-4dc8-8f1d-f0c5a5a86536/151c218bf4a7cbdf.png) | 
| Out[10]= |  | 
This work is licensed under a Creative Commons Attribution 4.0 International License