Examples
Basic Examples (2)
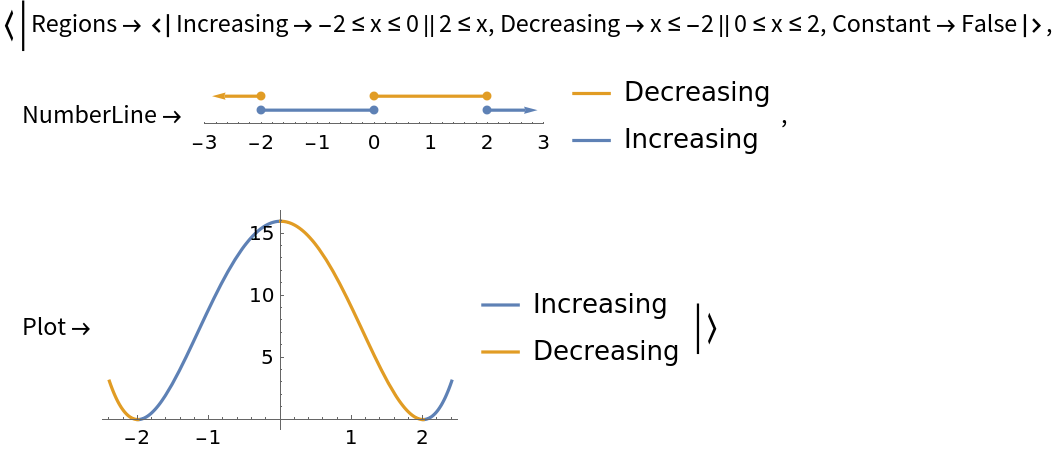
Compute the regions on which a curve is increasing, decreasing and constant:
Show plots as well as the regions:
Scope (3)
FunctionMonotonicity returns strict regions of increasing and decreasing, as can be seen in this piecewise expression:
Return the "NumberLine" property to visualize the regions directly:
Or return the "Plot" property to visualize the regions on the plot of the curve:
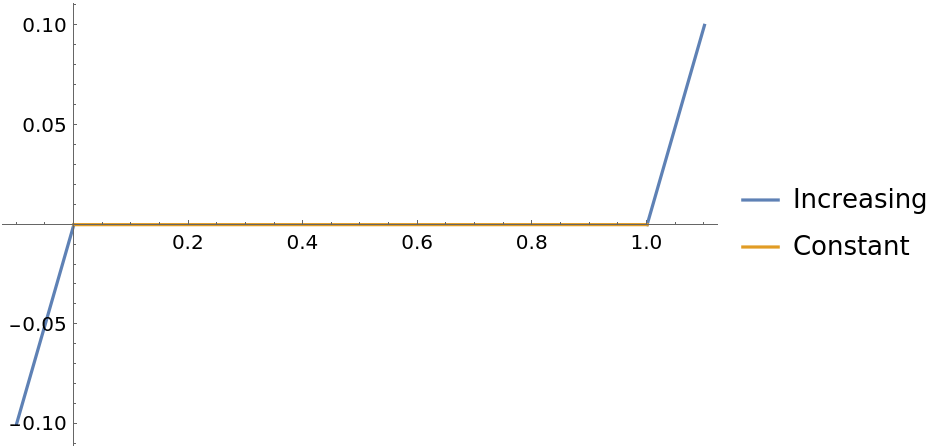
Note that a curve can be both increasing and decreasing at a given point:
In this case, 0 is a member of both the increasing and decreasing regions. To test that this is true against the definition of a curve being strictly increasing for x≥0, use Resolve:
Likewise to test if the curve is decreasing for x≤0:
Possible Issues (3)
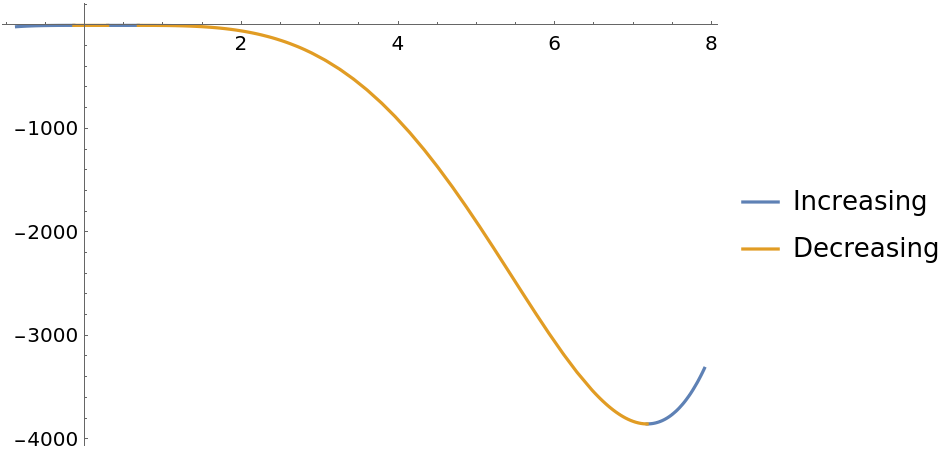
Working with the absolute value function Abs may return unexpected results:
This is due to the assumption of Complex inputs to Abs in comparison to RealAbs:
Using RealAbs returns the expected results:
Publisher
Wolfram|Alpha Math Team
Version History
-
3.0.1
– 27 March 2023
-
3.0.0
– 23 March 2023
-
2.0.0
– 23 March 2023
-
1.0.0
– 29 September 2020
Related Resources
Author Notes
To view the full source code for FunctionMontonicity, run the following code:


