Function Repository Resource:

FunctionMonotonicity (2.0.0) current version: 3.0.1 »

Source Notebook

Compute the regions on which an expression is monotonic

Contributed by: Wolfram|Alpha Math Team

ResourceFunction["FunctionMonotonicity"][f,x]

returns an association of information about where f is increasing, decreasing or constant with respect to x.

ResourceFunction["FunctionMonotonicity"][f,x,property]

returns a specific property related to whether f is increasing, decreasing or constant with respect to x.

Details and Options

ResourceFunction["FunctionMonotonicity"] expects f to be a univariate expression in terms of x, similar to what might be entered into Plot.
ResourceFunction["FunctionMonotonicity"] returns regions on which f is strictly monotonic, that is, f is strictly increasing on an interval A if for all {x,y}A such that x<y, it is the case that f[x]<f[y].
The input property can be any of All, "Increasing", "Decreasing", "Constant", "Regions", "Plot" or "NumberLine", and defaults to "Regions".

Examples

Basic Examples (2) 

Compute the regions on which a curve is increasing, decreasing and constant:

In[1]:=
ResourceFunction["FunctionMonotonicity"][(x + 2)^2 (x - 2)^2, x]
Out[1]=

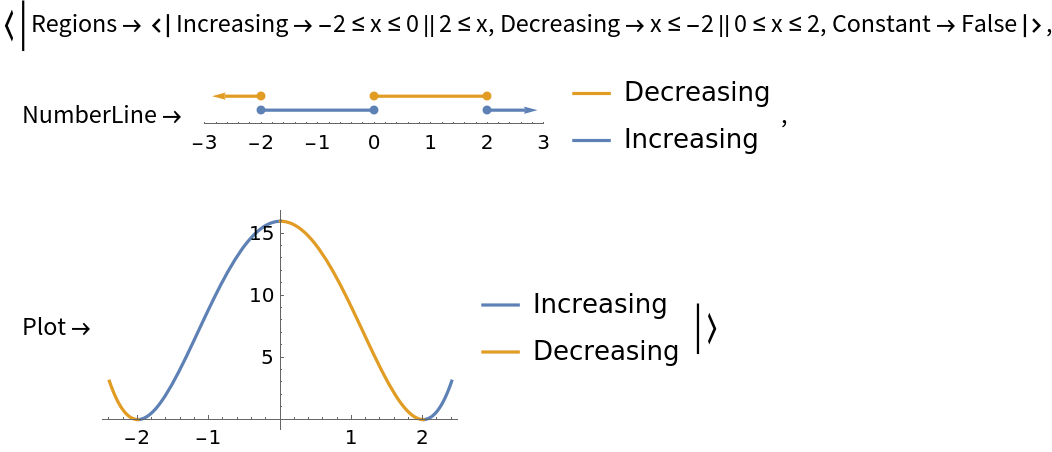
Show plots as well as the regions:

In[2]:=
ResourceFunction["FunctionMonotonicity"][(x + 2)^2 (x - 2)^2, x, All]
Out[2]=

Scope (3) 

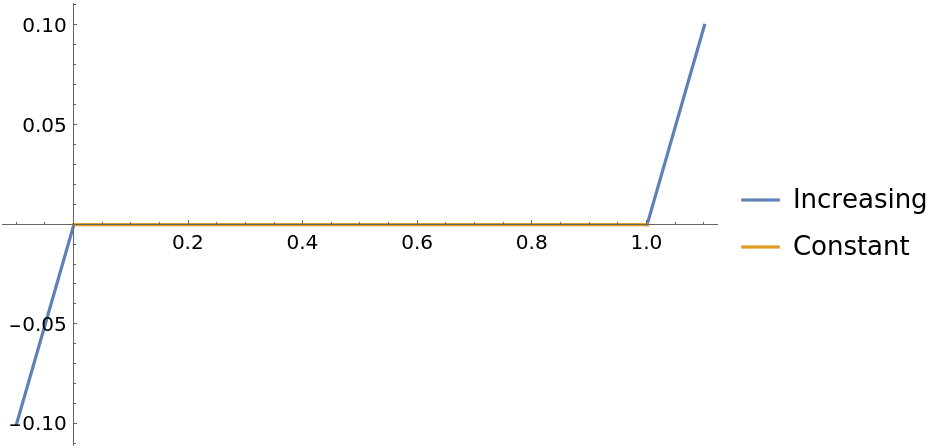
FunctionMonotonicity returns strict regions of increasing and decreasing, as can be seen in this piecewise expression:

In[3]:=
f = Piecewise[{{x, x <= 0}, {0, 0 < x < 1}, {x - 1, x > 1}}];
In[4]:=
ResourceFunction["FunctionMonotonicity"][f, x, "Increasing"]
Out[4]=
In[5]:=
ResourceFunction["FunctionMonotonicity"][f, x, "Plot"]
Out[5]=

Return the "NumberLine" property to visualize the regions directly:

In[6]:=
ResourceFunction["FunctionMonotonicity"][
 x^5 - 10 x^4 + 10 x^3 - x^2 - x, x, "NumberLine"]
Out[6]=

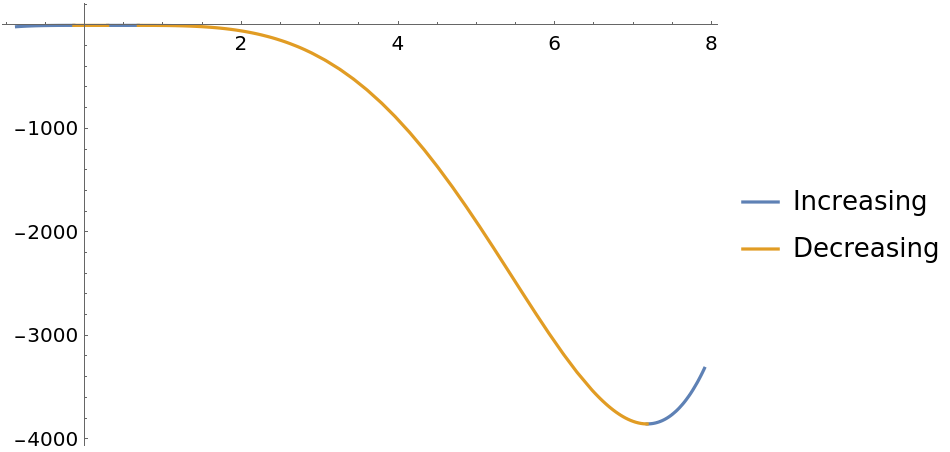
Or return the "Plot" property to visualize the regions on the plot of the curve:

In[7]:=
ResourceFunction["FunctionMonotonicity"][
 x^5 - 10 x^4 + 10 x^3 - x^2 - x, x, "Plot"]
Out[7]=

Note that a curve can be both increasing and decreasing at a given point:

In[8]:=
ResourceFunction["FunctionMonotonicity"][x^2, x]
Out[8]=

In this case, 0 is a member of both the increasing and decreasing regions. To test that this is true against the definition of a curve being strictly increasing for x0, use Resolve:

In[9]:=
Resolve[ForAll[{x, y}, {x, y} \[Element] Reals && x >= 0 && y >= 0, Implies[x < y, x^2 < y^2]]]
Out[9]=

Likewise to test if the curve is decreasing for x0:

In[10]:=
Resolve[ForAll[{x, y}, {x, y} \[Element] Reals && x <= 0 && y <= 0, Implies[x < y, x^2 > y^2]]]
Out[10]=

Possible Issues (3) 

Working with the absolute value function Abs may return unexpected results:

In[11]:=
ResourceFunction["FunctionMonotonicity"][Abs[x], x]
Out[11]=

This is due to the assumption of Complex inputs to Abs in comparison to RealAbs:

In[12]:=
{D[Abs[x], x], D[RealAbs[x], x]}
Out[12]=

Using RealAbs returns the expected results:

In[13]:=
ResourceFunction["FunctionMonotonicity"][RealAbs[x], x]
Out[13]=

Publisher

Wolfram|Alpha Math Team

Version History

  • 3.0.1 – 27 March 2023
  • 3.0.0 – 23 March 2023
  • 2.0.0 – 23 March 2023
  • 1.0.0 – 29 September 2020

Related Resources

Author Notes

To view the full source code for FunctionMontonicity, run the following code:
In[1]:=
FileNameJoin[
  ReplacePart[
   FileNameSplit[FindFile["ResourceFunctionHelpers`"]], -1 -> "FunctionMonotonicityConcavity.wl"]] // SystemOpen

License Information