Wolfram Function Repository
Instant-use add-on functions for the Wolfram Language
Function Repository Resource:
Animate time series as bar charts
ResourceFunction["RankedTimeSeriesBarChart"][{ts1,ts2.…}] creates an animated BarChart visualization of the time series tsi. | |
ResourceFunction["RankedTimeSeriesBarChart"][{ts1,ts2.…},{min,max}] animates over the specified timespan min–max. | |
ResourceFunction["RankedTimeSeriesBarChart"][{ts1,ts2.…},{min,max,delta}] uses step size delta. | |
ResourceFunction["RankedTimeSeriesBarChart"][{ts1,ts2.…},{{t1,t2,…}}] shows values only at the specified times. |
| "AnimateOptions" | {} | options for Animate |
| BarOrigin | Left | origin placement for bars |
| ChartLabels | Automatic | labels for data elements |
| ChartStyle | Automatic | by default, colors each element consistently throughout animation |
| "PlotLabelFunction" | Automatic | function to create a plot label from the timestamp |
| PlotRange | Full | range to show while animating |
| "RankingFunction" | Sort | function to rank bars |
Create an animation of two time series:
| In[1]:= |
| Out[1]= | 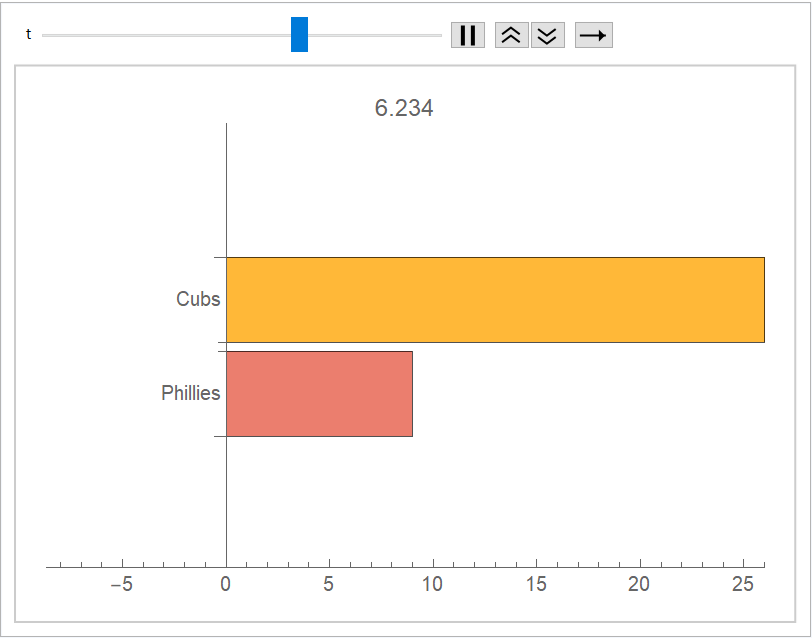 |
Create an animation of GDP per capita for a few countries over a few decades:
| In[2]:= | ![gdps = AssociationMap[#[
EntityProperty[
"Country", "GDP", {"CurrencyUnit" -> "CurrentUSDollar", "Date" -> Interval[{
DateObject[{1970}, "Year", "Gregorian", -5.],
DateObject[{2020}, "Year", "Gregorian", -5.]}], "PerCapita" -> "PerCapita"}]] &, {Entity["Country", "UnitedStates"], Entity["Country", "China"], Entity["Country", "UnitedKingdom"], Entity["Country", "France"], Entity["Country", "Germany"]}]](https://www.wolframcloud.com/obj/resourcesystem/images/21f/21fd743b-56d1-4db6-b15e-d7c6d65e7b94/3dcb97811dd82ac7.png) |
| Out[2]= | 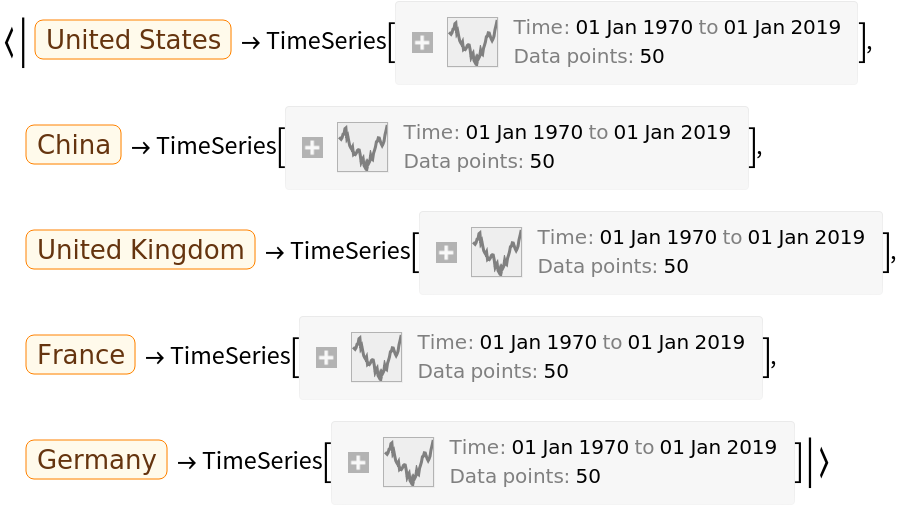 |
| In[3]:= |
| Out[3]= | 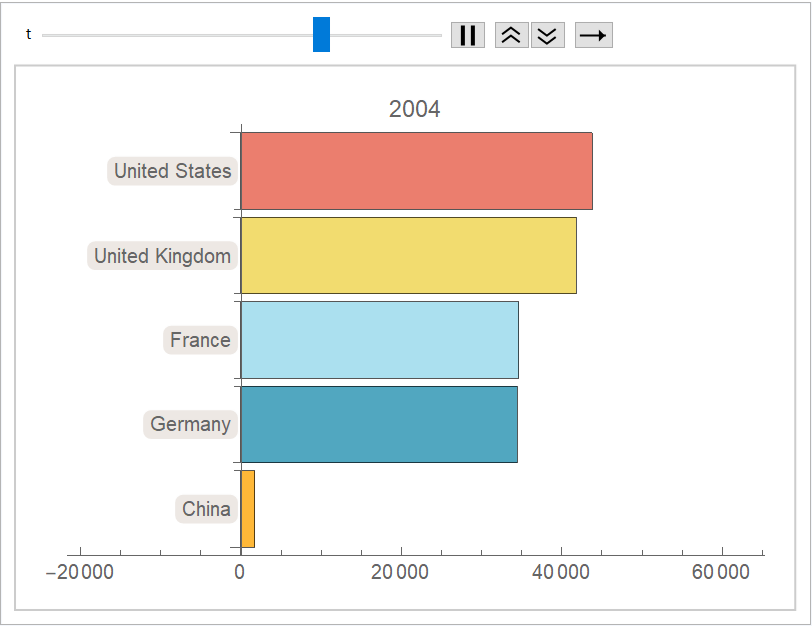 |
Create an animation for a list of raw data sequences. Note that integer labels are automatically assigned:
| In[4]:= |
| Out[4]= | 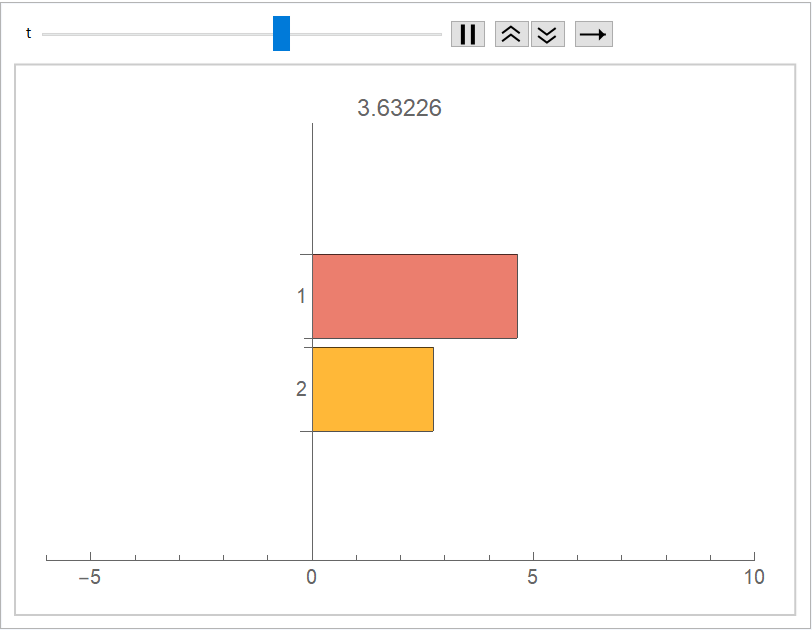 |
Retrieve data on COVID-19 cases from five random countries:
| In[5]:= | ![coviddata = Association@Normal@ResourceData[\!\(\*
TagBox["\"\<Epidemic Data for Novel Coronavirus COVID-19\>\"",
#& ,
BoxID -> "ResourceTag-Epidemic Data for Novel Coronavirus COVID-19-Input",
AutoDelete->True]\), "WorldCountries"][
RandomSample[#, 5] &, #Country -> #ConfirmedCases &]](https://www.wolframcloud.com/obj/resourcesystem/images/21f/21fd743b-56d1-4db6-b15e-d7c6d65e7b94/789905abeb8eac19.png) |
| Out[5]= | 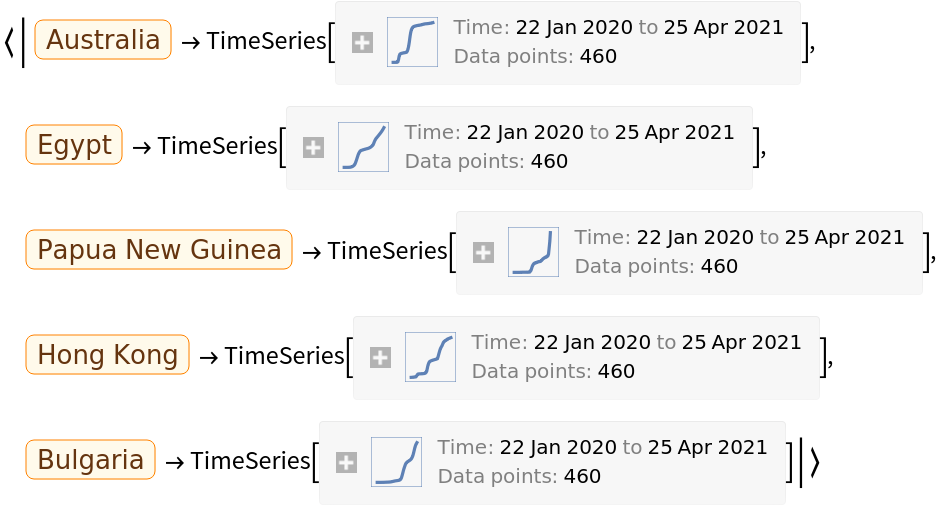 |
Animate the full data:
| In[6]:= |
| Out[6]= | 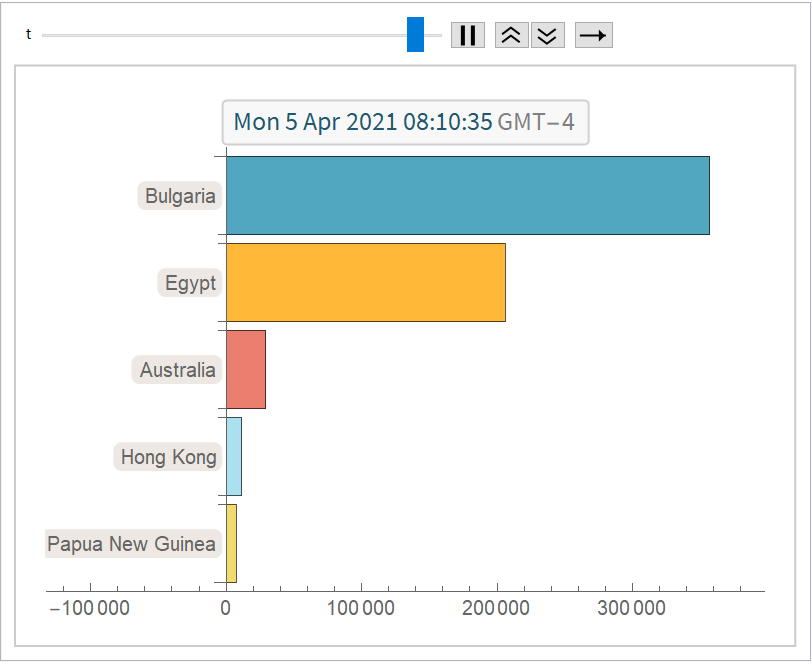 |
Animate only over a specific date range:
| In[7]:= |
| Out[7]= | 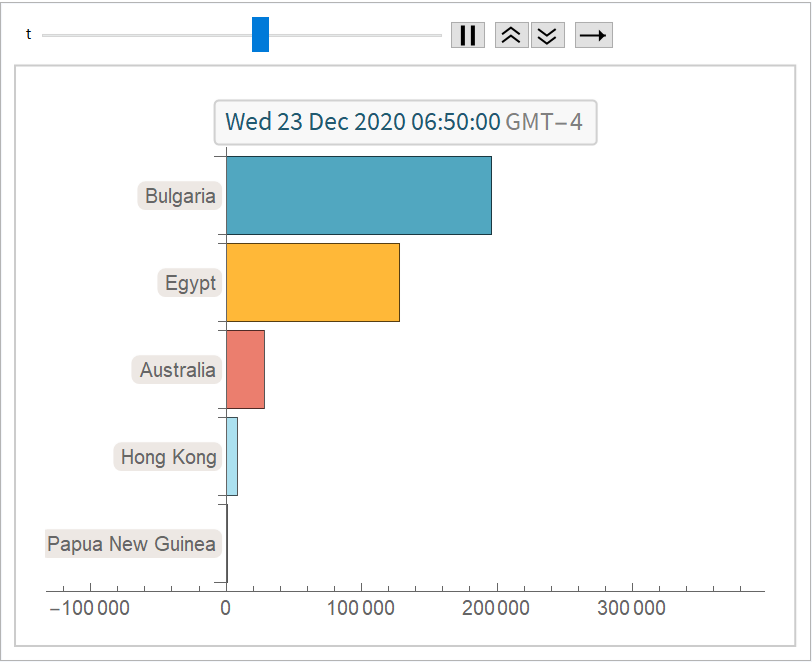 |
Animate at specific times:
| In[8]:= | ![ResourceFunction[
"RankedTimeSeriesBarChart"][coviddata, {{DateObject[{2020, 10, 1}, "Day", "Gregorian", -5.`], DateObject[{2020, 11, 11}, "Day", "Gregorian", -5.`], DateObject[{2020, 12, 25}, "Day", "Gregorian", -5.`], DateObject[{2021, 3, 1}, "Day", "Gregorian", -5.`]}}]](https://www.wolframcloud.com/obj/resourcesystem/images/21f/21fd743b-56d1-4db6-b15e-d7c6d65e7b94/21a61fdbd6584f27.png) |
| Out[8]= | 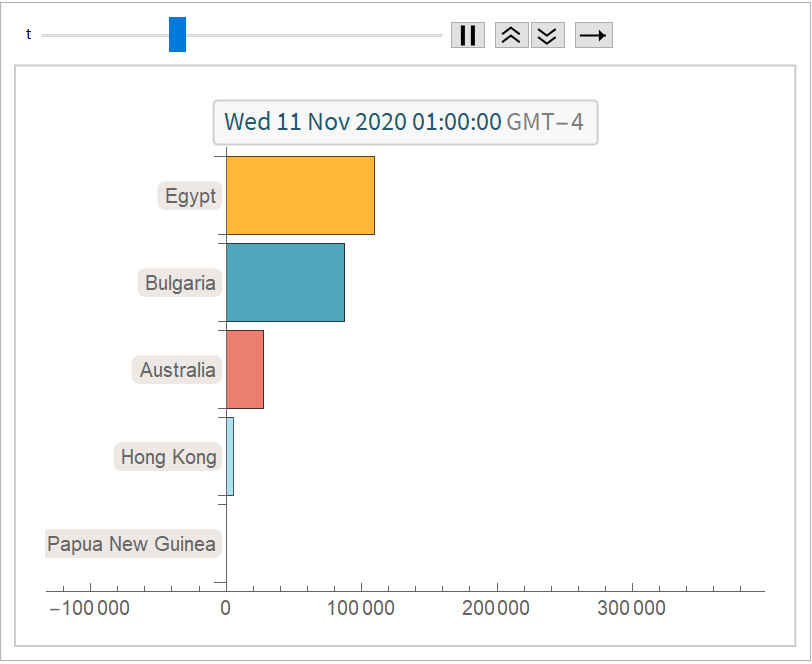 |
Animate the highest scoring Major League Baseball game ever by directly specifying the time steps:
| In[9]:= |
| Out[9]= | 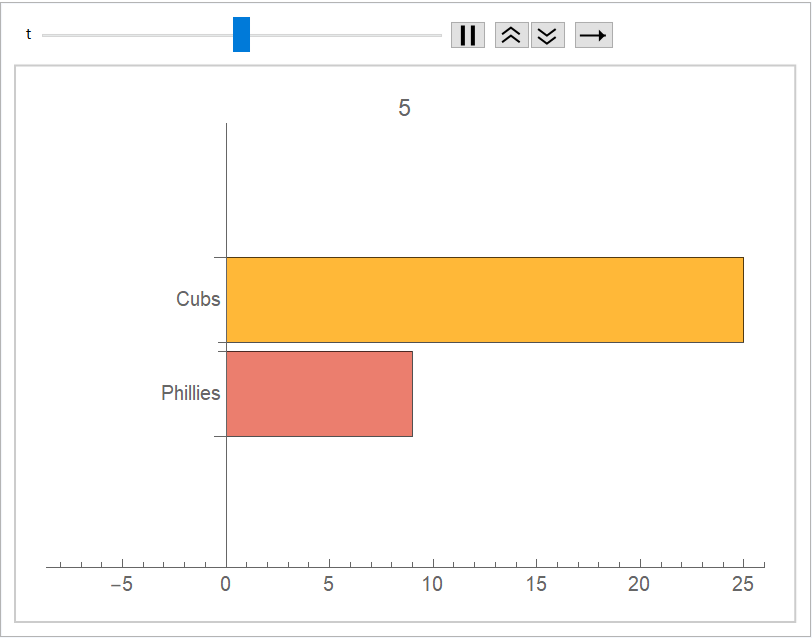 |
All options to Animate are accepted as suboptions using "AnimateOptions":
| In[10]:= | ![ResourceFunction["RankedTimeSeriesBarChart"][
RandomReal[1000, {3, 100}], "AnimateOptions" -> {AnimationRate -> 1, AnimationDirection -> Backward, AnimationRunning -> False}]](https://www.wolframcloud.com/obj/resourcesystem/images/21f/21fd743b-56d1-4db6-b15e-d7c6d65e7b94/6d8773bb5fb386be.png) |
| Out[10]= | 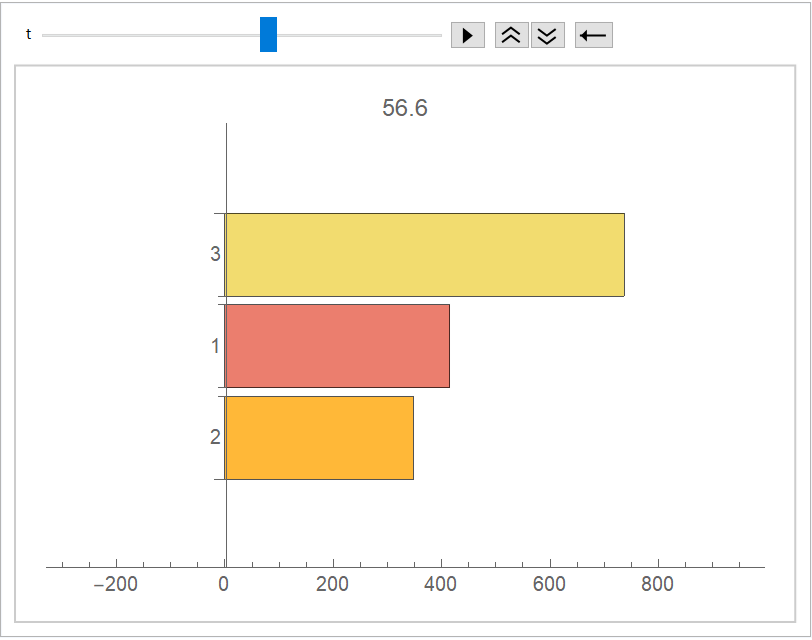 |
By default, chart labels are always shown, even when none are supplied:
| In[12]:= |
| Out[12]= | 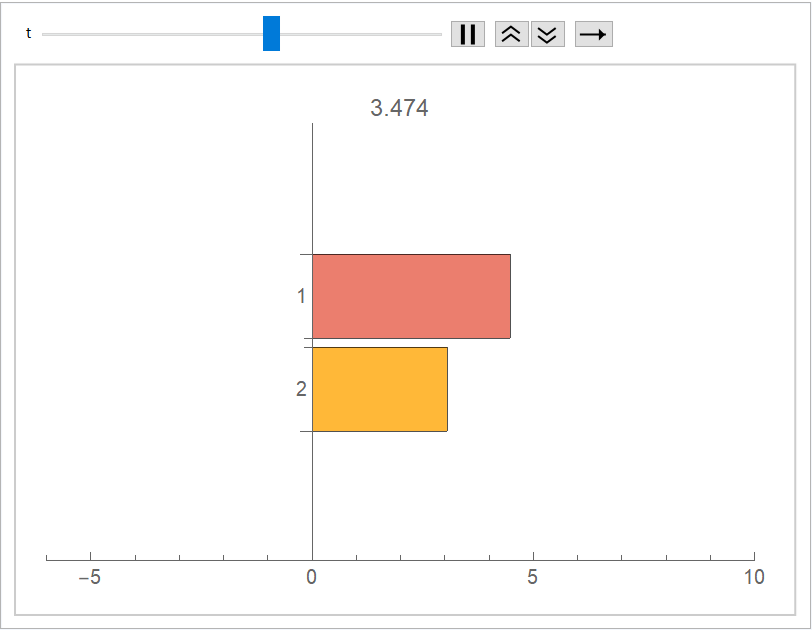 |
Use the ChartLabels option to remove the labels:
| In[13]:= |
| Out[13]= | 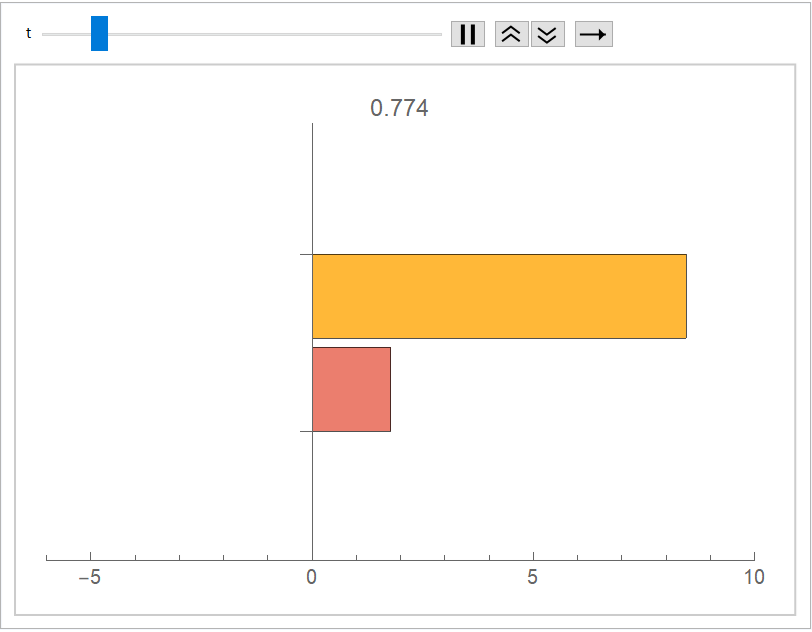 |
By default, the plot is labeled with a DateObject for time series based on dates and a timestamp for other time series:
| In[14]:= |
| Out[14]= | 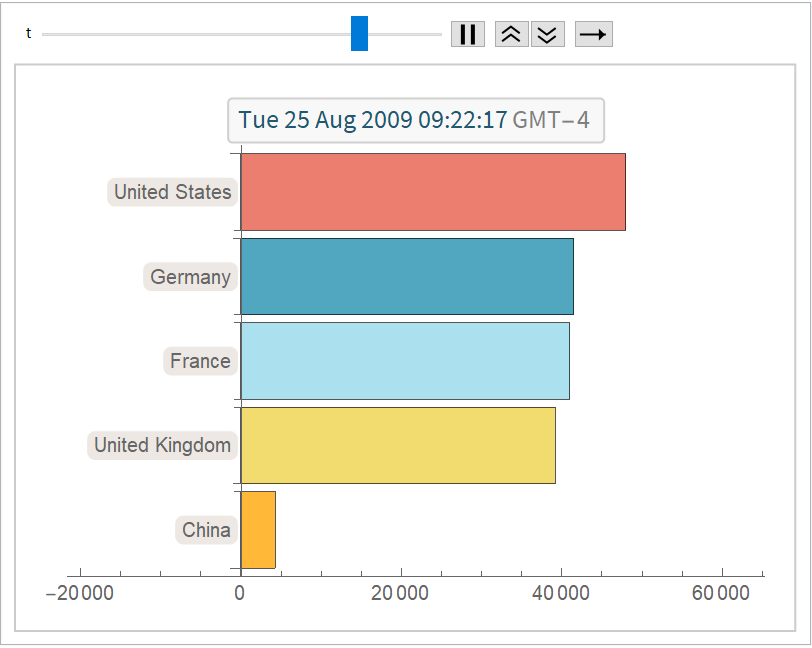 |
Specify a function to create a plot label from the timestamps:
| In[15]:= |
| Out[15]= | 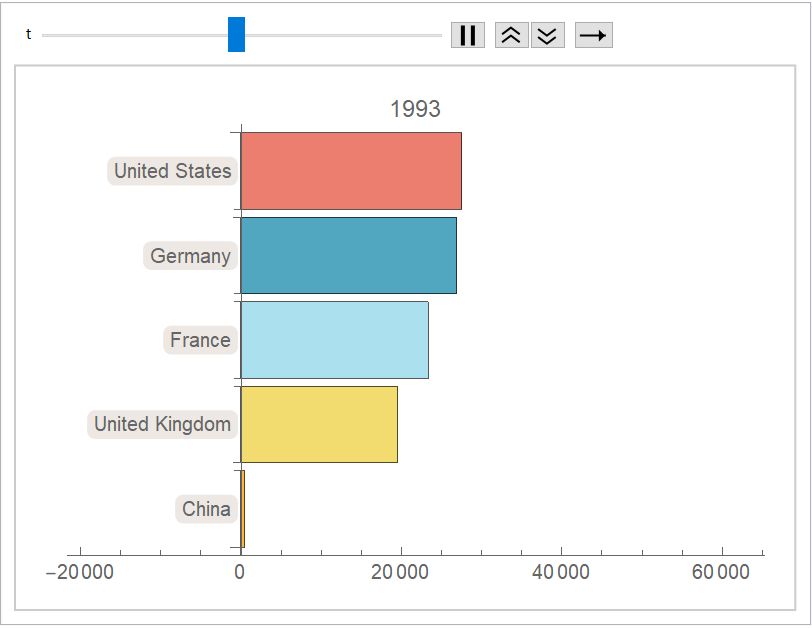 |
The input to "PlotLabelFunction" is AbsoluteTime values:
| In[16]:= |
| Out[16]= | 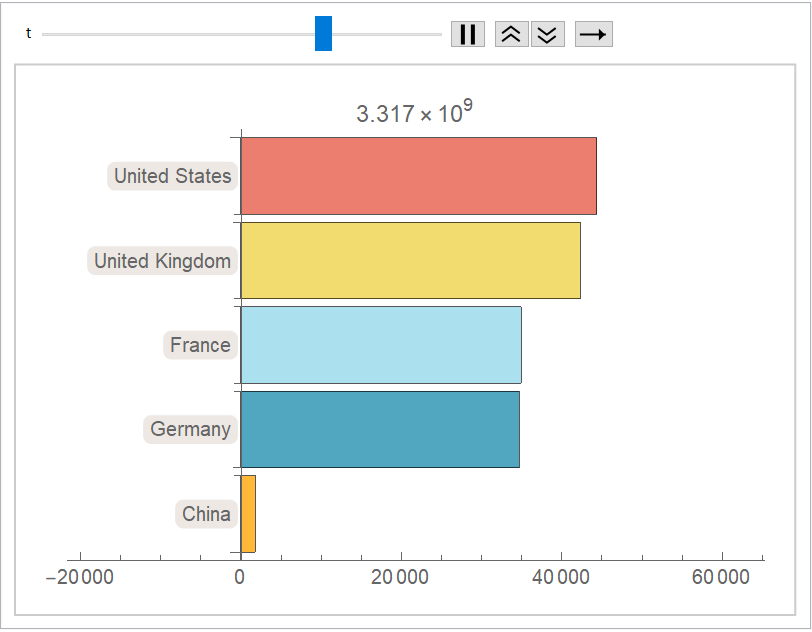 |
Use a pure function to create custom label containing any content:
| In[17]:= | ![ResourceFunction["RankedTimeSeriesBarChart"][Uncompress[
"1:eJztnXk8VP0exylLi0pF6VqK2yptT/UUD09EspUy2bJkGmcyjBlmCZXKkkpZn5S0KCkR5cljy1IRiYjJLhKiSIlUWu8M9dzL7b7uqz98/jJ//F6/c85vzvv8vuf7O3Pm+/l9z1HczjShigoJCbHH8wstNptJoZE5NCaDOkqwUoRfmHDpxMCSGL9Yx+DQOB4kcX5Vm8llcFgeJAl+3ZRB4xD2JA6ZQ7Cpgm+xBWu3EM4uTBaZrkPmkNnjBCtozgSJYNH4jcS/79+IxuZQhQct/TJoqZ89hl9s5pL76SxVuc3dhqy/NKmjBZtEv+2YPdBSsLiJ6UawSILj3UQwXegE7Sv/QxorOFCSDpNOJ7P+q7GgZknwN/S3/QF0fuO4bvLzZCyUVfQxQqQkFQu9XXi4xUr3BhbqKdP1KVE1Ewvdv7atjeORjYWe4z1jzyq4hYU2yZGL9HfmYKEZTWbbPKLuYKEn4oRrphfnY6FFdlM3EUEFWKhI5AaJiUZFWKgDV6O8Zel9LHRqsinRbVWChV6KsmBsTCvFQmtC3ftWPCjDQoUjrP1LInlYqJrje7XMkIdYqLmqe65mezkWqtCn1qRvUomFnrY5Qp27pQr8I+77NCQ4DwwtVHzicJNXjYUeeXHoPu9ODRZ6Y+a2synj67BQ6mnP8Wkij7BQ+T9VznRq12OhF644Pi1Ia8BCJQ0fxSaPa8RCJ8VVvltWC4Y6nUuSqs96goX+c8r0vBjFJiz0C6Vm3tNgMNRHxODoJP1mLDSIbhE1w7YFC33FLOo093+Khc5y/bzD/FQrFqrqtPzdF3obFhoaUNpQFgmGSgqJ2u37CjbvydO/e7nEgXu6prdnUa3VMyxUL8HFlrT8ORZaltNgm/wKDK0PLFz1rrEd/NPWrhJRmt2BhXotlPDv0nsBvgz6qKil6nZioQszFuqG5bzEQnNTOsqlG18NJ3Rw1LufoyA0OGxuxy8IkgtBoVFplIHIvNh/fot2XVxIiCbY0UAh9L1gCX37DGnf/H/bjxrUXtCKJPLtuPuXBjcgCeL62ky+zRhcJpf9oxYCs+rQ2BQWwSH+jR6QCQZH+b/rDexJ/IoZmc4ldPg2Z7D53R665/5mApFBYCBdLoMisA1bYH0tLofpzDcVZUhjSUGFYJOdXeg0xo4NBMeBaT/kSCfwK/oMDsFyYdJ/IIOwpwzdbsyyJ4Za5e+W38+jCbGDy/cGvlP1b9/C4hJ/V76Zfb7m4O8PLP0PwUXgRdoONAZ5+JWWC6qKHIaBNXbk9SxRjWiJtQH/+StWU9LdY4eFLpkdbdESRQELWZZVF3eL2GOhLzLjl3QZULHQCeHFSz7Eg3ua+am5+uCiHViosvaHX68dBTvS9YdRH7lfwefUZWu23i1LByzU17fZVz8KDOWsk41NdaRhoX4HD1vzFtGxUCZxpqLajImFdscedDXfwcJCLRU2hdWcdcVCbUyVAz56gM27RopEjUgD9zQ1aPEmOQYbCxWd13F2XgMYOnWzlpoujwP+S7S45Ytt204s9FaISYH6cTew/jD/0rbGE57gqHyY2BPNCT5Y6LadD22NF/phoXbyTIk3zoew0OhVW3jRLYfBMux5kTZDgyNY6JzKpOoPHwKw0KzJWlUMTjB4WtNMA88x3SHgqHzFqcRQpWNY6MruGsX40BPgIVPPqLtCnMJC/SvY7lzqOSz05bHZAV3jL4Lve01PNZ2SuQKelFcWXeLelYCFalvXKXDy/8RCIz/3tCt2g2fsSo0+r9YRn4aF3vcStrronwEOXnG2ck5+ycJCF92+sva1903wH6iPbOWuh2DoxN+1pdPMb2OhKeUyUWZ7crHQjpSEzspxwzpNeERpGVFaBoz+U0qL4CgHUlsM+R2xZzoPv+Ki5F2aOM08CjsCx6aL2UUkRWOhr896surjY7BQV7l8esCdOPClvOT0rfQL8eCpWQq8xuyiRCw0QlLxjbIyGMqJs4l00b8OlnneVC3ssgBnZolvTZ6euwecryT9XL1bPBx8T7B1gcEvMTfB+Upb/qpoHVsPvuXKcXZzyOkDp4PZFTzKX9YDvqOd3x2bKtsK7ukG71brwHRwDlquVMhUw8h7WGh4ZbBPmOoDLFTLUWhmdCoYKuuzobn+IjhfKXGWq9diJjhfiek452WhMDhfKU86XFOrF5yDJtEppGG8BmzeU3Pb7YqOgTOzVk1ZeVklF5wktd/9oXC0bC04Zt0xPigkAJyvJKlv6L/9Kxh6IkPrqpsnGJo4rpw2SwYMPbgy3HfOVnBm1jlKaoZ9CThfyfyVhIRBPDihZn9G18J7B8AJNctNdpu8zQcn1EgXurNrE8F5EPVrYnoeTwNnfCTLlhKz28DpYO7VHo27tMDeO+rCY2OeH9h7ExKuJVZngKGz5bdODPkVPGQuOyqwls8He69pc+bZ2l5wT2/bT1knMgF8TvPHr7BalAweMqKZ6wx2iIDNq881PHooZljNO6K4jCguA0b/KcVFsFqXRWZQiOGXWmLydeW9TC6BE9IPs9on51wG31WurZwiL38VCw35LSUol5aEhXqvmdGsUQp+NFzfPd+xx5TAD0yzbl2wu4wHhjYeMZx7kA6e8/Fcb1IwRQasBRyRCiwurcgDB0zM7DSuloMfI1a51HSuZyK4p1Ue0mJu+8Fh+RvSfmIpvmAli91y2KiGAHuvumXbpLjJ4J46HyTOzWQVgiduClfsW10FFiB2ed8t+aoNjpC3qr3w/2M9GOpR8rqTq1cBTrfrvih3RxkMDQ0oDXTWAoflNd8ax4jVgXsqlSC3V7EbrHqscDswJXAtWIA4Y3xxYq8GGGqptMtYPRbsSAZWyU4hFPBD8DRWPM8wkgFDW+6HPxGuAg+Zhzq8YMozMNRKfTvb9DTYkfaqU5NkGsGP+3OkSO+57AHWd1bHLB4l1geGSrr91sMuAj8ET+rkiuYAHXA09cBmbmyuEviJXvqft1M7jcA9vZq0ILGwChw3LrDsoleRwXHjI9HyPma94J7OKJ7RIn8ffE7/uGTm5CAENu+igK72vGbwxcFPxbTvijRYnbw5a9m8Az1gqLWuaVsTCexIH9MepWTlDeuQGZFaRqSWAaP/lNQiqK8nWM5khsfway1JV0KcTEPB+bUB+47SdLrAWku2q+b+t7ng/Npck4SNt1PAWovw9OKGqeIpWOjOxmePrazB+bVFKlk2de3p4HvZqXHKb0aBkz0u+PTtFj0Ajlbv1Fj5yXsM+JUt6tQPzHnJd7HQ9QV5Voe7wHF5MxdZpwZrMDTnmvA8FR0wtFDP5lrYUrD3PnHqrStwBEPTTQnbdgOw1nKm90ainT74jThN7yMn87zBskdk0LHpMpZgaFiFh9/nu+AgY9+GkL0uD8BigEJVYnZgGfjtKVWTXxpcfgGOVo/1/1I+1xWsQNRsU7U+3g5+kcmD635ctzxwYgDvtrvyaFOweTeqBt3XvgSGvgl/FbprBhiaXm7h/lEKrEDMbUva/34CGGq+anEswxN8cXAse/S05RB4yOx7bpvqFQmWPbK8SMVONWBoEq2NxMgEh1MtrCVLqRvBQcaam/619ovBWkuF1KbaTC1wT+s7u1s814OhHRGrK8LzweZNz55z1tARrECY7dNkp50E99RiQmvBV0dwWkuduKyz6zS0I5Xqc2wCwdDzWZyG6zFgRzK6vkSucS34nI4Z3fMP6+PD6r0jWsuI1jJg9Pma/wIcm0cy"], "PlotLabelFunction" -> (Row[{"The values at year: ", DateString[#, {"Year"}]}] &), "RankingFunction" -> Identity]](https://www.wolframcloud.com/obj/resourcesystem/images/21f/21fd743b-56d1-4db6-b15e-d7c6d65e7b94/57ab7cbf25f263bf.png) |
| Out[17]= | 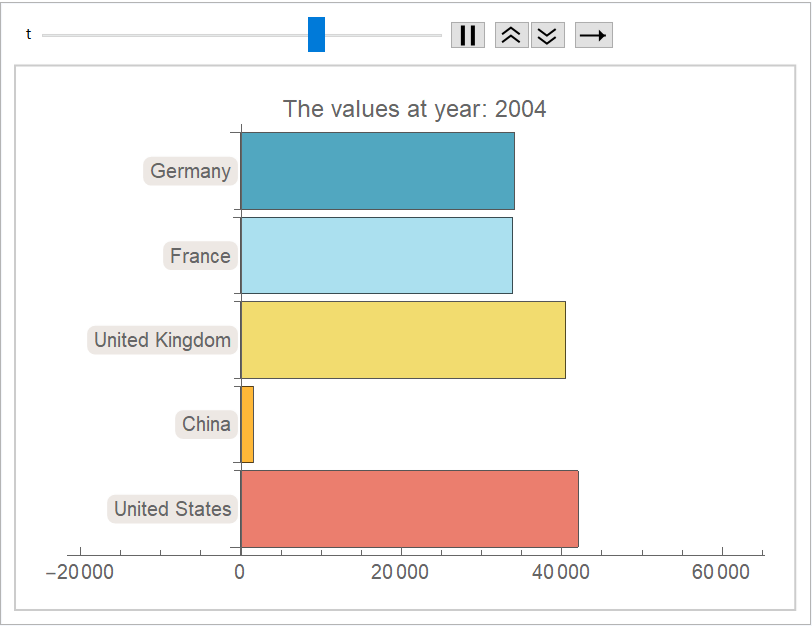 |
By default the plot range is static throughout the animation:
| In[18]:= |
| Out[18]= | 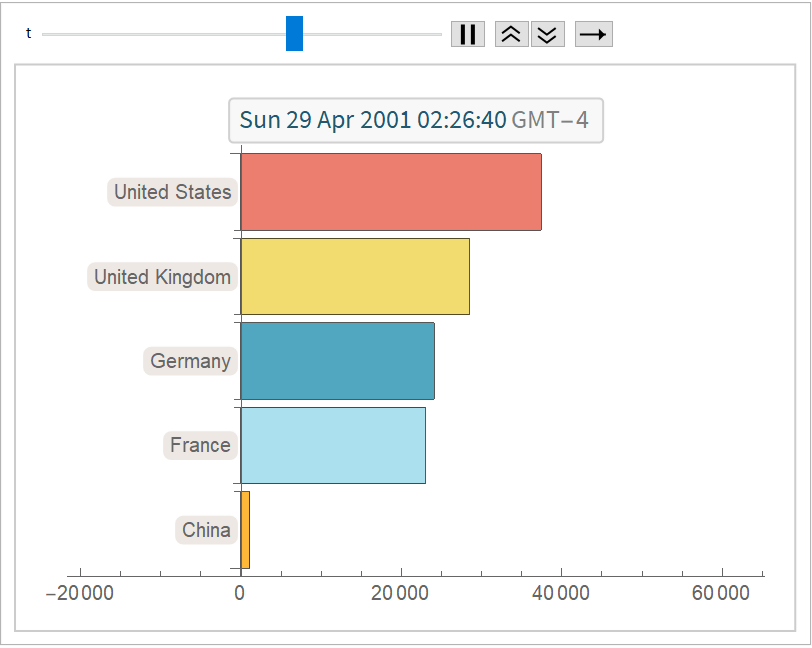 |
Set the PlotRange option to Automatic to have dynamic ranges that adjust as the data changes:
| In[19]:= |
| Out[19]= | 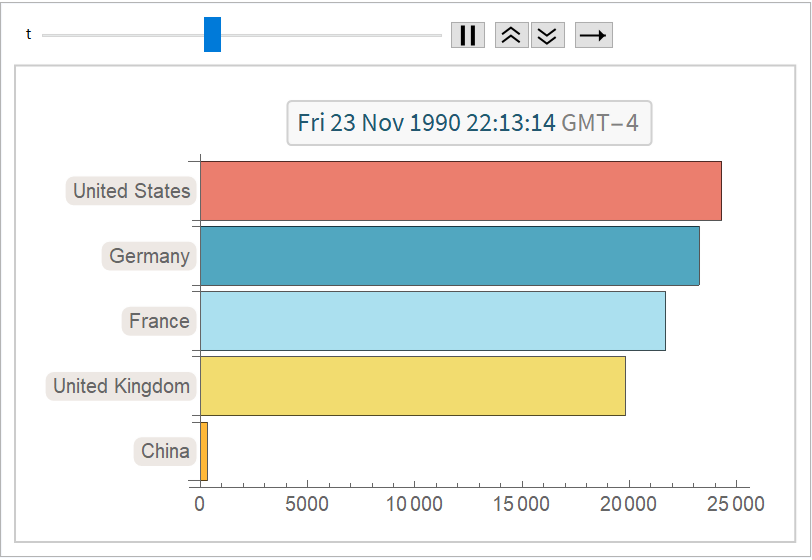 |
Specify how the bars should be sorted using "RankingFunction":
| In[20]:= | ![ResourceFunction["RankedTimeSeriesBarChart"][Uncompress[
"1:eJztnXk8VP0exylLi0pF6VqK2yptT/UUD09EspUy2bJkGmcyjBlmCZXKkkpZn5S0KCkR5cljy1IRiYjJLhKiSIlUWu8M9dzL7b7uqz98/jJ//F6/c85vzvv8vuf7O3Pm+/l9z1HczjShigoJCbHH8wstNptJoZE5NCaDOkqwUoRfmHDpxMCSGL9Yx+DQOB4kcX5Vm8llcFgeJAl+3ZRB4xD2JA6ZQ7Cpgm+xBWu3EM4uTBaZrkPmkNnjBCtozgSJYNH4jcS/79+IxuZQhQct/TJoqZ89hl9s5pL76SxVuc3dhqy/NKmjBZtEv+2YPdBSsLiJ6UawSILj3UQwXegE7Sv/QxorOFCSDpNOJ7P+q7GgZknwN/S3/QF0fuO4bvLzZCyUVfQxQqQkFQu9XXi4xUr3BhbqKdP1KVE1Ewvdv7atjeORjYWe4z1jzyq4hYU2yZGL9HfmYKEZTWbbPKLuYKEn4oRrphfnY6FFdlM3EUEFWKhI5AaJiUZFWKgDV6O8Zel9LHRqsinRbVWChV6KsmBsTCvFQmtC3ftWPCjDQoUjrP1LInlYqJrje7XMkIdYqLmqe65mezkWqtCn1qRvUomFnrY5Qp27pQr8I+77NCQ4DwwtVHzicJNXjYUeeXHoPu9ODRZ6Y+a2synj67BQ6mnP8Wkij7BQ+T9VznRq12OhF644Pi1Ia8BCJQ0fxSaPa8RCJ8VVvltWC4Y6nUuSqs96goX+c8r0vBjFJiz0C6Vm3tNgMNRHxODoJP1mLDSIbhE1w7YFC33FLOo093+Khc5y/bzD/FQrFqrqtPzdF3obFhoaUNpQFgmGSgqJ2u37CjbvydO/e7nEgXu6prdnUa3VMyxUL8HFlrT8ORZaltNgm/wKDK0PLFz1rrEd/NPWrhJRmt2BhXotlPDv0nsBvgz6qKil6nZioQszFuqG5bzEQnNTOsqlG18NJ3Rw1LufoyA0OGxuxy8IkgtBoVFplIHIvNh/fot2XVxIiCbY0UAh9L1gCX37DGnf/H/bjxrUXtCKJPLtuPuXBjcgCeL62ky+zRhcJpf9oxYCs+rQ2BQWwSH+jR6QCQZH+b/rDexJ/IoZmc4ldPg2Z7D53R665/5mApFBYCBdLoMisA1bYH0tLofpzDcVZUhjSUGFYJOdXeg0xo4NBMeBaT/kSCfwK/oMDsFyYdJ/IIOwpwzdbsyyJ4Za5e+W38+jCbGDy/cGvlP1b9/C4hJ/V76Zfb7m4O8PLP0PwUXgRdoONAZ5+JWWC6qKHIaBNXbk9SxRjWiJtQH/+StWU9LdY4eFLpkdbdESRQELWZZVF3eL2GOhLzLjl3QZULHQCeHFSz7Eg3ua+am5+uCiHViosvaHX68dBTvS9YdRH7lfwefUZWu23i1LByzU17fZVz8KDOWsk41NdaRhoX4HD1vzFtGxUCZxpqLajImFdscedDXfwcJCLRU2hdWcdcVCbUyVAz56gM27RopEjUgD9zQ1aPEmOQYbCxWd13F2XgMYOnWzlpoujwP+S7S45Ytt204s9FaISYH6cTew/jD/0rbGE57gqHyY2BPNCT5Y6LadD22NF/phoXbyTIk3zoew0OhVW3jRLYfBMux5kTZDgyNY6JzKpOoPHwKw0KzJWlUMTjB4WtNMA88x3SHgqHzFqcRQpWNY6MruGsX40BPgIVPPqLtCnMJC/SvY7lzqOSz05bHZAV3jL4Lve01PNZ2SuQKelFcWXeLelYCFalvXKXDy/8RCIz/3tCt2g2fsSo0+r9YRn4aF3vcStrronwEOXnG2ck5+ycJCF92+sva1903wH6iPbOWuh2DoxN+1pdPMb2OhKeUyUWZ7crHQjpSEzspxwzpNeERpGVFaBoz+U0qL4CgHUlsM+R2xZzoPv+Ki5F2aOM08CjsCx6aL2UUkRWOhr896surjY7BQV7l8esCdOPClvOT0rfQL8eCpWQq8xuyiRCw0QlLxjbIyGMqJs4l00b8OlnneVC3ssgBnZolvTZ6euwecryT9XL1bPBx8T7B1gcEvMTfB+Upb/qpoHVsPvuXKcXZzyOkDp4PZFTzKX9YDvqOd3x2bKtsK7ukG71brwHRwDlquVMhUw8h7WGh4ZbBPmOoDLFTLUWhmdCoYKuuzobn+IjhfKXGWq9diJjhfiek452WhMDhfKU86XFOrF5yDJtEppGG8BmzeU3Pb7YqOgTOzVk1ZeVklF5wktd/9oXC0bC04Zt0xPigkAJyvJKlv6L/9Kxh6IkPrqpsnGJo4rpw2SwYMPbgy3HfOVnBm1jlKaoZ9CThfyfyVhIRBPDihZn9G18J7B8AJNctNdpu8zQcn1EgXurNrE8F5EPVrYnoeTwNnfCTLlhKz28DpYO7VHo27tMDeO+rCY2OeH9h7ExKuJVZngKGz5bdODPkVPGQuOyqwls8He69pc+bZ2l5wT2/bT1knMgF8TvPHr7BalAweMqKZ6wx2iIDNq881PHooZljNO6K4jCguA0b/KcVFsFqXRWZQiOGXWmLydeW9TC6BE9IPs9on51wG31WurZwiL38VCw35LSUol5aEhXqvmdGsUQp+NFzfPd+xx5TAD0yzbl2wu4wHhjYeMZx7kA6e8/Fcb1IwRQasBRyRCiwurcgDB0zM7DSuloMfI1a51HSuZyK4p1Ue0mJu+8Fh+RvSfmIpvmAli91y2KiGAHuvumXbpLjJ4J46HyTOzWQVgiduClfsW10FFiB2ed8t+aoNjpC3qr3w/2M9GOpR8rqTq1cBTrfrvih3RxkMDQ0oDXTWAoflNd8ax4jVgXsqlSC3V7EbrHqscDswJXAtWIA4Y3xxYq8GGGqptMtYPRbsSAZWyU4hFPBD8DRWPM8wkgFDW+6HPxGuAg+Zhzq8YMozMNRKfTvb9DTYkfaqU5NkGsGP+3OkSO+57AHWd1bHLB4l1geGSrr91sMuAj8ET+rkiuYAHXA09cBmbmyuEviJXvqft1M7jcA9vZq0ILGwChw3LrDsoleRwXHjI9HyPma94J7OKJ7RIn8ffE7/uGTm5CAENu+igK72vGbwxcFPxbTvijRYnbw5a9m8Az1gqLWuaVsTCexIH9MepWTlDeuQGZFaRqSWAaP/lNQiqK8nWM5khsfway1JV0KcTEPB+bUB+47SdLrAWku2q+b+t7ng/Npck4SNt1PAWovw9OKGqeIpWOjOxmePrazB+bVFKlk2de3p4HvZqXHKb0aBkz0u+PTtFj0Ajlbv1Fj5yXsM+JUt6tQPzHnJd7HQ9QV5Voe7wHF5MxdZpwZrMDTnmvA8FR0wtFDP5lrYUrD3PnHqrStwBEPTTQnbdgOw1nKm90ainT74jThN7yMn87zBskdk0LHpMpZgaFiFh9/nu+AgY9+GkL0uD8BigEJVYnZgGfjtKVWTXxpcfgGOVo/1/1I+1xWsQNRsU7U+3g5+kcmD635ctzxwYgDvtrvyaFOweTeqBt3XvgSGvgl/FbprBhiaXm7h/lEKrEDMbUva/34CGGq+anEswxN8cXAse/S05RB4yOx7bpvqFQmWPbK8SMVONWBoEq2NxMgEh1MtrCVLqRvBQcaam/619ovBWkuF1KbaTC1wT+s7u1s814OhHRGrK8LzweZNz55z1tARrECY7dNkp50E99RiQmvBV0dwWkuduKyz6zS0I5Xqc2wCwdDzWZyG6zFgRzK6vkSucS34nI4Z3fMP6+PD6r0jWsuI1jJg9Pma/wIcm0cy"], "PlotLabelFunction" -> (DateValue[#, "Year"] &), "RankingFunction" -> ReverseSort]](https://www.wolframcloud.com/obj/resourcesystem/images/21f/21fd743b-56d1-4db6-b15e-d7c6d65e7b94/0b7dafd5ccd5dcdb.png) |
| Out[20]= | 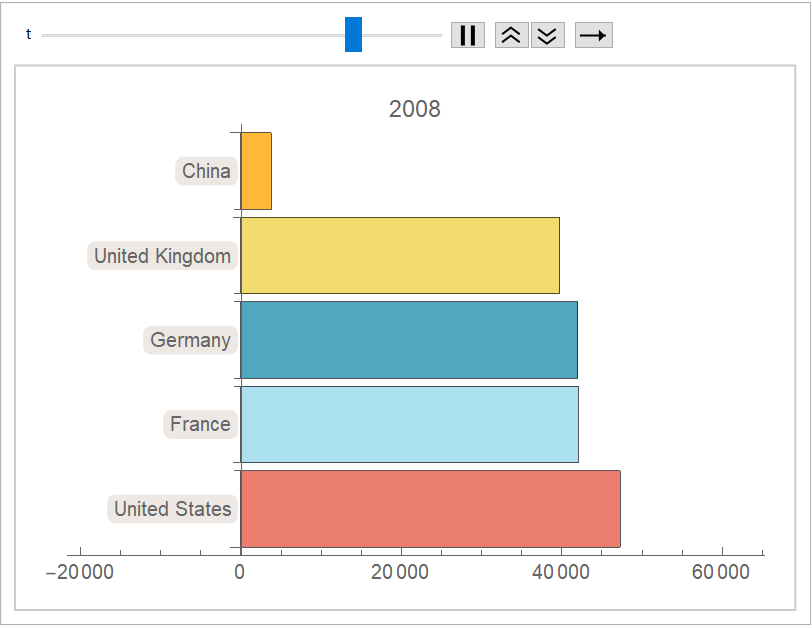 |
Maintain the order from the input using Identity. The first element is on bottom:
| In[21]:= | ![(* Evaluate this cell to get the example input *) CloudGet["https://www.wolframcloud.com/obj/93e5f018-116a-47d1-86ac-82e74d191451"]](https://www.wolframcloud.com/obj/resourcesystem/images/21f/21fd743b-56d1-4db6-b15e-d7c6d65e7b94/11938ff3b440846b.png) |
| Out[21]= | 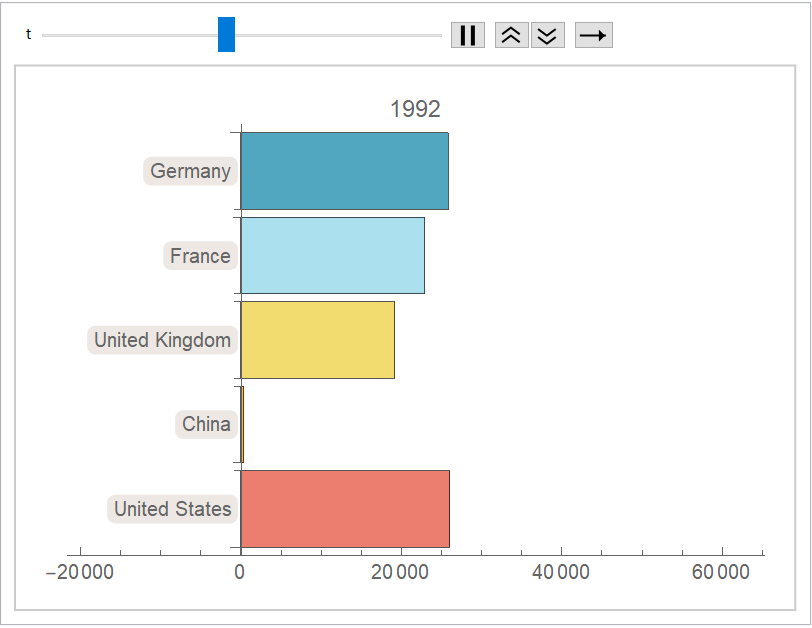 |
This work is licensed under a Creative Commons Attribution 4.0 International License