Wolfram Function Repository
Instant-use add-on functions for the Wolfram Language
Function Repository Resource:
Filter values out of a time series object
ResourceFunction["TimeSeriesSelect"][tseries,crit] gives a time series containing only elements of tseries for which crit is true. | |
ResourceFunction["TimeSeriesSelect"][crit] represents an operator form that can be applied to an expression. |
Select only even values in a time series:
| In[1]:= |
| Out[1]= |
The third element of the path is removed:
| In[2]:= |
| Out[2]= |
Retrieve financial data:
| In[3]:= |
| Out[3]= |
Select low values:
| In[4]:= |
| Out[4]= |
Plot the results:
| In[5]:= |
| Out[5]= | 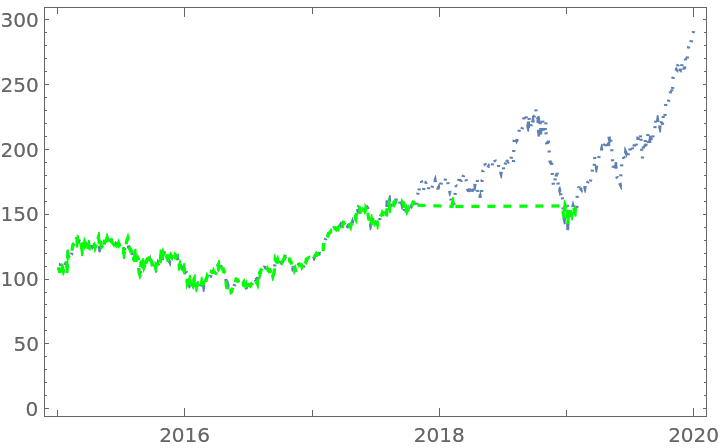 |
Get some yearly data:
| In[6]:= |
| Out[6]= |
Include only values from Summer Olympics years:
| In[7]:= |
| Out[7]= |
Get financial time series data:
| In[8]:= |
| Out[8]= |
Select only values from the first quarter of each year with a high value (this is meaningless and should not be used for investment decisions):
| In[9]:= |
| Out[9]= |
Plot the selected values along with the full data:
| In[10]:= |
| Out[10]= | 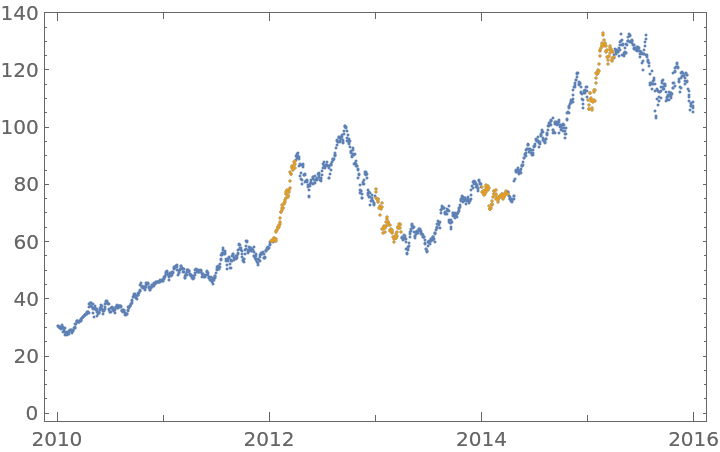 |
Get COVID-19 time series data:
| In[11]:= |
Limit each time series to only include the non-zero values and take only counties with 28 days or more of data:
| In[12]:= | ![fromfirstdeath = timeseries[
Select[(#Deaths["FirstDate"] < Now - Quantity[28, "Days"]) &], {"Deaths" -> ResourceFunction["TimeSeriesSelect"][#2 > 0 &]}][All, "Deaths"]](https://www.wolframcloud.com/obj/resourcesystem/images/d3a/d3aa122f-0bb3-45ed-9740-abf8715887a7/74c031bdc92724f6.png) |
| Out[12]= | 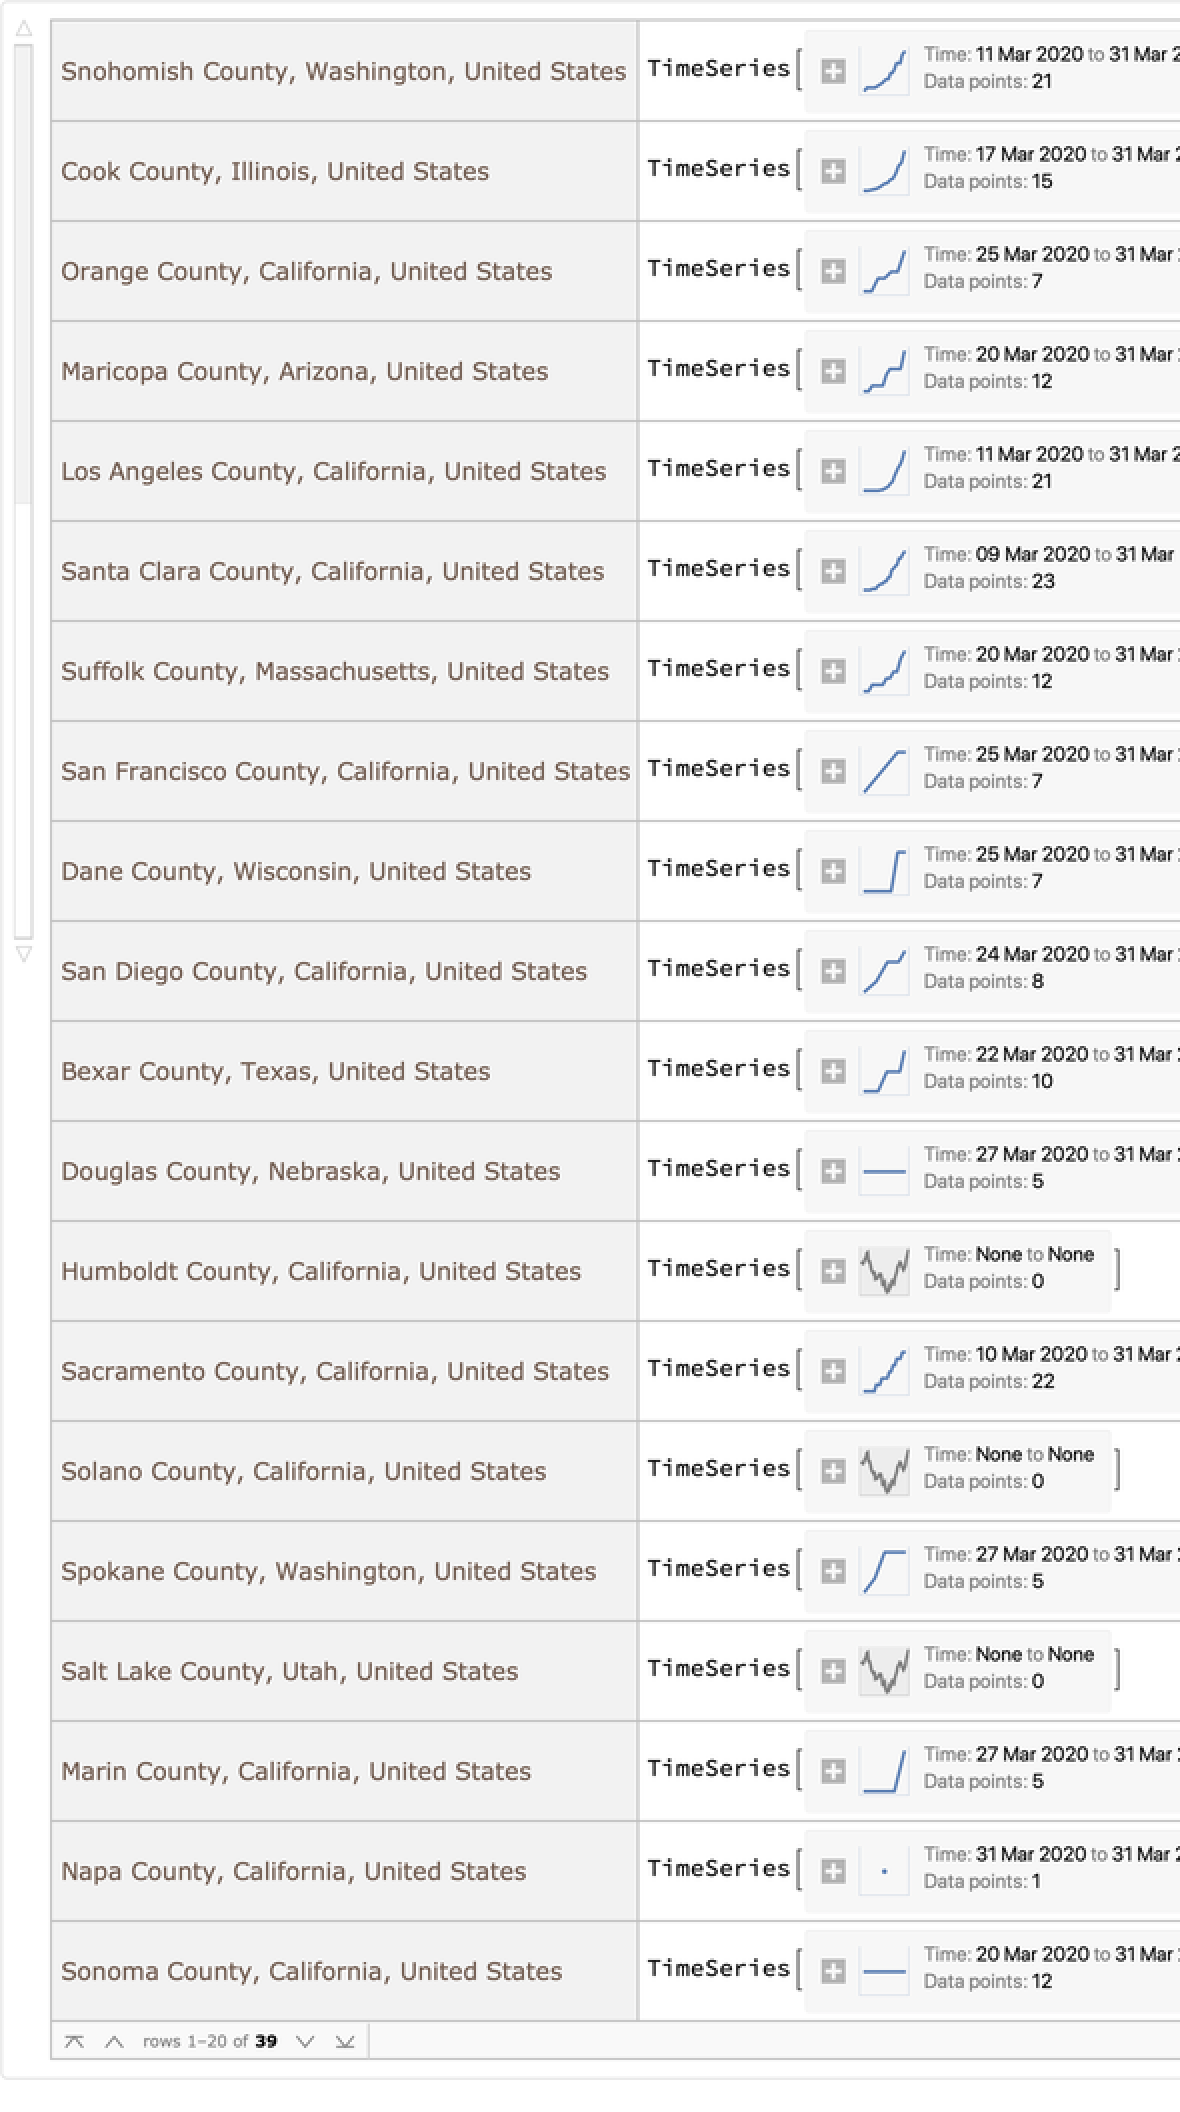 |
Plot the values:
| In[13]:= |
| Out[13]= | 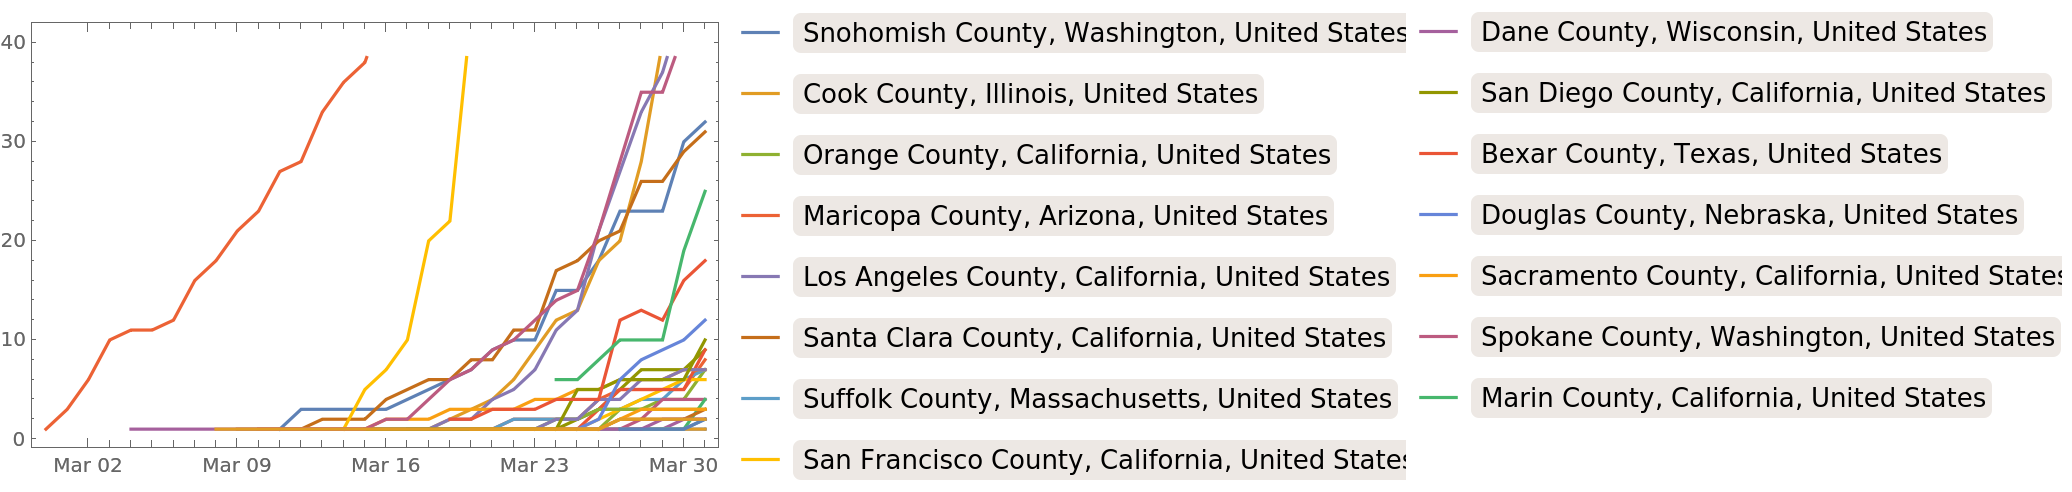 |
This work is licensed under a Creative Commons Attribution 4.0 International License