Wolfram Function Repository
Instant-use add-on functions for the Wolfram Language
Function Repository Resource:
Align multiple time series to begin at the same time
ResourceFunction["TimeSeriesAlign"][{ts1,ts2,…}] shifts the time series tsi so the first time of each is aligned. | |
ResourceFunction["TimeSeriesAlign"][{ts1,ts2,…},t0] shifts the time series to all start at t0. |
Shift two time series to start at time zero:
| In[1]:= |
| Out[1]= |
TimeSeriesAlign uses Now as the default start time. Shifting two time series to the current time, treats numeric values as seconds:
| In[2]:= |
| Out[2]= | 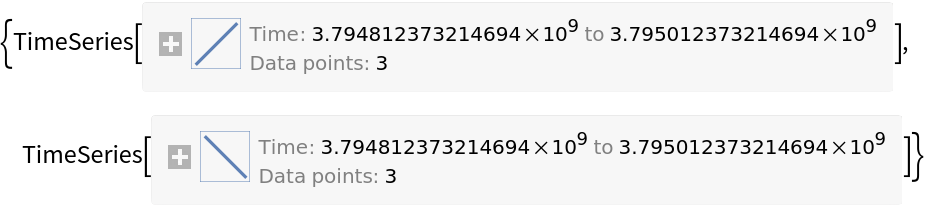 |
Plot it:
| In[3]:= |
| Out[3]= | 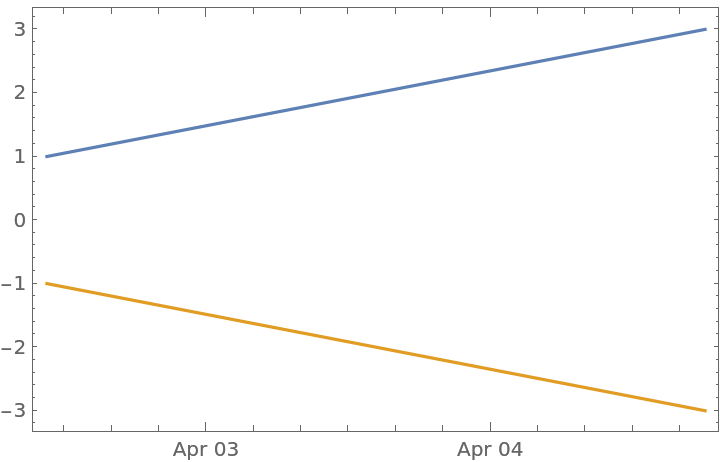 |
Align stock prices from different eras:
| In[4]:= |
| Out[4]= |
| In[5]:= |
| Out[5]= |
Plot them with a shared time span:
| In[6]:= |
| Out[6]= | 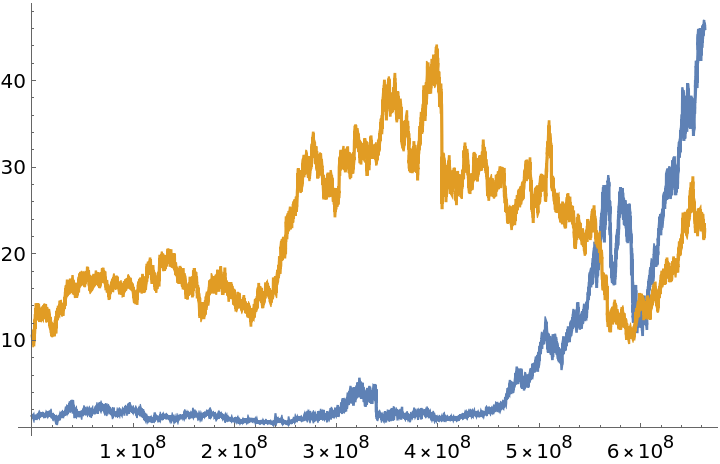 |
Align COVID-19 data for US counties so the date of the fifth death is shifted to today and chose only counties with at least ten data points:
| In[7]:= | ![aligned = ResourceFunction["NYTimesCOVID19Data"]["USCountiesTimeSeries"][All, ResourceFunction["TimeSeriesSelect"][#Deaths, #2 > 5 &] &][
Select[#["PathLength"] > 10 &]/*ResourceFunction["TimeSeriesAlign"]]](https://www.wolframcloud.com/obj/resourcesystem/images/d75/d7553bea-825f-44a0-b77c-3b7ca0f0b0a8/4b4031c118875e08.png) |
| Out[7]= | 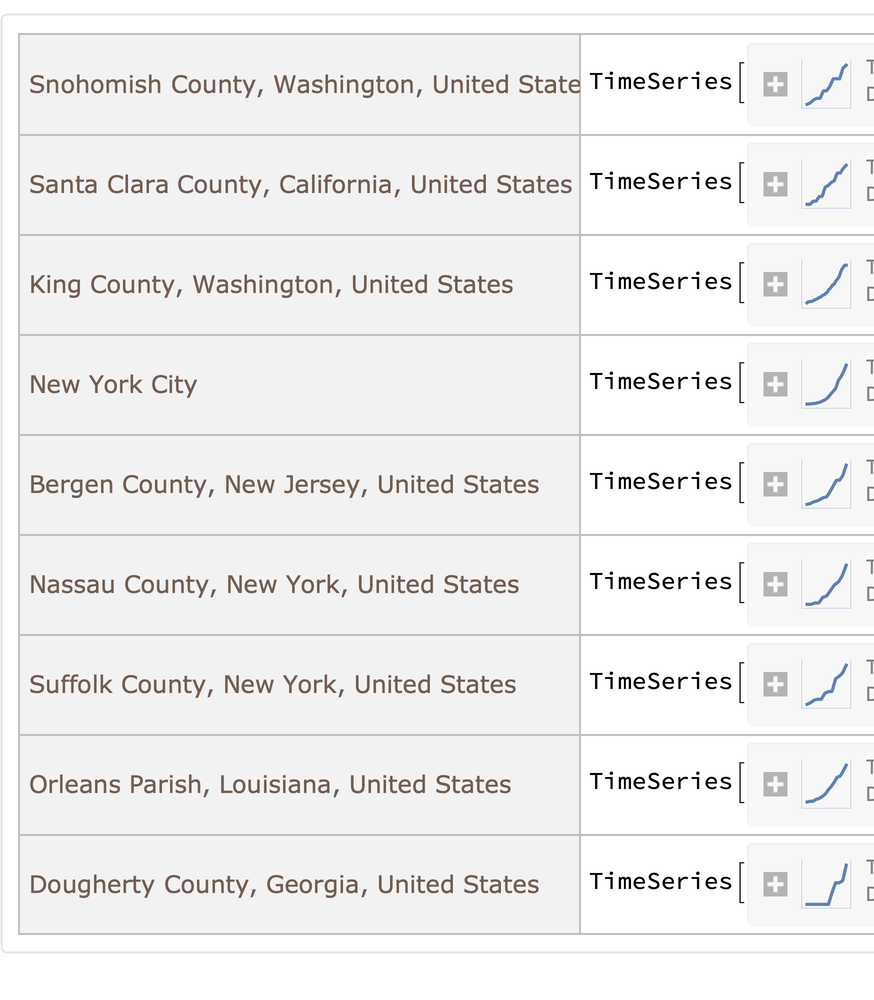 |
Plot it:
| In[8]:= |
| Out[8]= | 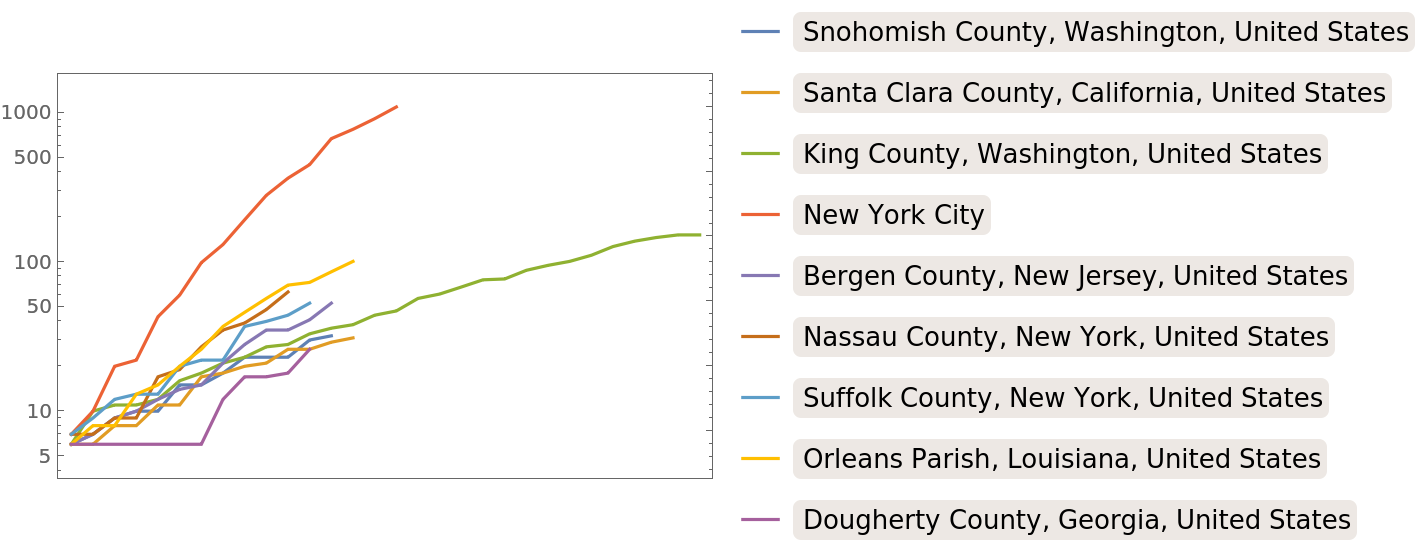 |
This work is licensed under a Creative Commons Attribution 4.0 International License