Wolfram Function Repository
Instant-use add-on functions for the Wolfram Language
Function Repository Resource:
Create markers carefully designed for creation of publication-quality plots
|
ResourceFunction["PolygonMarker"]["name"] returns a unit area Polygon describing the shape "name". |
|
|
ResourceFunction["PolygonMarker"][{p1,…,pn}] returns a unit area Polygon with shape described by points {p1,…,pn} and centroid at {0,0}. |
|
|
ResourceFunction["PolygonMarker"][shape, size] returns shape of the specified size. |
|
|
ResourceFunction["PolygonMarker"][shape, size, style] returns a Graphics object suitable for PlotMarkers where the style of shape is defined by style. |
|
|
ResourceFunction["PolygonMarker"][All] returns the list of names of predefined shapes. |
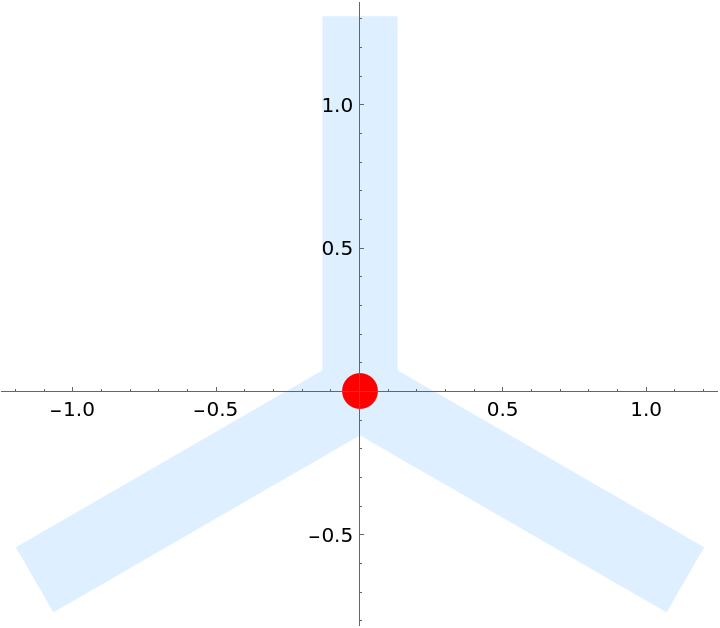
Create a polygon object of "TripleCross" type:
| In[1]:= |
|
| Out[1]= |
|
The centroid of the polygon is placed at {0,0}:
| In[2]:= |
|
| Out[2]= |
|
Visualize the polygon and its centroid:
| In[3]:= |
|
| Out[3]= |
|
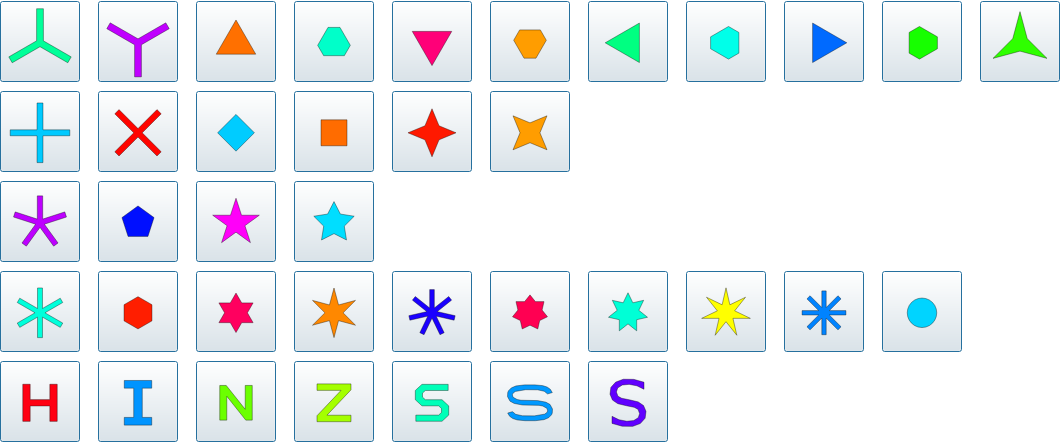
Get the complete list of built-in named shapes:
| In[4]:= |
|
| Out[4]= |

|
Make a Grid of Buttons with the shapes for easy selection:
| In[5]:= |
![Grid[{allShapes[[;; 11]], allShapes[[12 ;; 17]], allShapes[[18 ;; 21]], allShapes[[22 ;; 31]], allShapes[[32 ;;]]} /. shape_String :> Button[Tooltip[
ResourceFunction["PolygonMarker"][shape, Offset[13], {FaceForm[Hue@Random[]], EdgeForm[{Black, Thickness[0.005], JoinForm["Miter"]}]}], Row[{"\"", Style[shape, Bold], "\"", " (click to copy the name)"}]], CopyToClipboard@ToString[shape, InputForm], ImageSize -> {40, 40},
FrameMargins -> False]]](https://www.wolframcloud.com/obj/resourcesystem/images/ddd/ddde2ab7-b449-427d-a364-bf9251afa485/3-0-1/2b18f54fc09075da.png)
|
| Out[5]= |
|
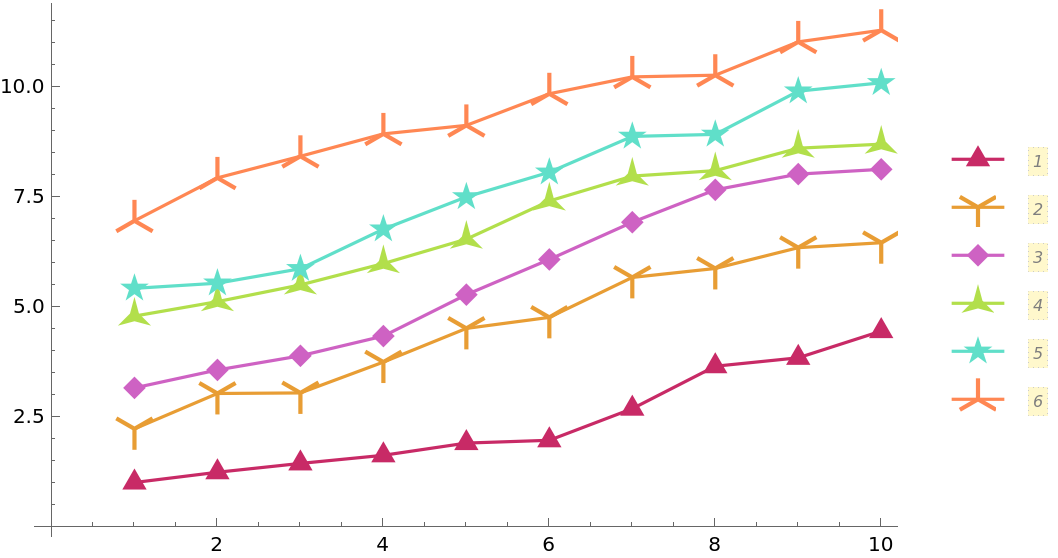
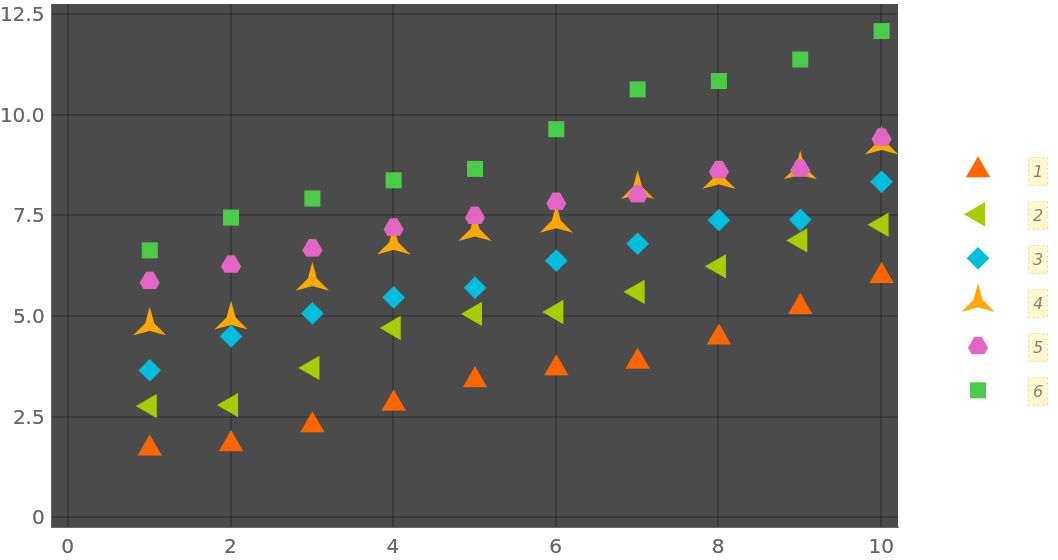
Filled markers that pick up PlotStyle and PlotTheme automatically:
| In[6]:= |
![fm[name_String, size_ : 8] := ResourceFunction["PolygonMarker"][name, Offset[size], EdgeForm[]];
SeedRandom[25];
ListPlot[Table[Accumulate@RandomReal[1, 10] + i, {i, 6}], PlotMarkers -> fm /@ {"Triangle", "Y", "Diamond", "ThreePointedStar", "FivePointedStar", "TripleCross"}, Joined -> True, PlotStyle -> ColorData[54, "ColorList"], PlotLegends -> PointLegend[Automatic, LegendMarkerSize -> {50, 37}, LegendLayout -> (Column[Row /@ #, Spacings -> -1] &)], ImageSize -> 450]
SeedRandom[2];
ListPlot[Table[Accumulate@RandomReal[1, 10] + i, {i, 6}], PlotMarkers -> fm /@ {"Triangle", "LeftTriangle", "Diamond", "ThreePointedStar", "UpTriangleTruncated", "Square"}, PlotTheme -> "Marketing", PlotLegends -> PointLegend[Automatic, LegendMarkerSize -> {50, 35}, LegendLayout -> (Column[Row /@ #, Spacings -> -1] &)], ImageSize -> 450]](https://www.wolframcloud.com/obj/resourcesystem/images/ddd/ddde2ab7-b449-427d-a364-bf9251afa485/3-0-1/477045124f6ee3a9.png)
|
| Out[8]= |
|
| Out[10]= |
|
Empty markers that pick up PlotStyle and PlotTheme automatically:
| In[11]:= |
![em[name_String, size_ : 7] := ResourceFunction["PolygonMarker"][name, Offset[size],
{Dynamic@
EdgeForm@
Directive[CurrentValue["Color"], JoinForm["Round"], AbsoluteThickness[2], Opacity[1]],
FaceForm[White]}, ImagePadding -> 6];
SeedRandom[2];
ListPlot[Table[Accumulate@RandomReal[1, 10] + i, {i, 3}], PlotMarkers -> em /@ {"Triangle", "Square", "Diamond"}, Joined -> True, PlotLegends -> PointLegend[Automatic, LegendMarkerSize -> {40, 25}], ImageSize -> 450]
SeedRandom[3];
ListPlot[Table[Accumulate@RandomReal[1, 10] + i, {i, 3}], PlotMarkers -> em /@ {"Triangle", "Square", "Diamond"}, Joined -> True, PlotLegends -> PointLegend[Automatic, LegendMarkerSize -> {40, 25}], PlotTheme -> "Marketing", ImageSize -> 450]](https://www.wolframcloud.com/obj/resourcesystem/images/ddd/ddde2ab7-b449-427d-a364-bf9251afa485/3-0-1/5d08e97545cdcfbc.png)
|
| Out[13]= |
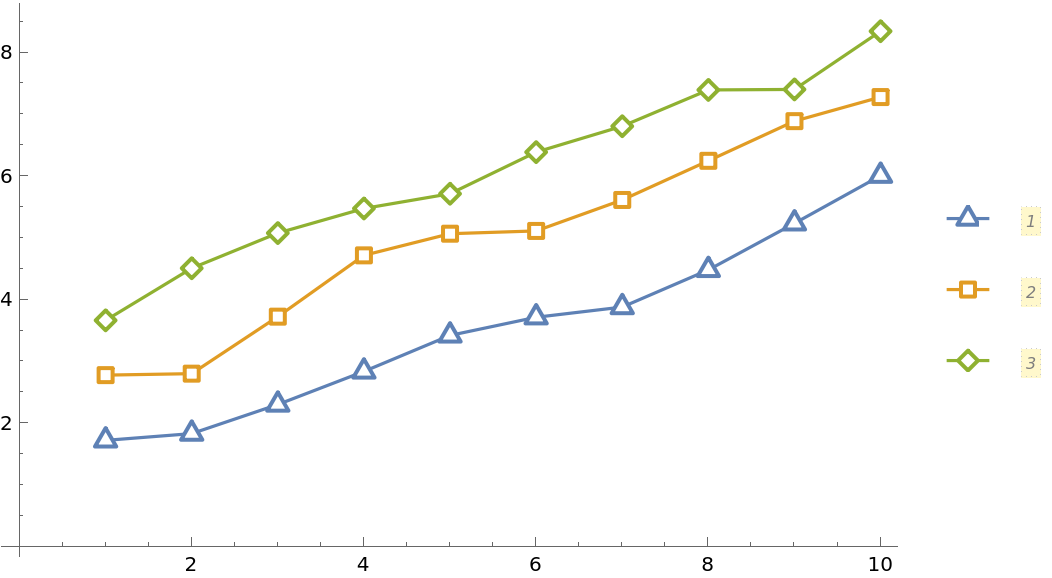
|
| Out[15]= |
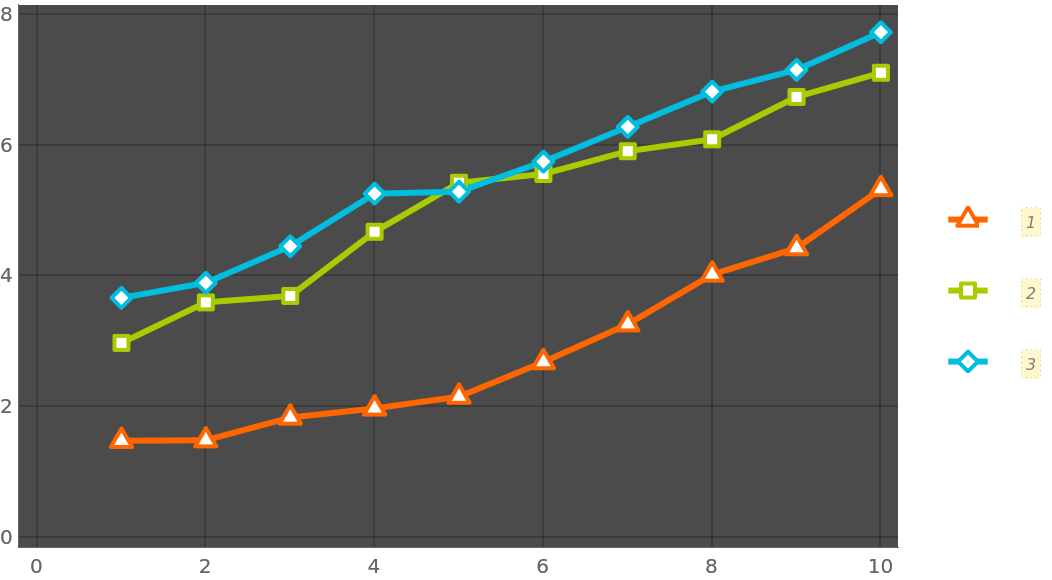
|
Filled markers with lighter filling colors:
| In[16]:= |
![fm2[name_String, size_ : 9] := ResourceFunction["PolygonMarker"][name, Offset@size, {
Dynamic@EdgeForm[{CurrentValue["Color"], Opacity[1]}],
Dynamic@FaceForm@Lighter[CurrentValue["Color"], 0.75]}];
data = Table[{x, BesselJ[k, x]}, {k, 0, 2}, {x, 0, 10, 0.5}];
ListPlot[data, PlotMarkers -> fm2 /@ {"UpTriangle", "Square", "Circle"}, Joined -> True, Frame -> True, Axes -> False, ImageSize -> 450, PlotRangePadding -> {Scaled[.05], Scaled[.1]}]](https://www.wolframcloud.com/obj/resourcesystem/images/ddd/ddde2ab7-b449-427d-a364-bf9251afa485/3-0-1/1bb88c54ad7a5b5d.png)
|
| Out[18]= |
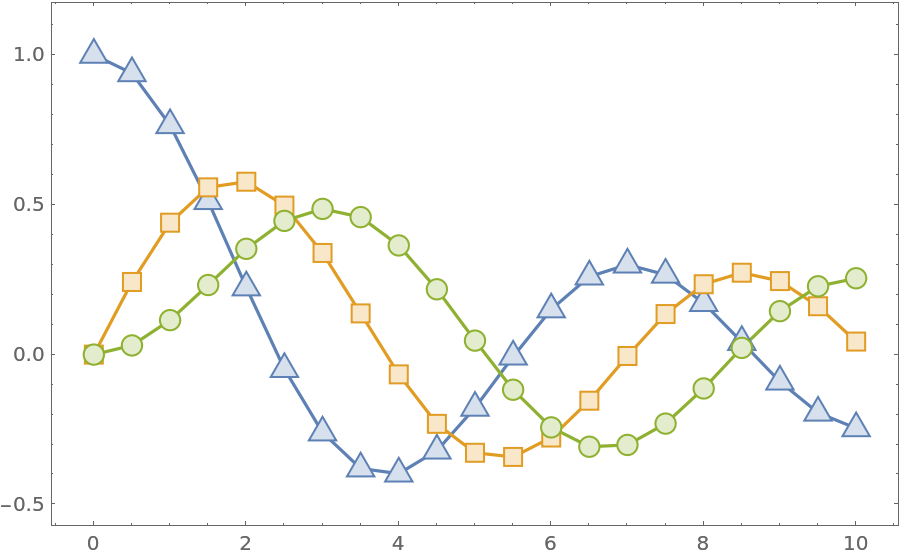
|
Use the third argument of PolygonMarker to specify the coordinate(s) where the marker should be placed:
| In[19]:= |
![(* Evaluate this cell to get the example input *) CloudGet["https://www.wolframcloud.com/obj/ac0ff40b-0f46-4b28-9c37-ec1c458567b9"]](https://www.wolframcloud.com/obj/resourcesystem/images/ddd/ddde2ab7-b449-427d-a364-bf9251afa485/3-0-1/52556dbc3d568c1d.png)
|
| Out[19]= |
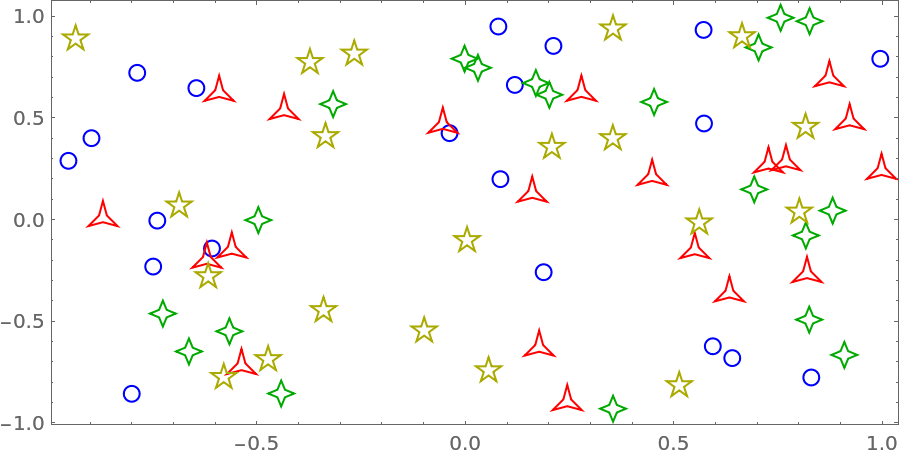
|
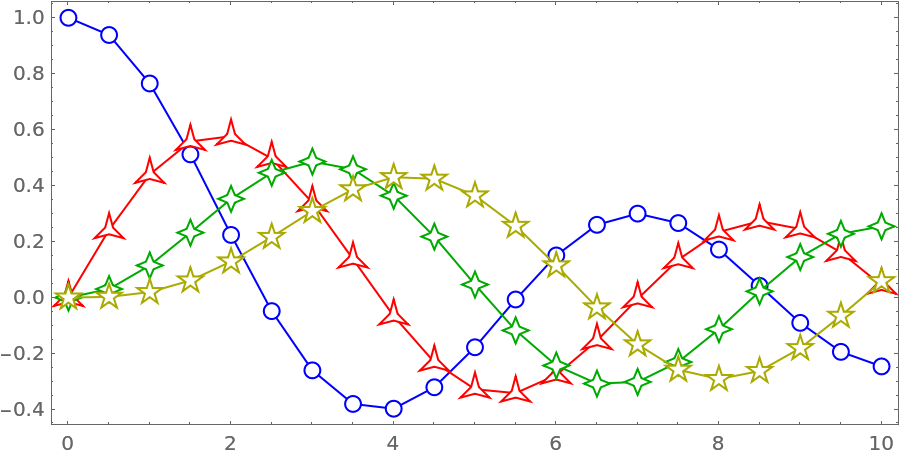
Construct a list plot directly from graphics primitives:
| In[20]:= |
![data = Table[{x, BesselJ[k, x]}, {k, 0, 3}, {x, 0, 10, 0.5}];
markers = {"Circle", "ThreePointedStar", "FourPointedStar", "FivePointedStar"};
colors = {Blue, Red, Darker@Green, Darker@Yellow};
Graphics[Table[{colors[[i]], Line[data[[i]]], FaceForm[White], EdgeForm[{colors[[i]], AbsoluteThickness[1], JoinForm["Miter"]}], ResourceFunction["PolygonMarker"][markers[[i]], Offset[7], data[[i]]]}, {i, Length[data]}], AspectRatio -> 1/2, ImageSize -> 450, Frame -> True]](https://www.wolframcloud.com/obj/resourcesystem/images/ddd/ddde2ab7-b449-427d-a364-bf9251afa485/3-0-1/379ea7c9ae713d03.png)
|
| Out[23]= |
|
Construct a custom list plot where open plot markers have transparent faces for each other (but not for the lines):
| In[24]:= |
![data = Table[{x, BesselJ[k, x]}, {k, 0, 4}, {x, 0, 10, 0.5}];
markers = {"Circle", "ThreePointedStar", "FourPointedStar", "DiagonalFourPointedStar", "FivePointedStar"};
colors = {Blue, Red, Green, Yellow, Orange};
background = Darker@Gray;
Graphics[{Table[{colors[[i]], AbsoluteThickness[1.5], Line[data[[i]]],
FaceForm[background], EdgeForm[None], ResourceFunction["PolygonMarker"][markers[[i]], Offset[7], data[[i]]]}, {i, Length[data]}], Table[{FaceForm[None], EdgeForm[{colors[[i]], AbsoluteThickness[1.5], JoinForm["Miter"]}], ResourceFunction["PolygonMarker"][markers[[i]], Offset[7], data[[i]]]}, {i, Length[data]}]}, AspectRatio -> 1/2, ImageSize -> 500, Frame -> True, Background -> background, FrameStyle -> White, ImagePadding -> {{30, 20}, {25, 20}}]](https://www.wolframcloud.com/obj/resourcesystem/images/ddd/ddde2ab7-b449-427d-a364-bf9251afa485/3-0-1/034391820f7ef0ed.png)
|
| Out[28]= |

|
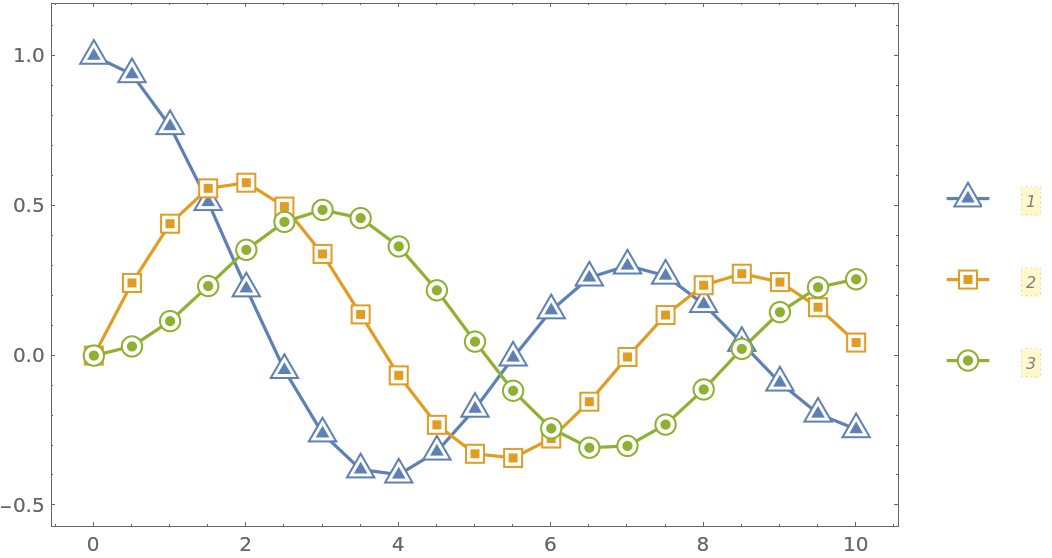
Center markers that pick up PlotStyle and PlotTheme automatically:
| In[29]:= |
![cfm[name_String, size_ : 9] := Show[
ResourceFunction["PolygonMarker"][name, Offset@size, {
FaceForm[White],
Dynamic@
EdgeForm[{CurrentValue["Color"], AbsoluteThickness[1], Opacity[1]}]}],
ResourceFunction["PolygonMarker"][name, Offset[size/2], EdgeForm[None]]];
data = Table[{x, BesselJ[k, x]}, {k, 0, 2}, {x, 0, 10, 0.5}];
ListPlot[data, PlotMarkers -> cfm /@ {"UpTriangle", "Square", "Circle"}, Joined -> True, Frame -> True, Axes -> False, ImageSize -> 450, PlotRangePadding -> {Scaled[.05], Scaled[.1]}, PlotLegends -> PointLegend[Automatic, LegendMarkerSize -> {40, 30}], ImageSize -> 450]](https://www.wolframcloud.com/obj/resourcesystem/images/ddd/ddde2ab7-b449-427d-a364-bf9251afa485/3-0-1/3857d87c97c48ced.png)
|
| Out[31]= |
|
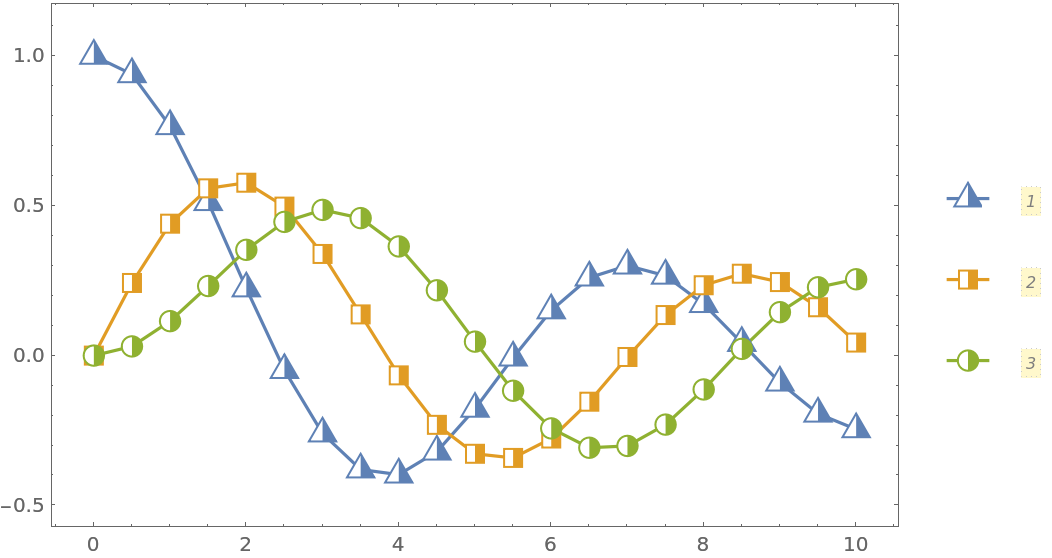
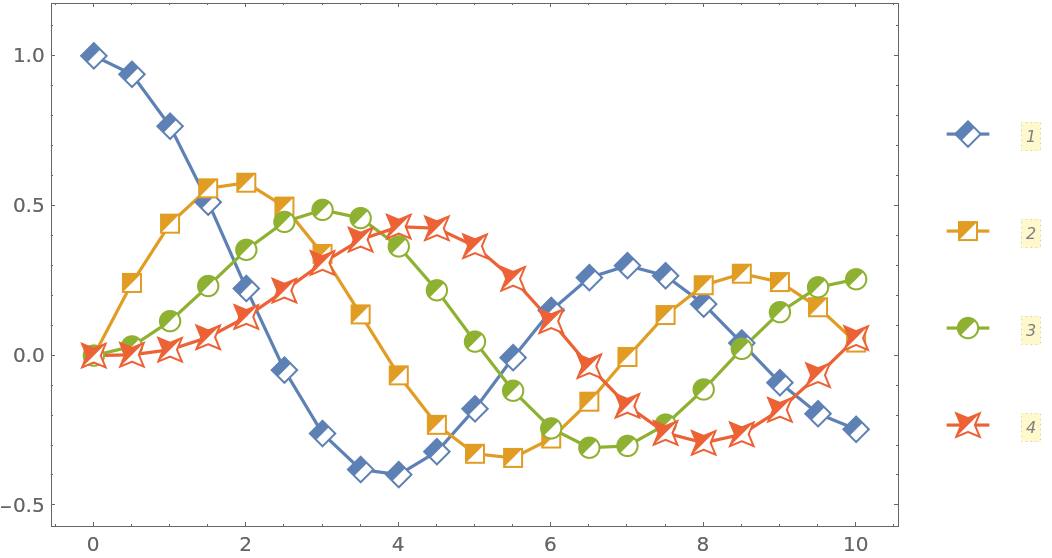
Half-filled markers that pick up PlotStyle and PlotTheme automatically:
| In[32]:= |
![hfm1[name_String, size_ : 9] := Show[
ResourceFunction["PolygonMarker"][name, Offset@size, {
FaceForm[White],
Dynamic@
EdgeForm[{CurrentValue["Color"], AbsoluteThickness[1], Opacity[1]}]}],
ResourceFunction["PolygonMarker"][name, Offset@size, EdgeForm[None]] /. {x_?Negative, y_?NumericQ} :> {0, y}];
data = Table[{x, BesselJ[k, x]}, {k, 0, 2}, {x, 0, 10, 0.5}];
ListPlot[data, PlotMarkers -> hfm1 /@ {"UpTriangle", "Square", "Circle"}, Joined -> True, Frame -> True, Axes -> False, ImageSize -> 450, PlotRangePadding -> {Scaled[.05], Scaled[.1]}, PlotLegends -> PointLegend[Automatic, LegendMarkerSize -> {40, 30}], ImageSize -> 450]](https://www.wolframcloud.com/obj/resourcesystem/images/ddd/ddde2ab7-b449-427d-a364-bf9251afa485/3-0-1/203cc23a72e4dab6.png)
|
| Out[34]= |
|
| In[35]:= |
![hfm2[name_String, size_ : 9] := Show[
ResourceFunction["PolygonMarker"][name, Offset@size, {
FaceForm[White],
Dynamic@
EdgeForm[{CurrentValue["Color"], AbsoluteThickness[1], Opacity[1]}]}],
Graphics[{EdgeForm[None], Replace[RegionDifference[ResourceFunction["PolygonMarker"][name],
Rectangle[{-10, -10}, {10, 0}]], p : {x_, y_} :> Offset[size p, {0, 0}], {-2}]}]];
data = Table[{x, BesselJ[k, x]}, {k, 0, 3}, {x, 0, 10, 0.5}];
ListPlot[data, PlotMarkers -> hfm2 /@ {"Diamond", "Square", "Circle", "RightTriangle"}, Joined -> True, Frame -> True, Axes -> False, ImageSize -> 450, PlotRangePadding -> {Scaled[.05], Scaled[.1]}, PlotLegends -> PointLegend[Automatic, LegendMarkerSize -> {40, 30}], ImageSize -> 450]](https://www.wolframcloud.com/obj/resourcesystem/images/ddd/ddde2ab7-b449-427d-a364-bf9251afa485/3-0-1/3d7597e4ca5092b7.png)
|
| Out[37]= |

|
| In[38]:= |
![hfm3[name_String, size_ : 9] := Show[
ResourceFunction["PolygonMarker"][name, Offset@size, {
FaceForm[White],
Dynamic@
EdgeForm[{CurrentValue["Color"], AbsoluteThickness[1], Opacity[1]}]}],
Graphics[{EdgeForm[None], Replace[RegionDifference[ResourceFunction["PolygonMarker"][name],
Triangle[{{-10, -10}, {10, 10}, {10, -10}}]], p : {x_, y_} :> Offset[size p, {0, 0}], {-2}]}]];
data = Table[{x, BesselJ[k, x]}, {k, 0, 3}, {x, 0, 10, 0.5}];
ListPlot[data, PlotMarkers -> hfm3 /@ {"Diamond", "Square", "Circle", "DiagonalFourPointedStar"}, Joined -> True, Frame -> True, Axes -> False, ImageSize -> 450, PlotRangePadding -> {Scaled[.05], Scaled[.1]}, PlotLegends -> PointLegend[Automatic, LegendMarkerSize -> {40, 38}], ImageSize -> 450]](https://www.wolframcloud.com/obj/resourcesystem/images/ddd/ddde2ab7-b449-427d-a364-bf9251afa485/3-0-1/102fd3946fe2a9a9.png)
|
| Out[40]= |
|
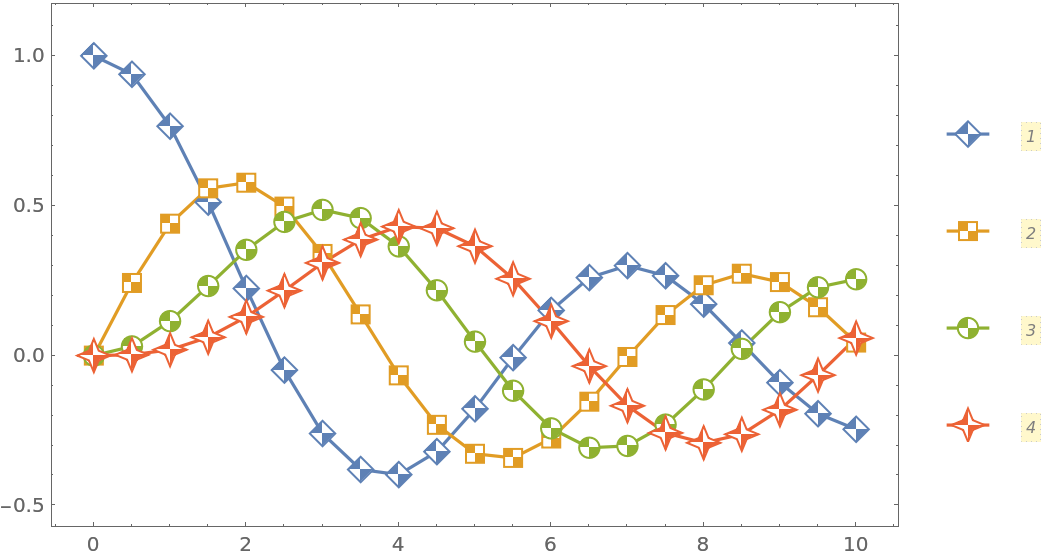
Contrast markers that pick up PlotStyle and PlotTheme automatically:
| In[41]:= |
![cfm1[name_String, size_ : 9] := Show[
ResourceFunction["PolygonMarker"][name, Offset@size, {
FaceForm[White],
Dynamic@
EdgeForm[{CurrentValue["Color"], AbsoluteThickness[1], Opacity[1]}]}],
Graphics[{EdgeForm[None], Replace[RegionDifference[
RegionDifference[ResourceFunction["PolygonMarker"][name], Rectangle[{0, 0}, {10, 10}]], Rectangle[{0, 0}, {-10, -10}]], p : {x_, y_} :> Offset[size p, {0, 0}], {-2}]}]];
data = Table[{x, BesselJ[k, x]}, {k, 0, 3}, {x, 0, 10, 0.5}];
ListPlot[data, PlotMarkers -> cfm1 /@ {"Diamond", "Square", "Circle", "FourPointedStar"}, Joined -> True, Frame -> True, Axes -> False, ImageSize -> 450, PlotRangePadding -> {Scaled[.05], Scaled[.1]}, PlotLegends -> PointLegend[Automatic, LegendMarkerSize -> {40, 38}], ImageSize -> 450]](https://www.wolframcloud.com/obj/resourcesystem/images/ddd/ddde2ab7-b449-427d-a364-bf9251afa485/3-0-1/25b3e32c3052c52e.png)
|
| Out[43]= |
|
| In[44]:= |
![cfm2[name_String, size_ : 9] := Show[
ResourceFunction["PolygonMarker"][name, Offset@size, {
FaceForm[White],
Dynamic@
EdgeForm[{CurrentValue["Color"], AbsoluteThickness[1], Opacity[1]}]}],
Graphics[{EdgeForm[None], Replace[RegionDifference[
RegionDifference[ResourceFunction["PolygonMarker"][name], Triangle[{{-10, 10}, {10, 10}, {0, 0}}]], Triangle[{{-10, -10}, {10, -10}, {0, 0}}]], p : {x_, y_} :> Offset[size p, {0, 0}], {-2}]}]];
data = Table[{x, BesselJ[k, x]}, {k, 0, 3}, {x, 0, 10, 0.5}];
ListPlot[data, PlotMarkers -> cfm2 /@ {"Diamond", "Square", "Circle", "DiagonalFourPointedStar"}, Joined -> True, Frame -> True, Axes -> False, ImageSize -> 450, PlotRangePadding -> {Scaled[.05], Scaled[.1]}, PlotLegends -> PointLegend[Automatic, LegendMarkerSize -> {40, 30}], ImageSize -> 450]](https://www.wolframcloud.com/obj/resourcesystem/images/ddd/ddde2ab7-b449-427d-a364-bf9251afa485/3-0-1/7984f684e0f5834d.png)
|
| Out[46]= |

|
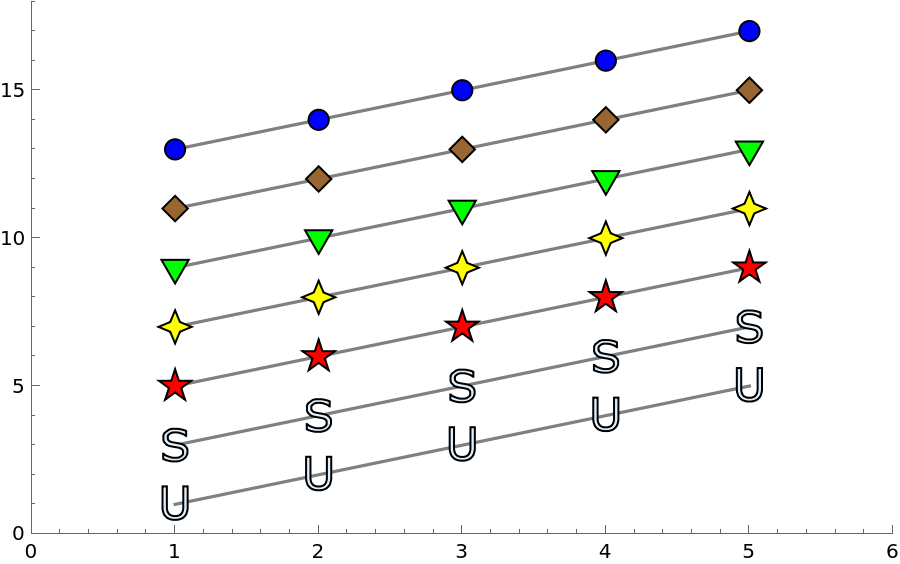
Create an auxiliary function that (approximately) converts a simple glyph into a set of points suitable for PolygonMarker:
| In[47]:= |
![pts[l_String] := First[Cases[
ImportString[
ExportString[Style[l, FontFamily -> "Verdana", FontSize -> 20], "PDF"], If[$VersionNumber >= 12.2, {"PDF", "PageGraphics"}, {"PDF", "Pages"}]], c_FilledCurve :> c[[2, 1]], Infinity]];](https://www.wolframcloud.com/obj/resourcesystem/images/ddd/ddde2ab7-b449-427d-a364-bf9251afa485/3-0-1/0a233631a1fd4ad4.png)
|
Show a set of markers in use, including some created from glyphs:
| In[48]:= |
![(* Evaluate this cell to get the example input *) CloudGet["https://www.wolframcloud.com/obj/518eb708-25de-40b5-892d-81a60d2eeb8f"]](https://www.wolframcloud.com/obj/resourcesystem/images/ddd/ddde2ab7-b449-427d-a364-bf9251afa485/3-0-1/79c87d6f40659799.png)
|
| Out[48]= |
|
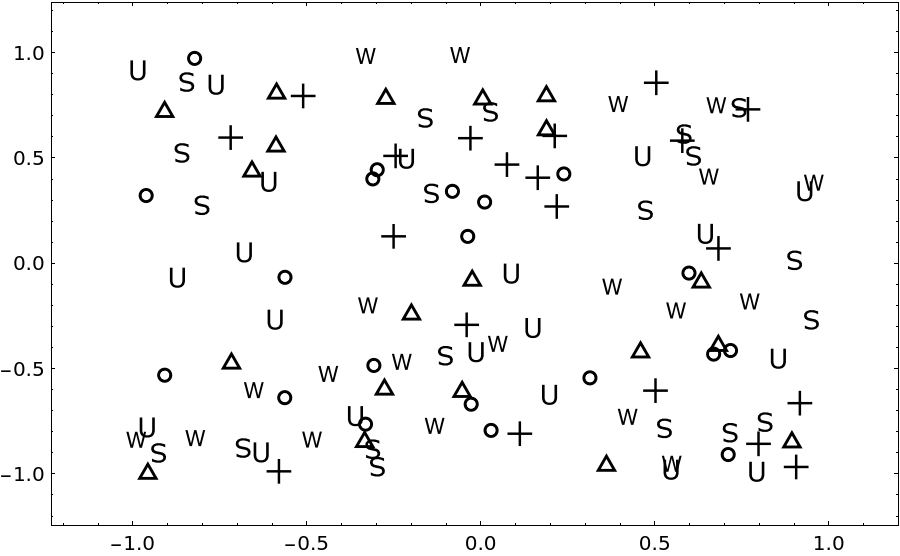
Black-and-white plot, where the markers overlap considerably:
| In[49]:= |
![(* Evaluate this cell to get the example input *) CloudGet["https://www.wolframcloud.com/obj/330b55e0-edf9-4f07-80d0-73eb4a1cab64"]](https://www.wolframcloud.com/obj/resourcesystem/images/ddd/ddde2ab7-b449-427d-a364-bf9251afa485/3-0-1/79e22931db5eece4.png)
|
| Out[50]= |
|
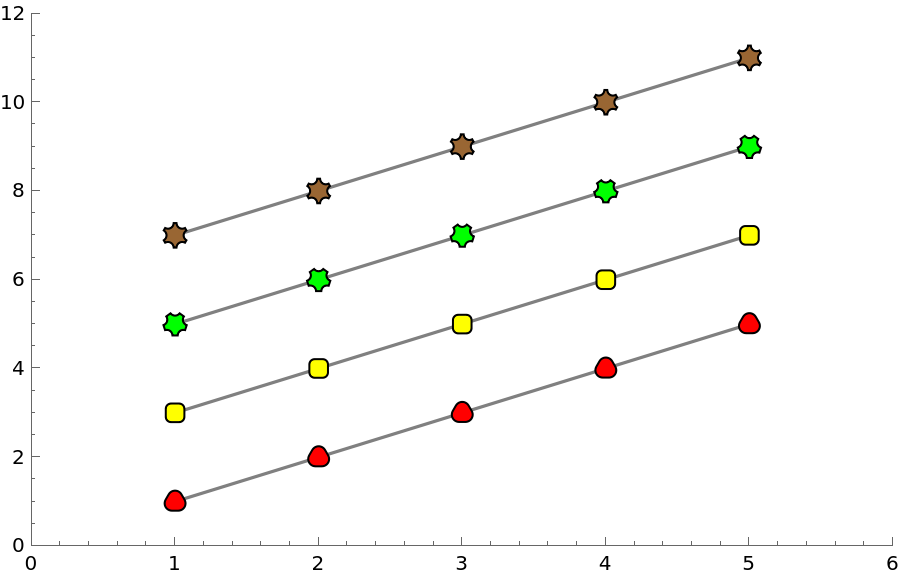
Use the resource functions RoundedPolygon and NotchedPolygon to make markers:
| In[51]:= |
![(* Evaluate this cell to get the example input *) CloudGet["https://www.wolframcloud.com/obj/da8994c4-50a4-428f-89aa-a08502f82179"]](https://www.wolframcloud.com/obj/resourcesystem/images/ddd/ddde2ab7-b449-427d-a364-bf9251afa485/3-0-1/4701198f7000c3ea.png)
|
| Out[51]= |
|
This work is licensed under a Creative Commons Attribution 4.0 International License