Wolfram Function Repository
Instant-use add-on functions for the Wolfram Language
Function Repository Resource:
Get a dynamic plot of a univariate function along with supplemental information
ResourceFunction["Kurvendiskussion"][expr,x] returns a dynamic plot of expr, viewed as a function of x, allowing the additional display of related points and functions of interest. |
Plot a Kurvendiskussion for a trigonometric function:
| In[1]:= |
| Out[1]= | 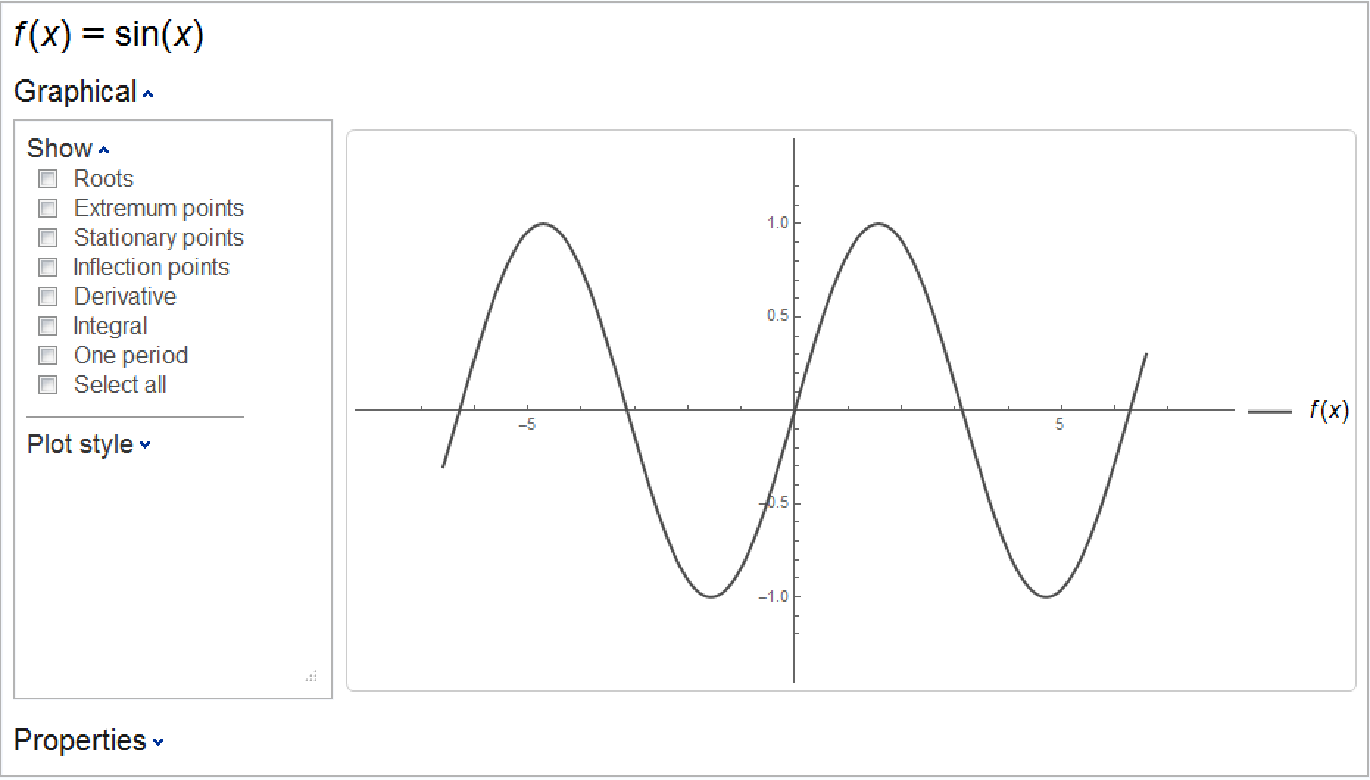 |
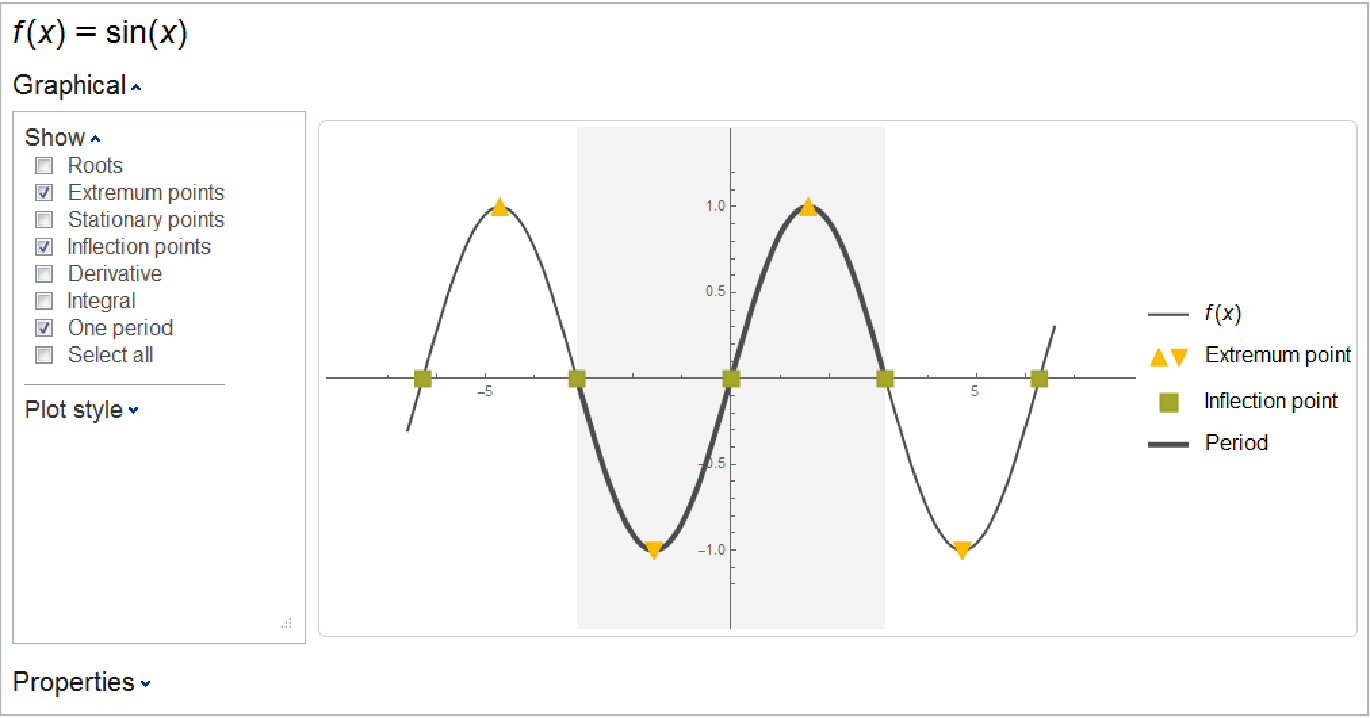
Select some additional elements to display:
Plot a Gaussian function along with its extremum:
| In[2]:= |
| Out[2]= | 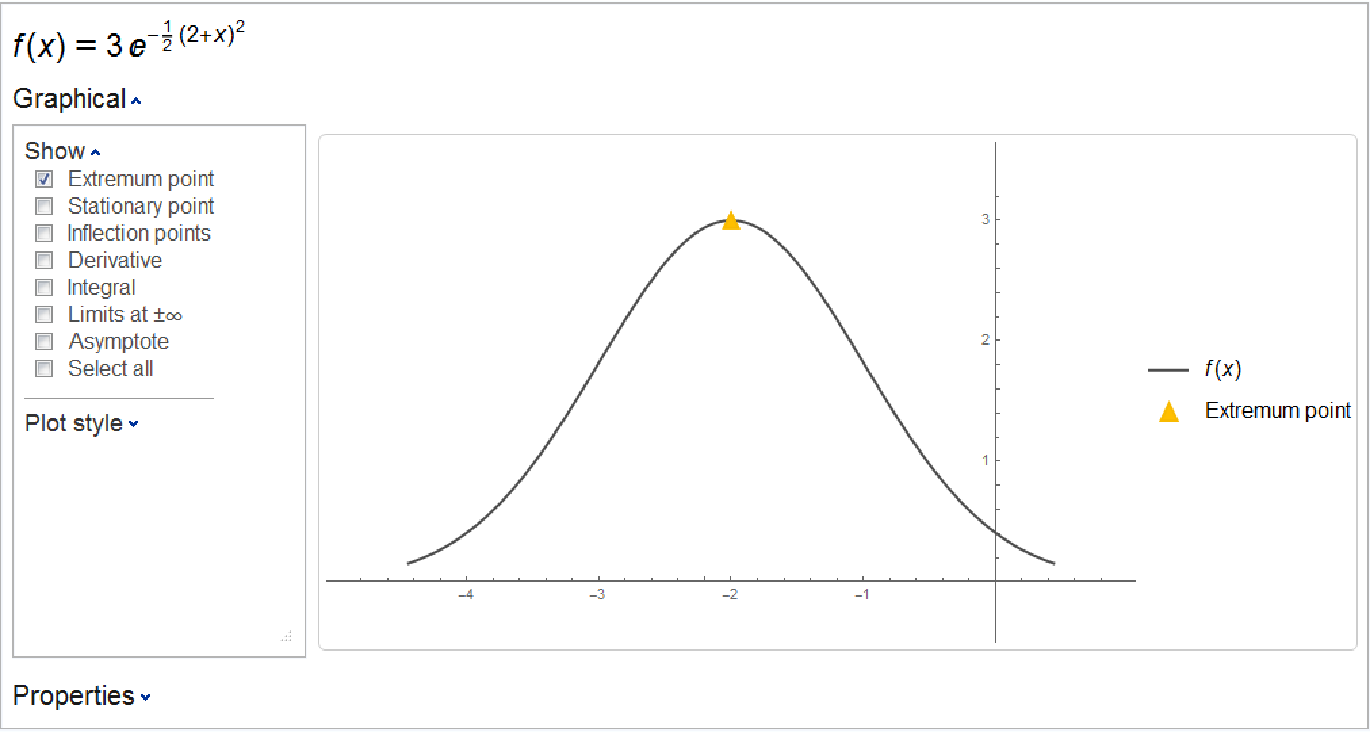 |
Plot a function along with its roots and inflection points:
| In[3]:= |
| Out[3]= | 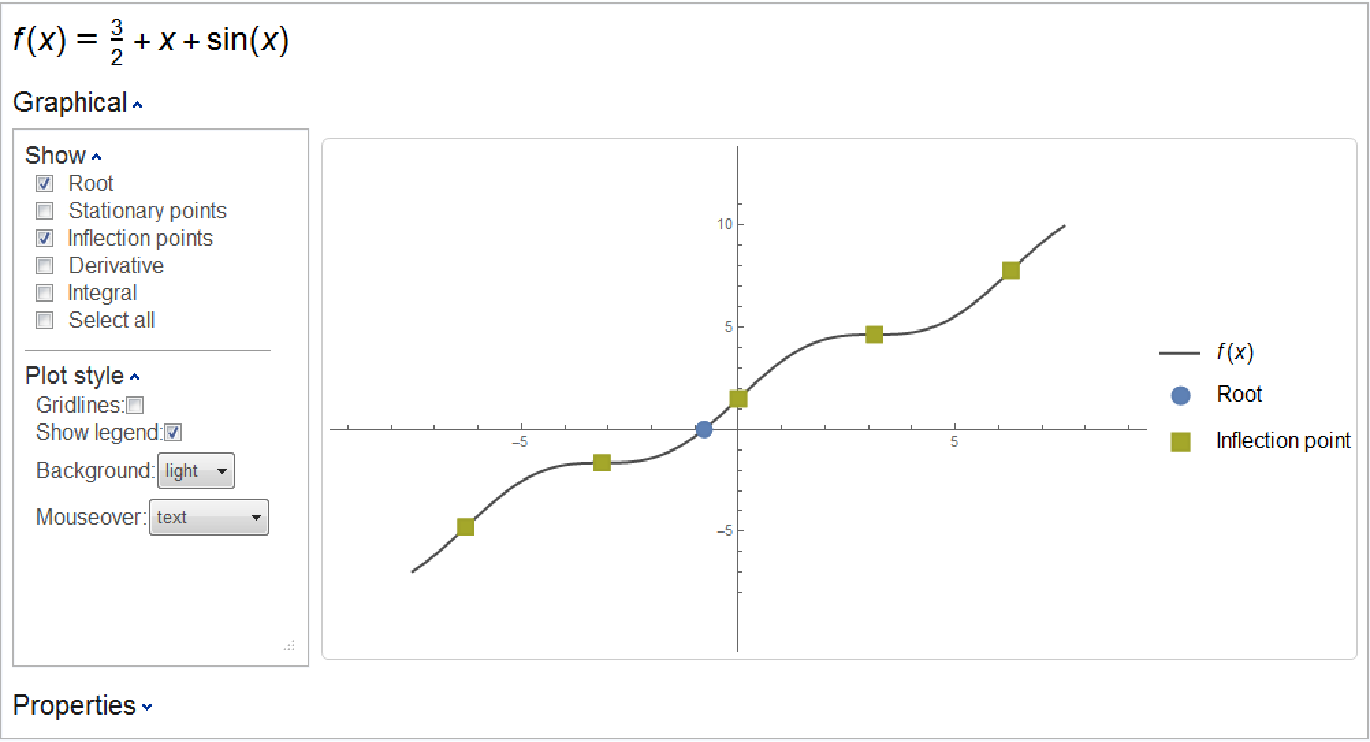 |
The plotted inflection points are the same as those returned by the resource function InflectionPoints:
| In[4]:= |
| Out[4]= |
Plot a rational function along with its stationary points, also showing Gridlines:
| In[5]:= |
| Out[5]= | 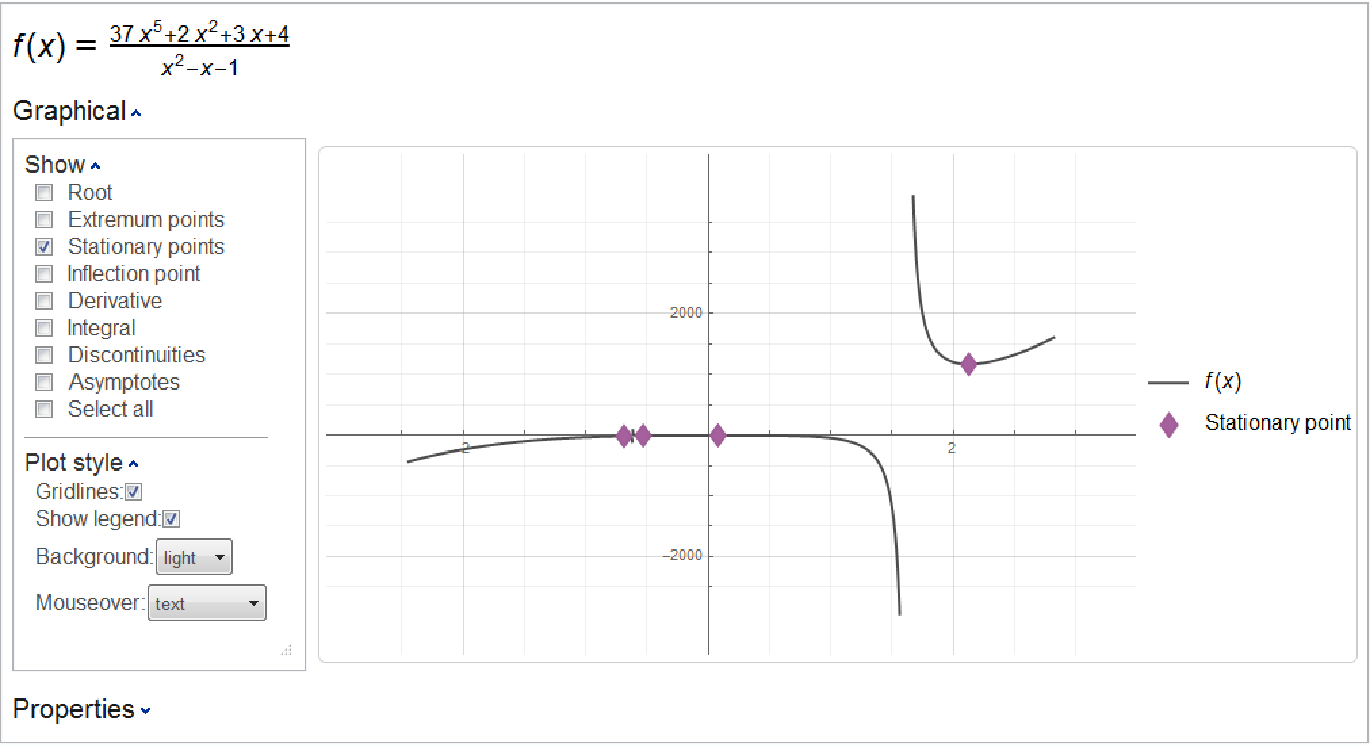 |
The four stationary points displayed are the same as those found by the resource function StationaryPoints:
| In[6]:= |
| In[7]:= |
| Out[7]= |
Plot a function along with its derivative, using a dark theme and GridLines:
| In[8]:= |
| Out[8]= | 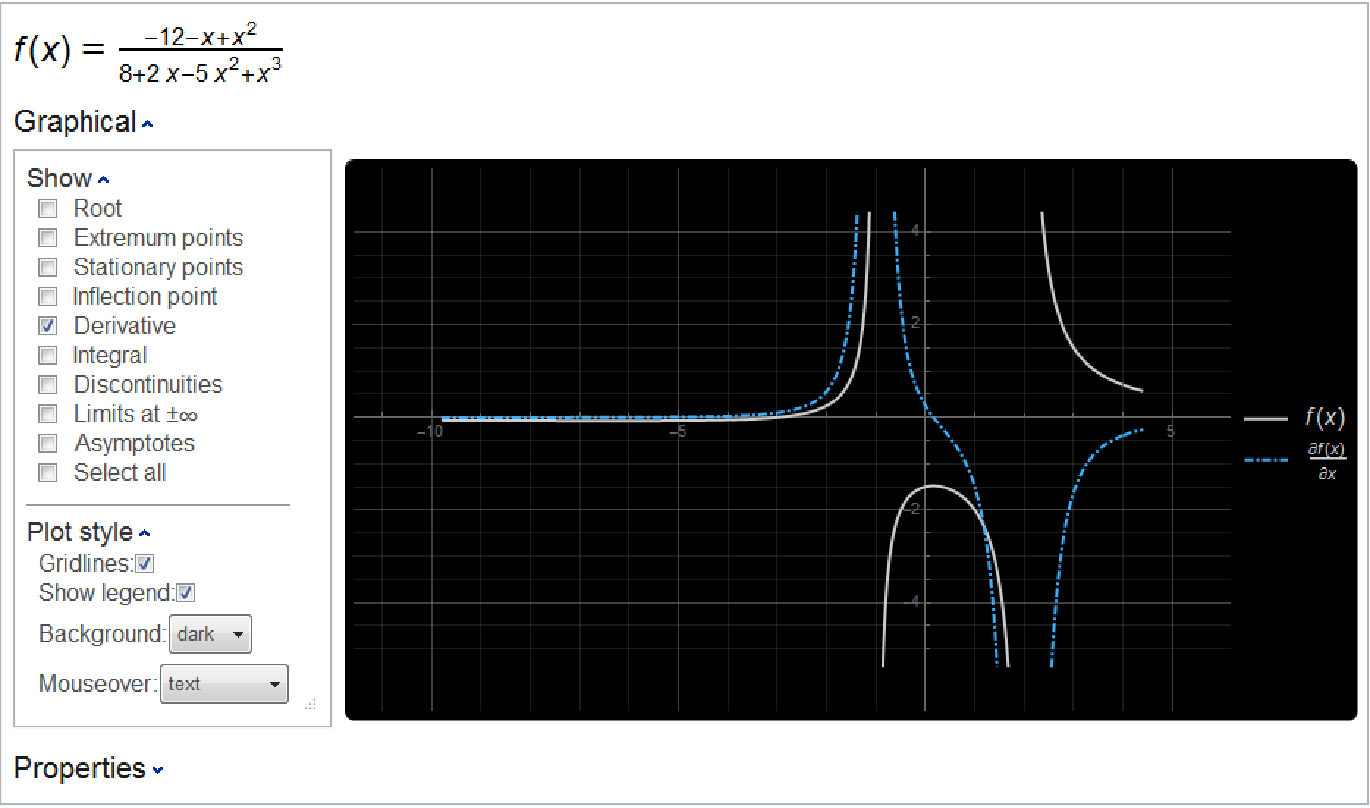 |
Plot a function along with its points of discontinuity:
| In[9]:= |
| Out[9]= | 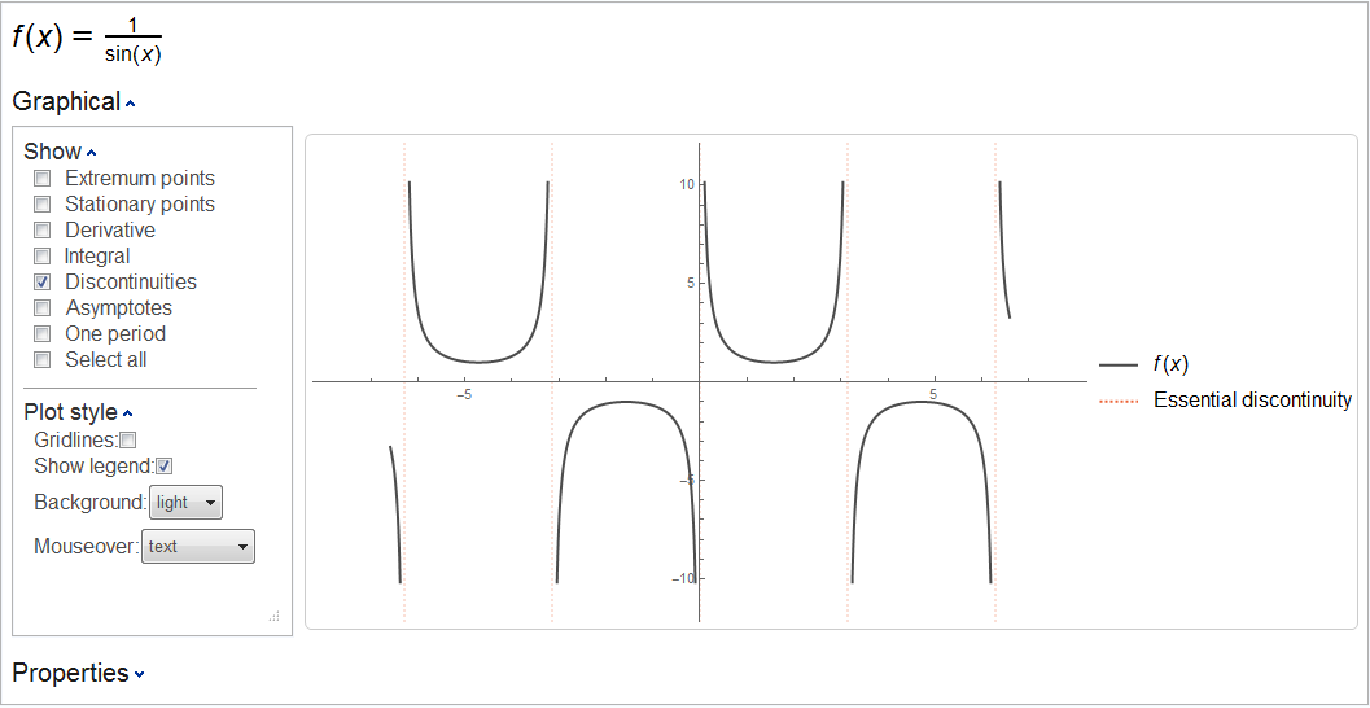 |
The discontinuities displayed are the same as those found by the resource function FunctionDiscontinuities:
| In[10]:= |
| Out[10]= |
Plot a function along with its parabolic asymptote:
| In[11]:= |
| Out[11]= | 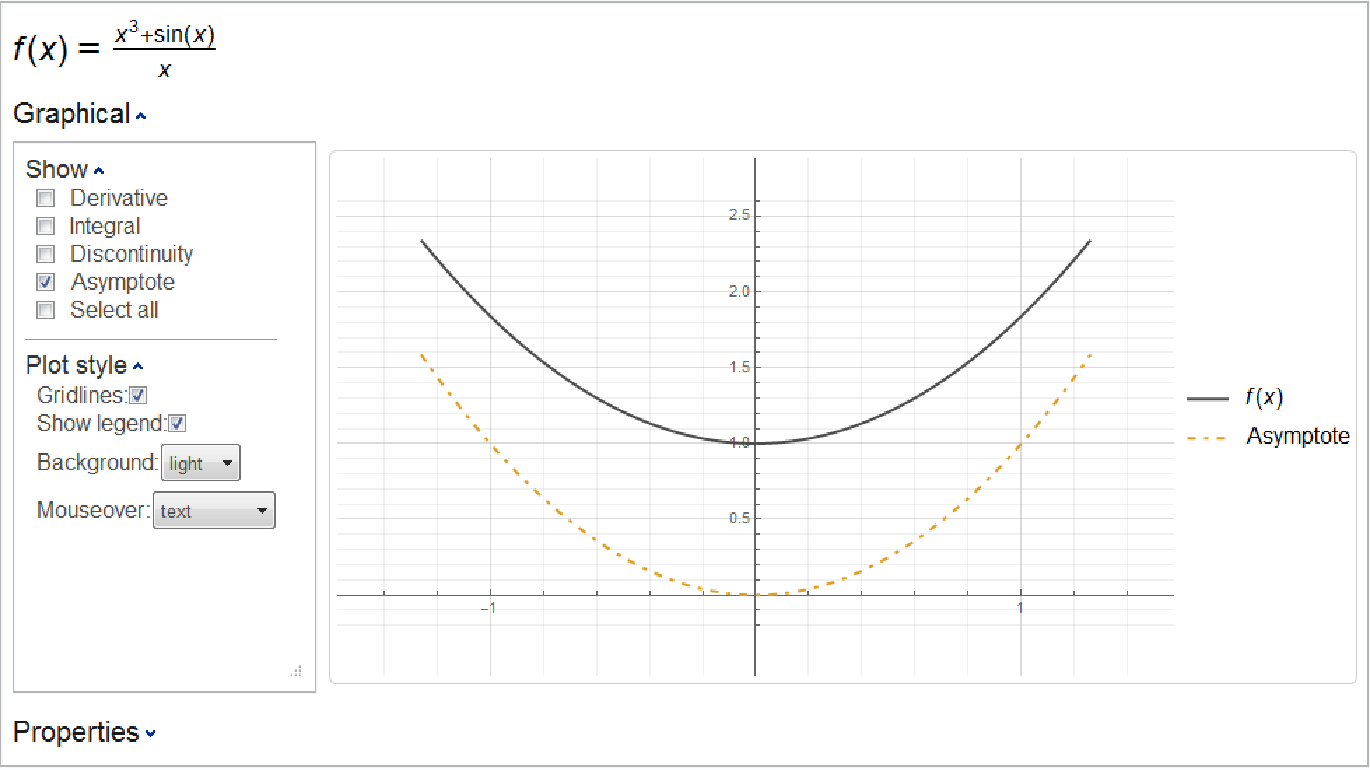 |
This is the same parabolic asymptote that is found by the resource function Asymptotes:
| In[12]:= |
| Out[12]= |
This work is licensed under a Creative Commons Attribution 4.0 International License