Details and Options
ResourceFunction["InteractiveGraphics"][graphics] will create a dynamic version of graphics that can be interacted with by zooming, panning and adding tooltip labels to objects in the plot.
The tooltip labels placed by ResourceFunction["InteractiveGraphics"] will always snap to objects, such as points and lines present in the graphic, ensuring that the coordinates are properly read out.
The following interactions are supported by default:
 + drag + drag |  | pan the plot around |
 / / + drag + drag |    | zoom into the plot |
| / + vertical/horizontal drag |  | zoom only along the vertical/horizontal axis |
| Double‐click |  | reset plot range to default |
| Click on point/line/… |  | add a tooltip label/move the active tooltip label |
| Click on label/anchor |   | select the tooltip label |
 / / + click on point/line/… + click on point/line/… |  | add additional tooltip labels |
| / + click on label | | remove the tooltip label |
| Drag label anchor |  | move the tooltip around |
| / + drag label anchor | | move the tooltip smoothly along lines |
| Drag label | | move the tooltip label around |
| Right-click + "Copy Tooltip Coordinates" | | copy the list of tooltip coordinates to the clipboard |
| Right-click + "Convert to Static Graphics" | | disable interactivity while keeping the current plot range and tooltips |
The cursor is changed dynamically to indicate the current action, as indicated by the previous table.
By default, the modifier keys are
,
and
on Windows and Linux, and
,
and
on macOS, as indicated in the previous table.
ResourceFunction["InteractiveGraphics"] accepts the following options:
| LabelStyle | {} | the style to apply to the tooltips |
| LabelingFunction | Identity | the function to apply to the tooltips before display |
| "LabelPosition" | "Attached" | how to position the tooltip labels |
| "AllowInterpolation" | CurrentValue["OptionKey"] | whether to allow interpolation between corner points of lines |
| "AllowedActions" | All | which types of interactions to allow |
| "UseLinkHandCursor" | True | whether to use the "LinkHand" cursor for all objects that can be tooltipped |
| "ModifierKeys" | {"OptionKey","ShiftKey","ControlKey","CommandKey"} | which modifier key to use for which interaction |
| "LabelMoveMethod" | Automatic | how to move tooltips when the plot is updated |
| "ReplottingMethod" | None | method to use to update the plot when zooming and panning |
| "GroupingStrategy" | "Color" | how to attempt to group the plot elements |
The option
LabelStyle is effectively applied to all tooltip labels and can be a list of any of the options supported by
Framed.
ResourceFunction["InteractiveGraphics"] effectively uses the setting of
CoordinatesToolOptions to generate the contents of the labels and the coordinates copied by the "Copy Tooltip Coordinates" context menu option.
The "LabelPosition" option controls how the tooltip labels are placed in relation to the anchor points or the graphic.
The "LabelPositon" can be set to the following:
| "Attached" | label moves with the anchor and is fixed to one of the four corners |
| "Free" | label moves with the anchor, but can be placed anywhere |
| "FreeScaled" | label does not move with the anchor and can be positioned anywhere |
| pos | position the list of labels at the given position |
In
"LabelPosition"→pos,
pos can be a pair of numbers (with coordinates from 0 to 1), a symbolic position (
Left,Right,Bottom,Top or Center) or a combination of the two.
"AllowInterpolation" controls whether the anchors snap to the corner points of lines and similar objects, or whether any position along the line should be allowed.
With the default setting
"AllowInterpolation"⧴CurrentValue["OptionKey"], the snapping behavior can be changed by holding the
/
key while dragging the anchor around.
The "AllowedActions" option controls which types of interactions are supported. Possible values are:
| All | allow all interactions |
| "Zoom" | allow only zooming |
| "Pan" | allow only panning |
| "Label" | allow only the creation of a single tooltip label |
| "MultiLabel" | allow the creation of multiple tooltip labels |
| {act1,act2,…} | allow several interactions |
The option "ModifierKeys" controls the modifier keys that need to be held down to perform certain interactions.
The option "ModifierKeys" needs to be set to a list of three values, where the values specify the keys necessary for zooming, panning and label creation, respectively.
For each entry in the setting for
"ModifierKeys", a
CurrentValue argument can be given or a list of multiple alternatives can be specified as
opt1,opt2,…. In principle, any argument where
CurrentValue[arg] returns
True or
False is supported, but not all cases will work as expected.
The option
"LabelMoveMethod" controls how tooltip anchors are moved when the graphic in
ResourceFunction["InteractiveGraphics"][Dynamic[graphics]] is dynamically updated.
The following settings can be used for "LabelMoveMethod":
| Automatic | determine the method automatically based on the object type |
| "Horizontal" | allow only horizonal movements |
| "Vertical" | allow only vertical movements |
| Nearest | move to the nearest point |
The setting
"LabelMoveMethod"→Automatic is equivalent to "Vertical" for labels annotating lines, but tries to follow a given point when it is annotated by determining the index of the annotated point and finding the new point at that index.
For all settings of "LabelMoveMethod", only points along the same object group are considered (determined by index), where the object groups are determined by the "GroupingStrategy" option.
When no suitable position for a label can be found, it is put into an orphaned state, indicated by a red anchor point. The label can be reassigned to an object by making it active and clicking on an object to move it there.
The following settings can be used for "ReplottingMethod":
| None | do not automatically recreate the plot |
| Automatic | attempt to automatically recreate the plot |
| func | use a user-defined function to recreate the plot |
For the setting of
"ReplottingMethod" to have an effect, the first argument of
ResourceFunction["InteractiveGraphics"] must be wrapped in
Dynamic since the unevaluated form of the graphics is needed for it to work.
With the setting
"ReplottingMethod"→Automatic,
ResourceFunction["InteractiveGraphics"] attempts to automatically recreate the plot by passing an updated plot range to the plotting function in order to properly sample the plot range that is currently visible.
With the setting
"ReplottingMethod"→func, the specified function is used to create the updated plot. For
ResourceFunction["InteractiveGraphics"][Dynamic[expr],"ReplottingMethod"→func],
func[expr][plotRange] is evaluated with the current plot range in the form
{{xmin,xmax},{ymin,ymax}} whenever necessary.
The "GroupingStrategy" option controls how the contents of a plot are grouped together for the purposes of tooltip label movement.
When dragging a tooltip label anchor interactively, the anchor will only move to points of the same object. The grouping also affects the automatic label movement, as noted previously.
The following settings can be used for "GroupingStrategy":
| Automatic | try to use an automatic strategy that works for most plots |
| "Color" | group objects based on color |
| All | put all objects into one group |
| Annotation | use Annotation[prims,ResourceFunction["InteractiveGraphics"][Annotation]] as a grouping indicator |
The grouping strategy effectively examines the structure of the graphics expression from the outer levels inward, and when the first nontrivial structure is found, the items of that structure are grouped. Such structures might, for example, be lists of several elements, items with an explcit color given or
Annotation[…] wrappers.
ResourceFunction["InteractiveGraphics"]["FixAfterUndo"] can restore interactive functionality in certain situations involving the "Convert to Static Graphics" action, as explained in Possible Issues.
![ResourceFunction["InteractiveGraphics"][
Plot[{Sin[x], x^2/10}, {x, 0, 4}, Frame -> True]
]](https://www.wolframcloud.com/obj/resourcesystem/images/d07/d07cea43-45a0-4daf-9299-06167d0202f5/1017182870677ca8.png)
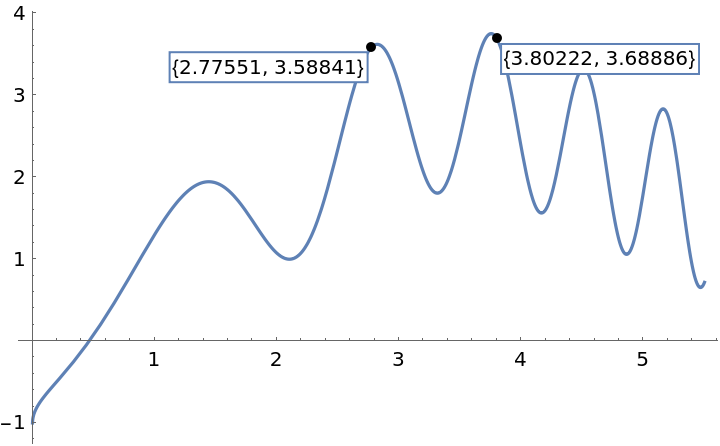
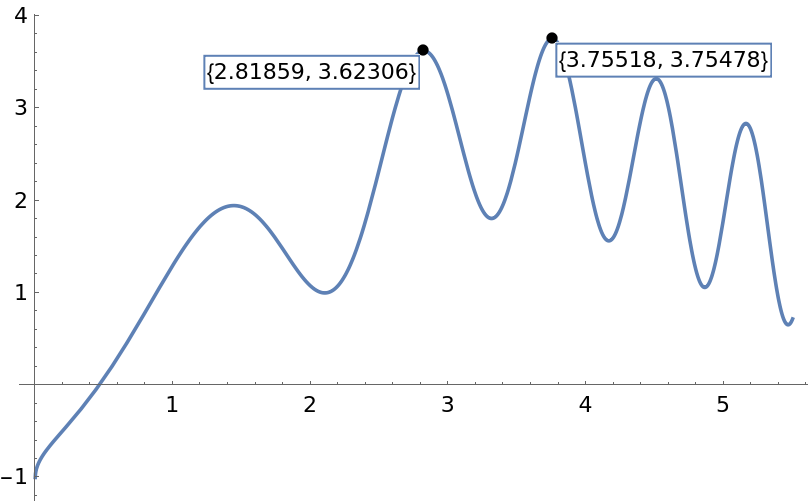
![ResourceFunction["InteractiveGraphics"][
Plot[Sin[x^2] - Cos[x] + \[Sqrt]x, {x, 0, 5.5}]
]](https://www.wolframcloud.com/obj/resourcesystem/images/d07/d07cea43-45a0-4daf-9299-06167d0202f5/53ada1623f8a59dc.png)
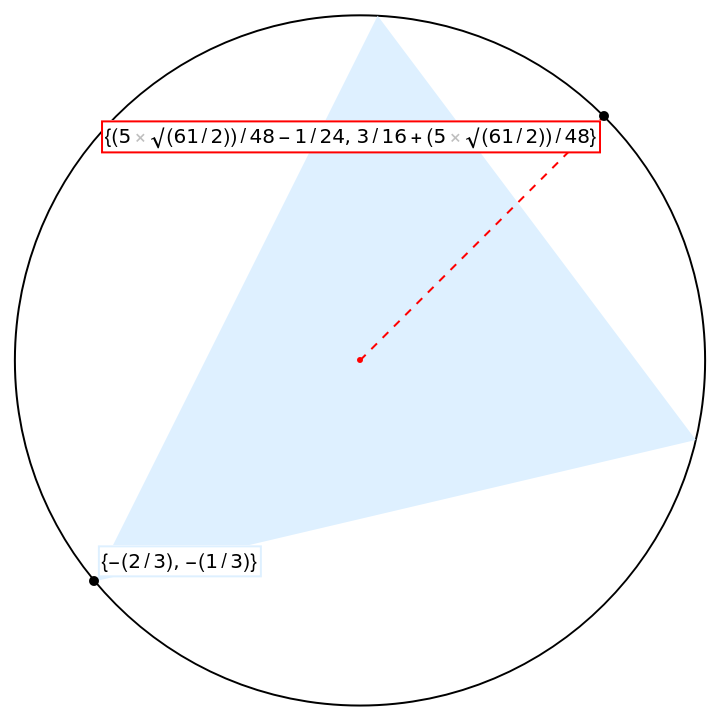
![pts = {{0, 1}, {-2/3, -1/3}, {3/4, 0}};
circ = Circumsphere[pts];
{c, r} = {First[circ], Last[circ]};
ResourceFunction["InteractiveGraphics"]@
Graphics[{circ, LightBlue, Triangle[pts], Red, Point[c], Dashed, Line[{c, c + r*Normalize[{1, 1}]}]}]](https://www.wolframcloud.com/obj/resourcesystem/images/d07/d07cea43-45a0-4daf-9299-06167d0202f5/6340662642a8b51d.png)
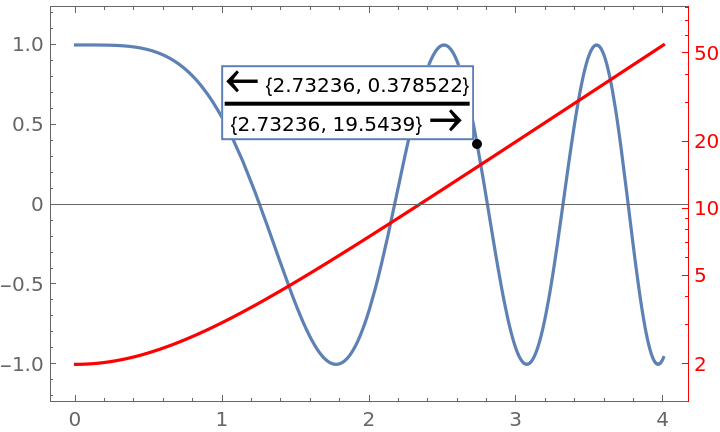
![ResourceFunction["InteractiveGraphics"][
ResourceFunction["CombinePlots"][
Plot[Cos[x^2], {x, 0, 4}, Frame -> True],
Plot[Exp[x] + Exp[-x], {x, 0, 4}, ScalingFunctions -> "Log", Frame -> True, PlotStyle -> Red, FrameStyle -> Red
],
"AxesSides" -> "TwoY"
]
]](https://www.wolframcloud.com/obj/resourcesystem/images/d07/d07cea43-45a0-4daf-9299-06167d0202f5/3df5aa7cdfe11470.png)
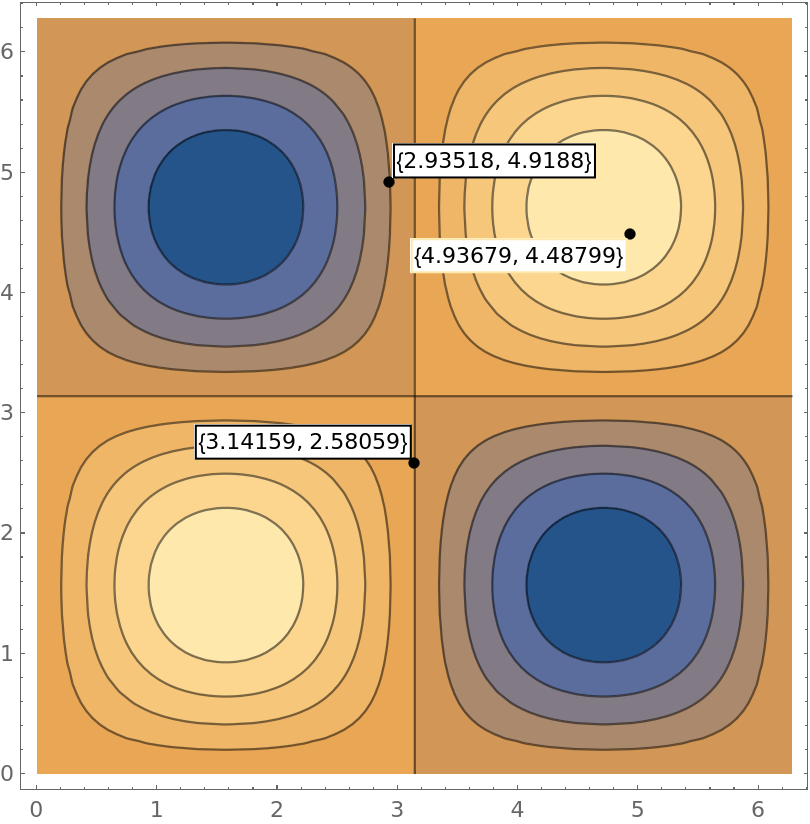
![ResourceFunction["InteractiveGraphics"][
ContourPlot[Sin[x] Sin[y], {x, 0, 2 \[Pi]}, {y, 0, 2 \[Pi]}]
]](https://www.wolframcloud.com/obj/resourcesystem/images/d07/d07cea43-45a0-4daf-9299-06167d0202f5/3c8f8b69aaaa2e52.png)
![ResourceFunction["InteractiveGraphics"][
Plot[Sin[x^2], {x, 0, 6}]
]](https://www.wolframcloud.com/obj/resourcesystem/images/d07/d07cea43-45a0-4daf-9299-06167d0202f5/56a0ef976318294a.png)
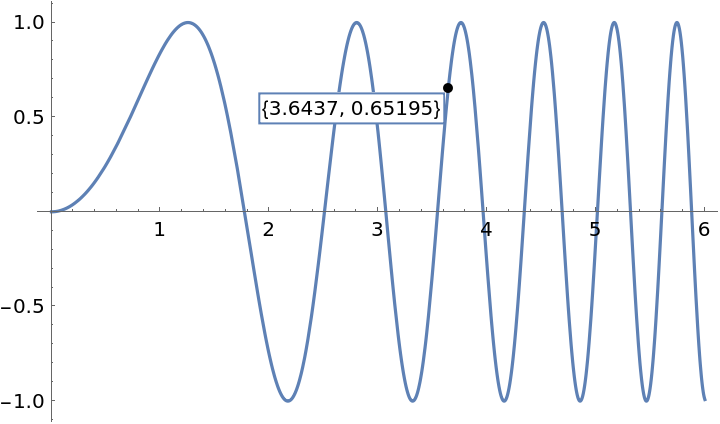
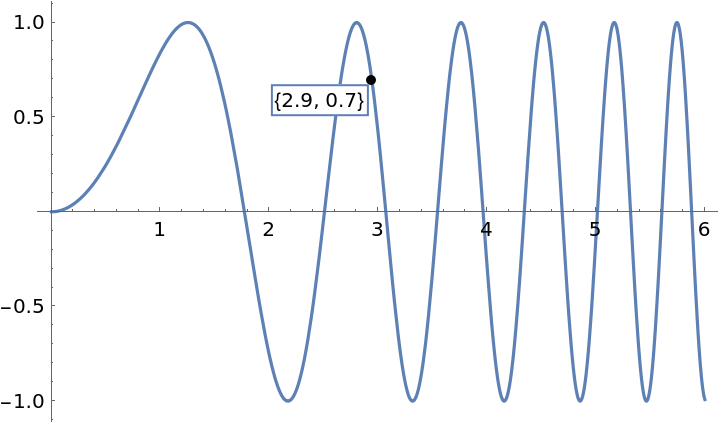
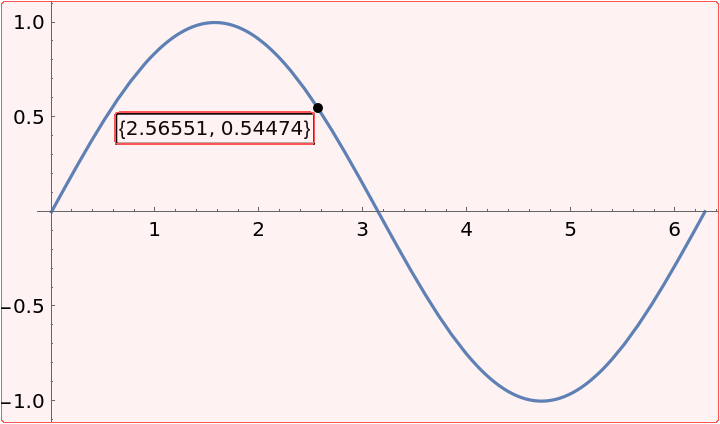
![ResourceFunction["InteractiveGraphics"][
Plot[Sin[x^2], {x, 0, 6}],
LabelStyle -> {FrameMargins -> 5, RoundingRadius -> 3, Alignment -> Center, Background -> Directive[White, Opacity@0.7]}
]](https://www.wolframcloud.com/obj/resourcesystem/images/d07/d07cea43-45a0-4daf-9299-06167d0202f5/2af667075a81848e.png)
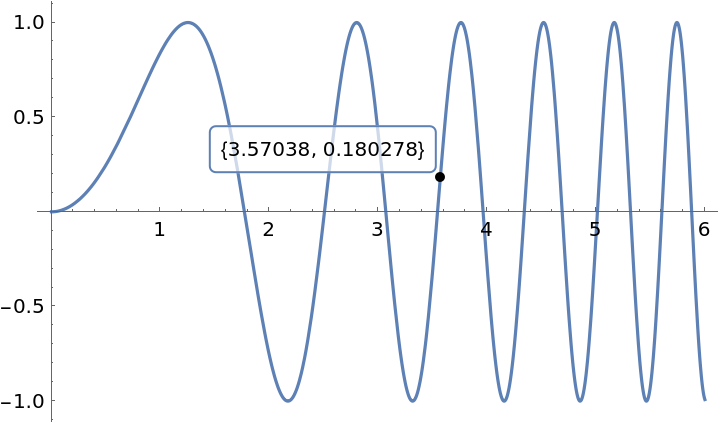
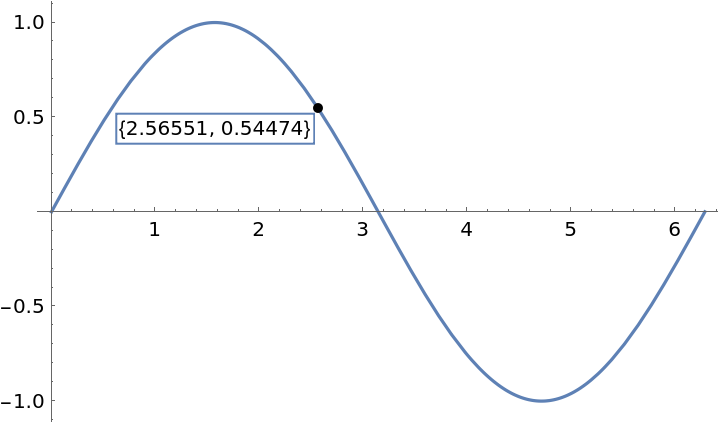
![ResourceFunction["InteractiveGraphics"][
Plot[Sin[x^2], {x, 0, 6}]
]](https://www.wolframcloud.com/obj/resourcesystem/images/d07/d07cea43-45a0-4daf-9299-06167d0202f5/4dfc66c72dce2b19.png)
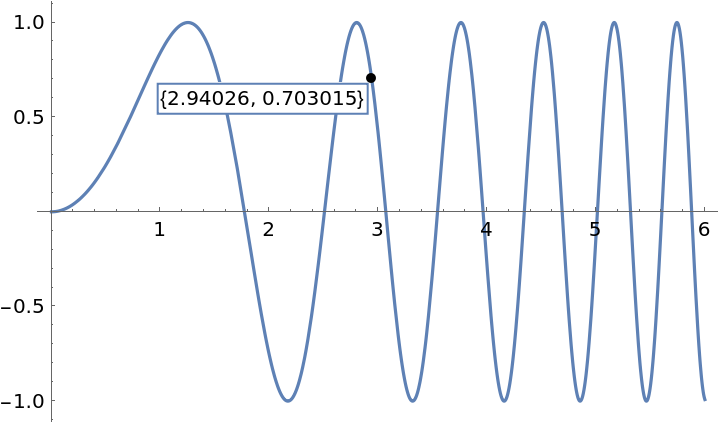
![ResourceFunction["InteractiveGraphics"][
Plot[Sin[x^2], {x, 0, 6}],
LabelingFunction -> (NumberForm[#, 2] &)
]](https://www.wolframcloud.com/obj/resourcesystem/images/d07/d07cea43-45a0-4daf-9299-06167d0202f5/0854de9a188e1231.png)
![ResourceFunction["InteractiveGraphics"][
Plot[0.2 x^3 - x^2, {x, 0, 6}, Frame -> True]
]](https://www.wolframcloud.com/obj/resourcesystem/images/d07/d07cea43-45a0-4daf-9299-06167d0202f5/42b98ddb547dbcd7.png)
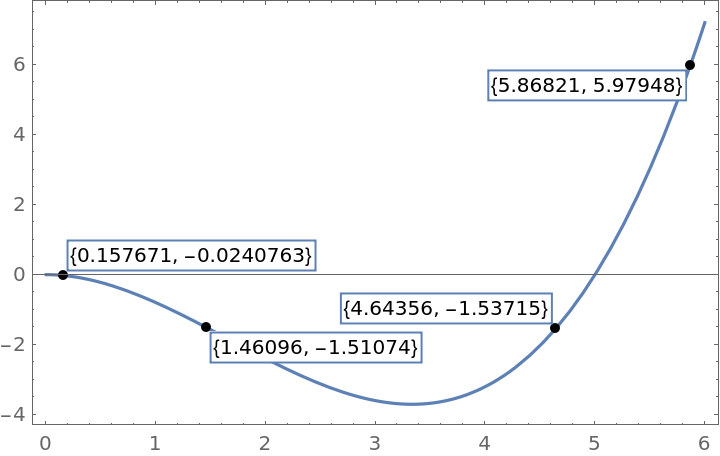
![ResourceFunction["InteractiveGraphics"][
Plot[0.2 x^3 - x^2, {x, 0, 6}, Frame -> True],
"LabelPosition" -> "Free"
]](https://www.wolframcloud.com/obj/resourcesystem/images/d07/d07cea43-45a0-4daf-9299-06167d0202f5/3aa00a6f404df240.png)
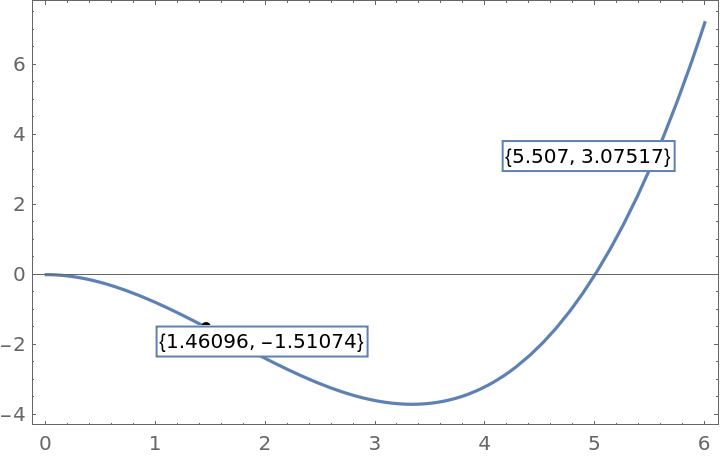
![ResourceFunction["InteractiveGraphics"][
Plot[0.2 x^3 - x^2, {x, 0, 6}, Frame -> True],
"LabelPosition" -> "FreeScaled"
]](https://www.wolframcloud.com/obj/resourcesystem/images/d07/d07cea43-45a0-4daf-9299-06167d0202f5/350ae89cac76cd81.png)
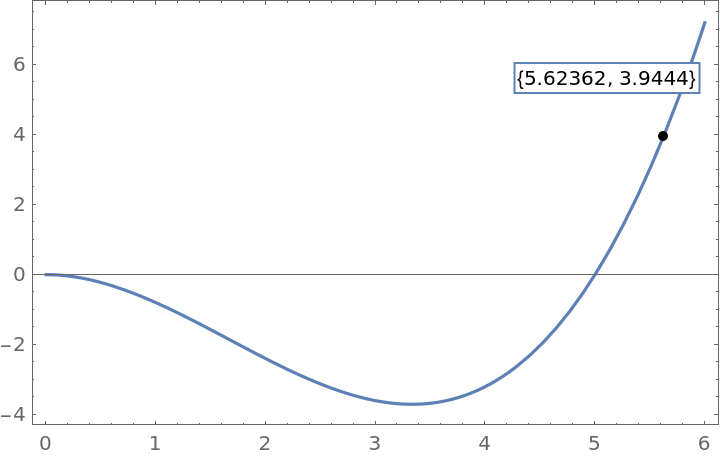
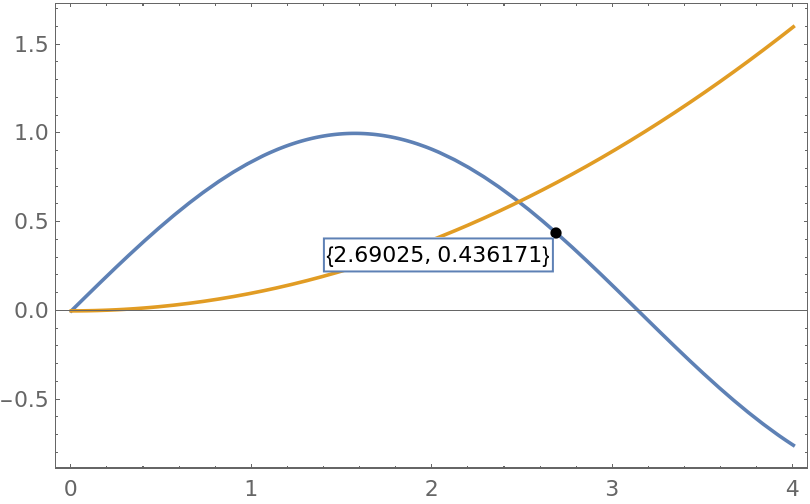
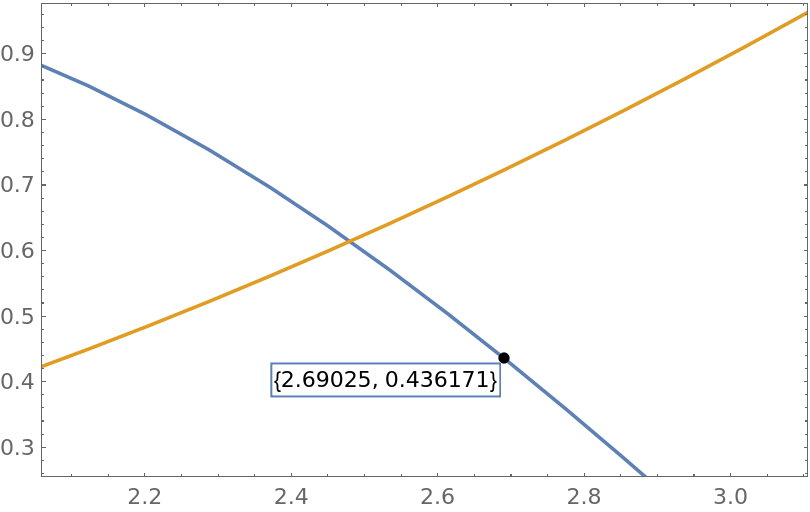
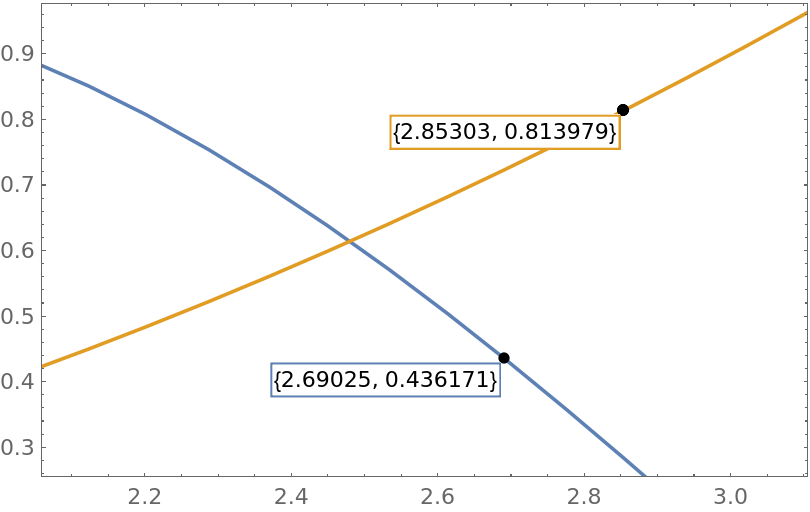
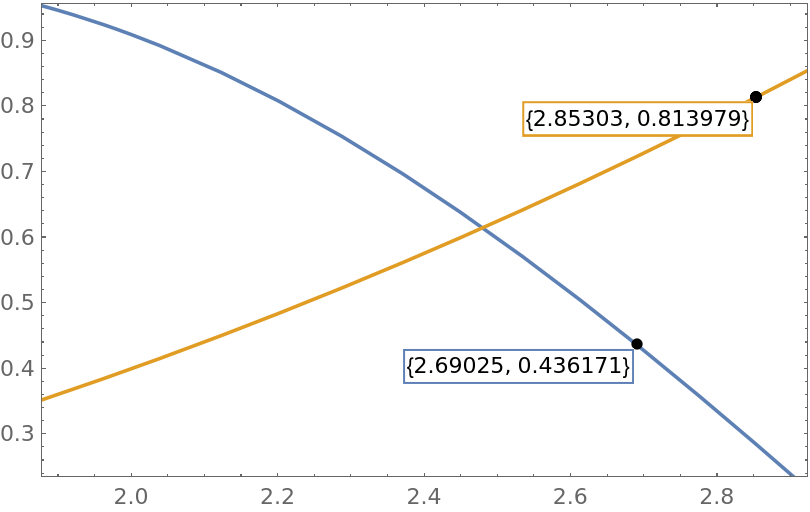
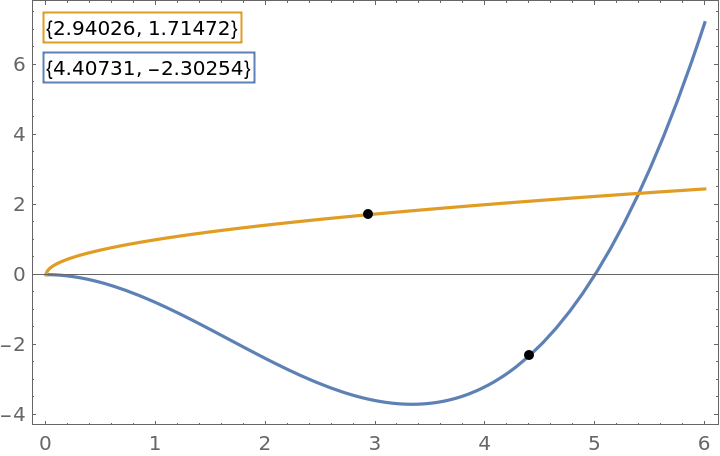
![ResourceFunction["InteractiveGraphics"][
Plot[{0.2 x^3 - x^2, \[Sqrt]x}, {x, 0, 6}, Frame -> True],
"LabelPosition" -> {Top, Left}
]](https://www.wolframcloud.com/obj/resourcesystem/images/d07/d07cea43-45a0-4daf-9299-06167d0202f5/295fe78bc458cfb3.png)
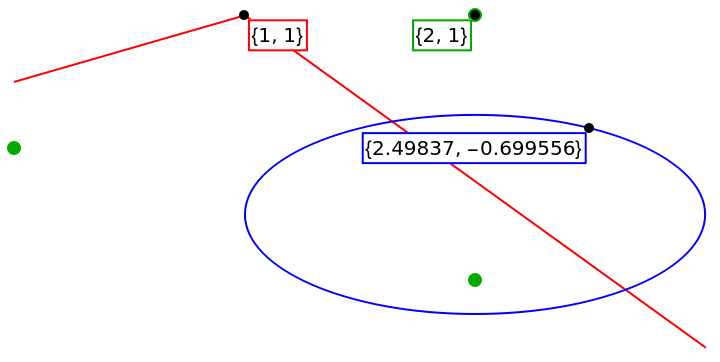
![ResourceFunction["InteractiveGraphics"][
Graphics[
{
Red,
Line@{{0, 0}, {1, 1}, {3, -4}},
Blue,
Circle[{2, -2}, {1, 1.5}],
Darker@Green, PointSize@Large,
Point@{{0, -1}, {2, 1}, {2, -3}}
},
AspectRatio -> 1/2
]
]](https://www.wolframcloud.com/obj/resourcesystem/images/d07/d07cea43-45a0-4daf-9299-06167d0202f5/7ef40810c7d3f631.png)
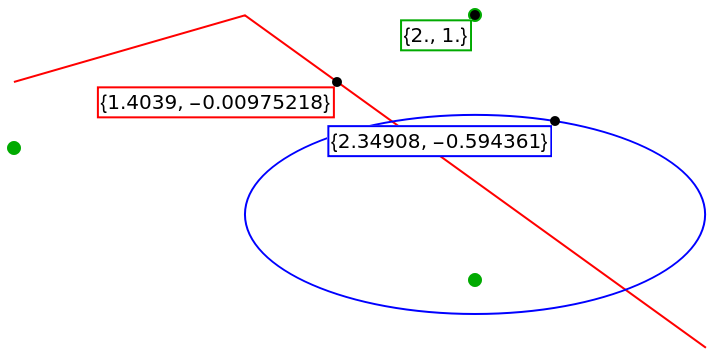
![ResourceFunction["InteractiveGraphics"][
Graphics[
{
Red,
Line@{{0, 0}, {1, 1}, {3, -4}},
Blue,
Circle[{2, -2}, {1, 1.5}],
Darker@Green,
PointSize@Large,
Point@{{0, -1}, {2, 1}, {2, -3}}
},
AspectRatio -> 1/2
],
"AllowInterpolation" -> True
]](https://www.wolframcloud.com/obj/resourcesystem/images/d07/d07cea43-45a0-4daf-9299-06167d0202f5/32ec4ab51d328ec5.png)
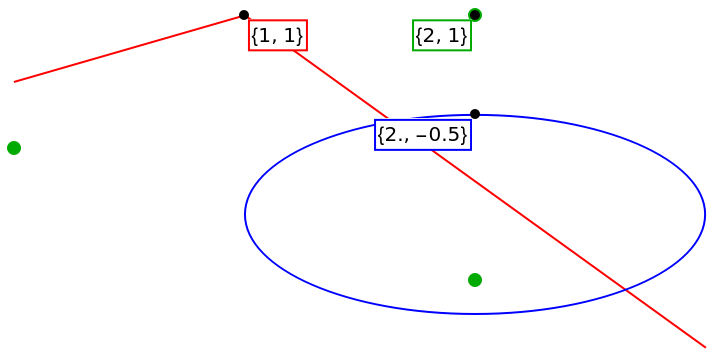
![ResourceFunction["InteractiveGraphics"][
Graphics[
{
Red,
Line@{{0, 0}, {1, 1}, {3, -4}},
Blue,
Circle[{2, -2}, {1, 1.5}],
Darker@Green,
PointSize@Large,
Point@{{0, -1}, {2, 1}, {2, -3}}
},
AspectRatio -> 1/2
],
"AllowInterpolation" -> False
]](https://www.wolframcloud.com/obj/resourcesystem/images/d07/d07cea43-45a0-4daf-9299-06167d0202f5/18a090f1bf004119.png)
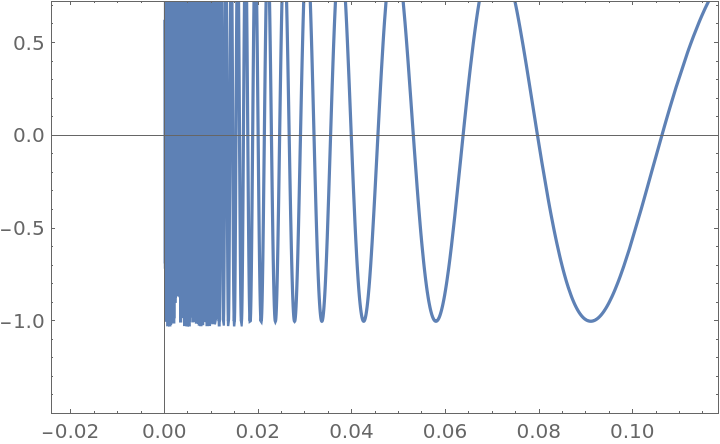
![ResourceFunction["InteractiveGraphics"][
Plot[Sin[1/x], {x, 0, 2}, MaxRecursion -> 10, PlotRange -> All, Frame -> True]
]](https://www.wolframcloud.com/obj/resourcesystem/images/d07/d07cea43-45a0-4daf-9299-06167d0202f5/221a1379573f4e52.png)

![ResourceFunction["InteractiveGraphics"][
Plot[Sin[1/x], {x, 0, 2}, MaxRecursion -> 10, PlotRange -> All, Frame -> True],
"AllowedActions" -> {"Zoom", "Pan"}
]](https://www.wolframcloud.com/obj/resourcesystem/images/d07/d07cea43-45a0-4daf-9299-06167d0202f5/1187ac0de84ad9b8.png)
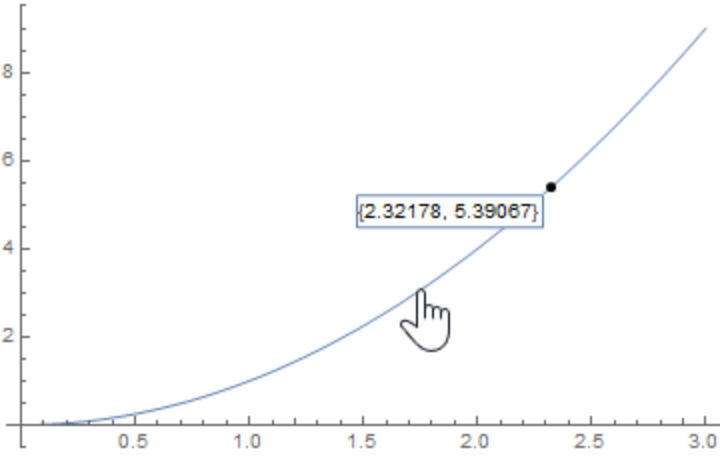
![ResourceFunction["InteractiveGraphics"][
Plot[x^2, {x, 0, 3}]
]](https://www.wolframcloud.com/obj/resourcesystem/images/d07/d07cea43-45a0-4daf-9299-06167d0202f5/0e06f7ed70f45316.png)
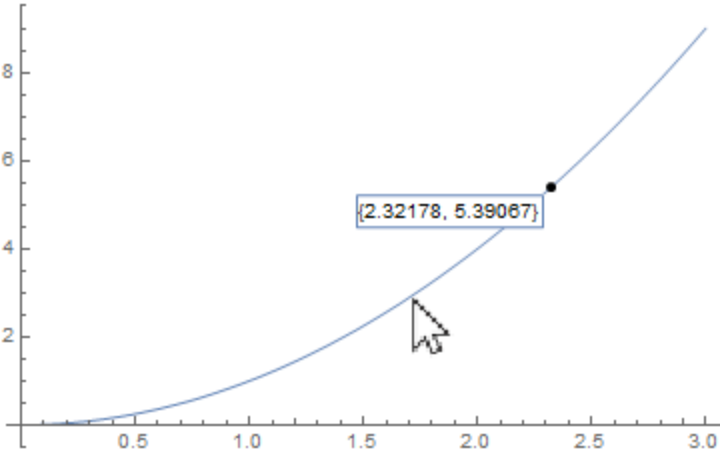
![ResourceFunction["InteractiveGraphics"][
Plot[x^2, {x, 0, 3}],
"UseLinkHandCursor" -> False
]](https://www.wolframcloud.com/obj/resourcesystem/images/d07/d07cea43-45a0-4daf-9299-06167d0202f5/656023401d848a8e.png)
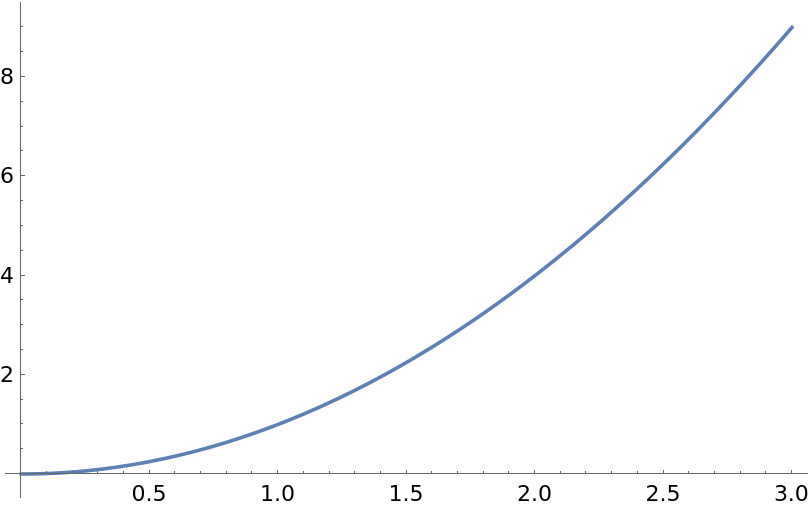
![ResourceFunction["InteractiveGraphics"][
Plot[x^2, {x, 0, 3}],
"ModifierKeys" -> {"ShiftKey", "OptionKey", "ControlKey" | "CommandKey"}
]](https://www.wolframcloud.com/obj/resourcesystem/images/d07/d07cea43-45a0-4daf-9299-06167d0202f5/27fd78c18a936398.png)
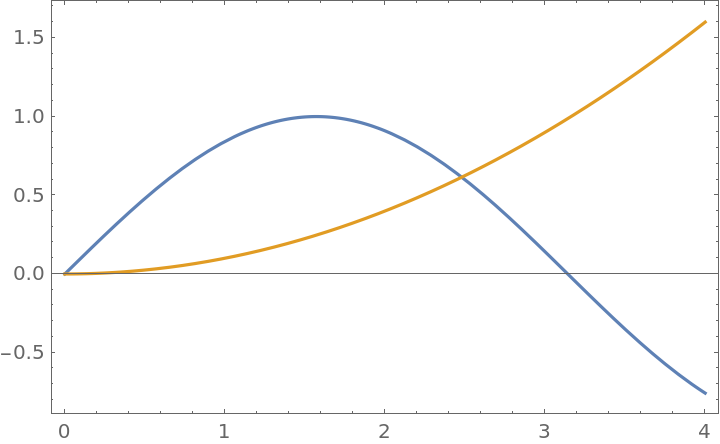
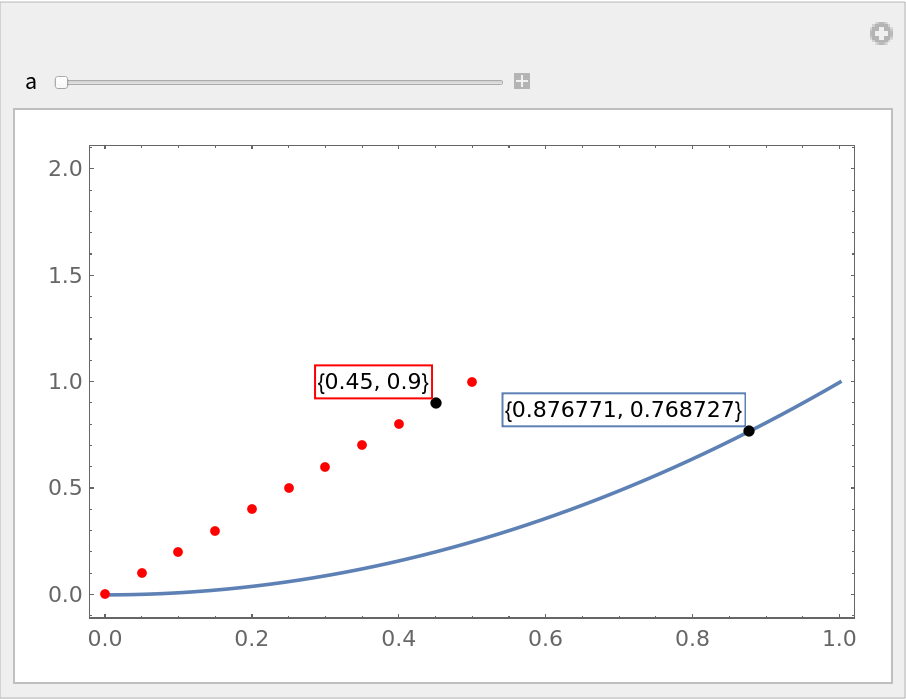
![plot[a_] := Show[
Plot[a x^2, {x, 0, 1}],
ListPlot[Table[{i a/2, i a}, {i, Subdivide[10]}], PlotStyle -> Red],
Frame -> True,
PlotRange -> {{0, 1}, {0, 2}}
]
Manipulate[
ResourceFunction["InteractiveGraphics"][Dynamic@plot[a]],
{a, 1, 3}
]](https://www.wolframcloud.com/obj/resourcesystem/images/d07/d07cea43-45a0-4daf-9299-06167d0202f5/063096b4b189fa97.png)
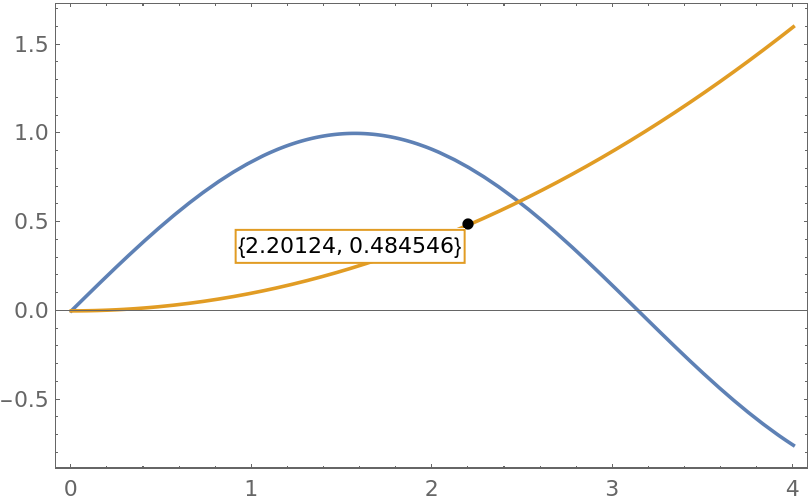
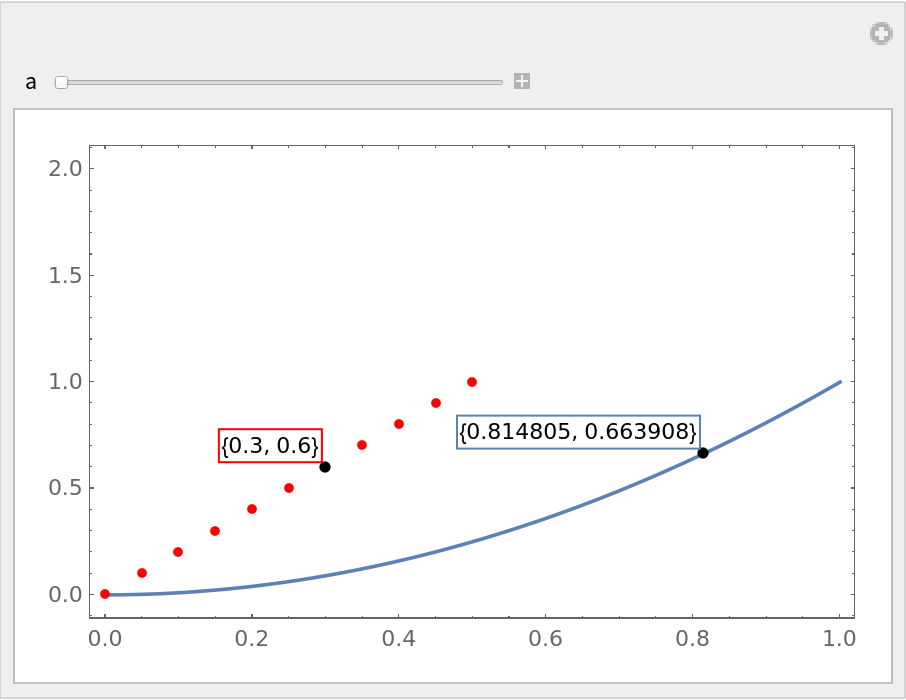
![Manipulate[
ResourceFunction["InteractiveGraphics"][Dynamic@plot[a], "LabelMoveMethod" -> Nearest],
{a, 1, 3}
]](https://www.wolframcloud.com/obj/resourcesystem/images/d07/d07cea43-45a0-4daf-9299-06167d0202f5/7ab43750ab05d17b.png)
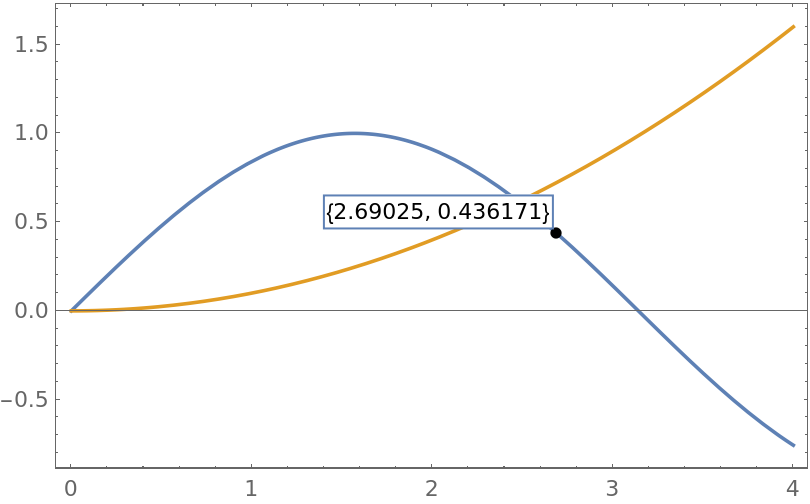
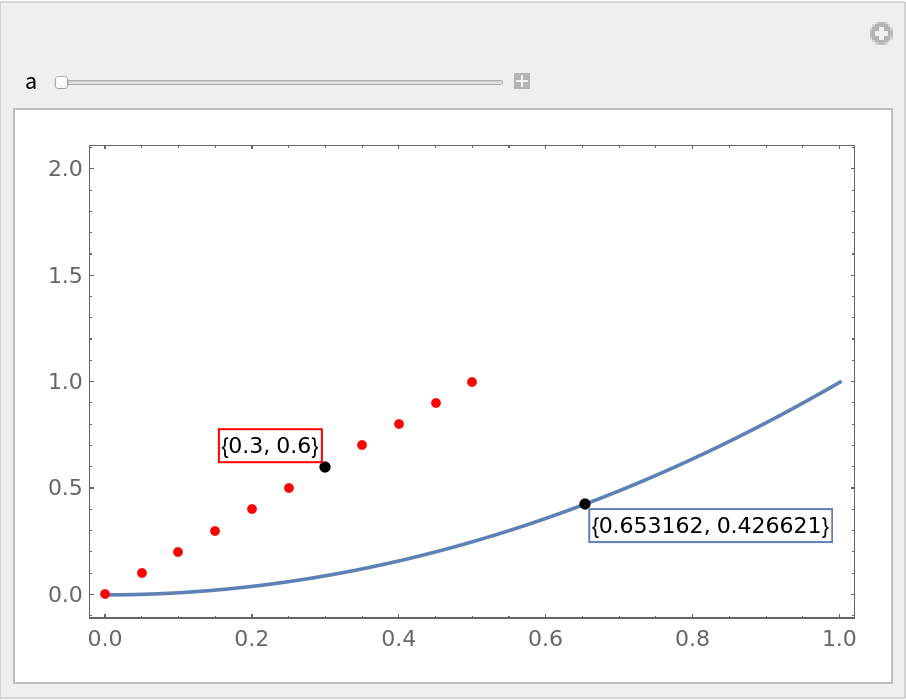
![Manipulate[
ResourceFunction["InteractiveGraphics"][Dynamic@plot[a], "LabelMoveMethod" -> "Horizontal"],
{a, 1, 3}
]](https://www.wolframcloud.com/obj/resourcesystem/images/d07/d07cea43-45a0-4daf-9299-06167d0202f5/273547d135cd16fc.png)
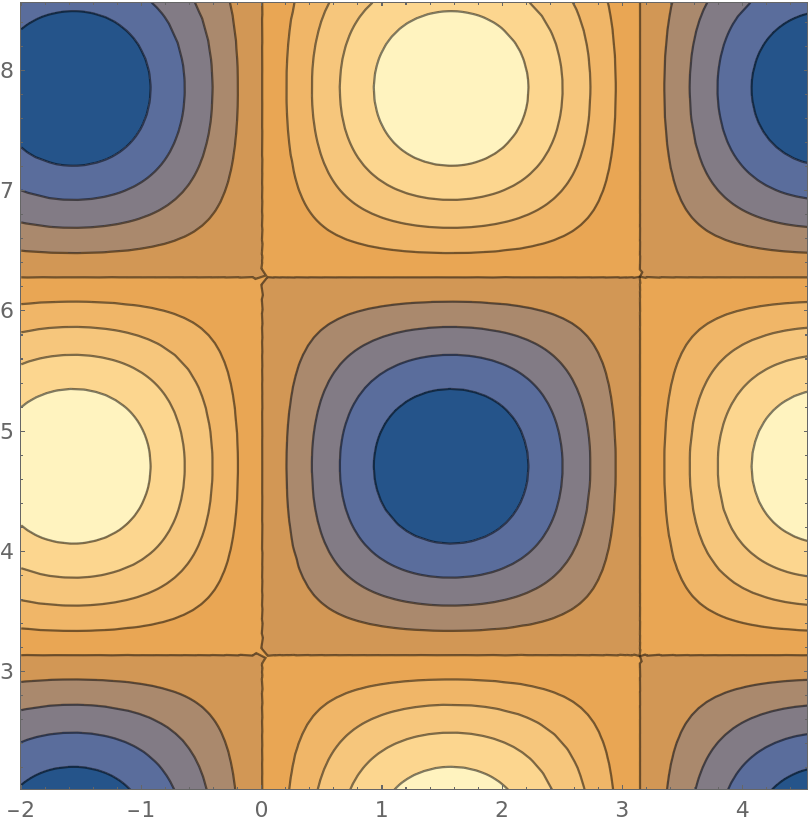
![ResourceFunction["InteractiveGraphics"][
Dynamic@ContourPlot[Sin[x] Sin[y], {x, 0, 2 \[Pi]}, {y, 0, 2 \[Pi]}]
]](https://www.wolframcloud.com/obj/resourcesystem/images/d07/d07cea43-45a0-4daf-9299-06167d0202f5/520f9bfe03d65340.png)
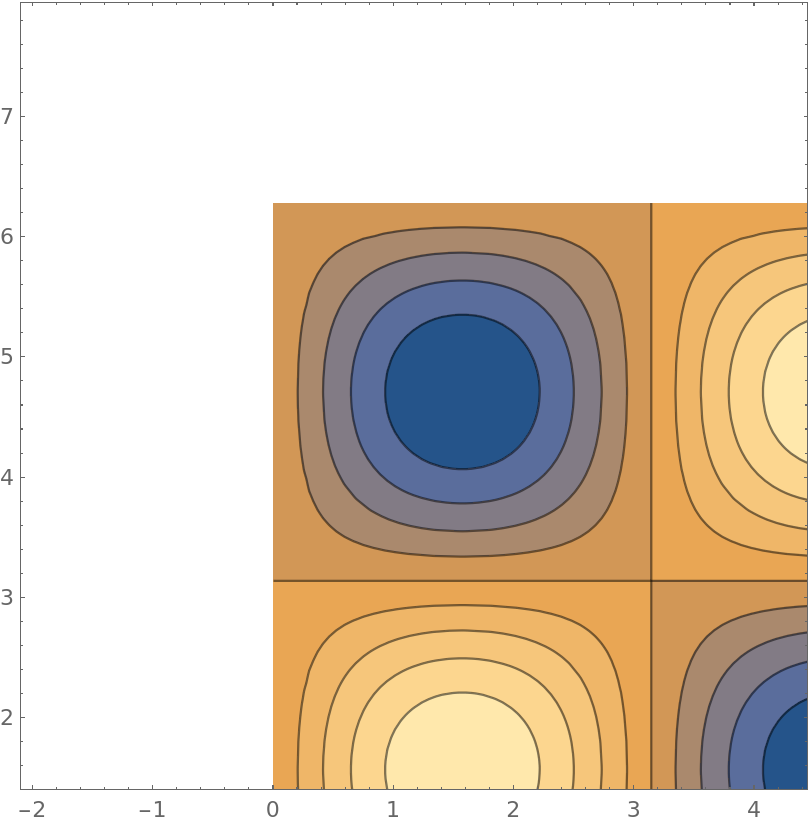
![ResourceFunction["InteractiveGraphics"][
Dynamic@ContourPlot[
Sin[x] Sin[y], {x, 0, 2 \[Pi]}, {y, 0, 2 \[Pi]}],
"ReplottingMethod" -> Automatic
]](https://www.wolframcloud.com/obj/resourcesystem/images/d07/d07cea43-45a0-4daf-9299-06167d0202f5/10e0f4e3666ec27e.png)
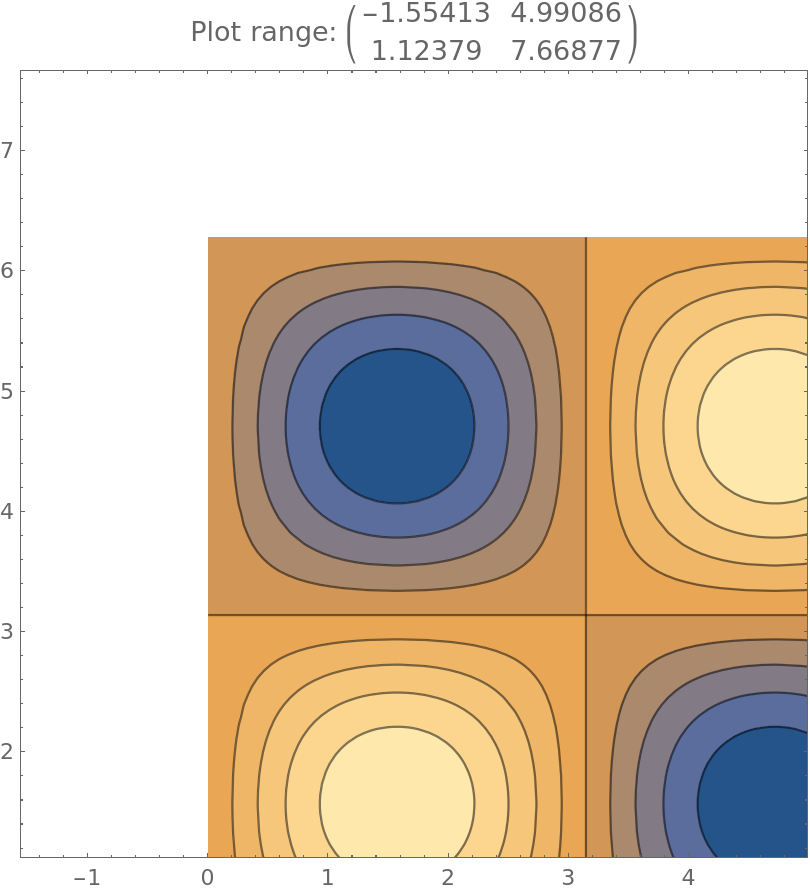
![ResourceFunction["InteractiveGraphics"][
Dynamic@ContourPlot[
Sin[x] Sin[y], {x, 0, 2 \[Pi]}, {y, 0, 2 \[Pi]}],
"ReplottingMethod" -> Function[{plot},
Show[plot, PlotLabel -> Row@{"Plot range: ", #}] &
]
]](https://www.wolframcloud.com/obj/resourcesystem/images/d07/d07cea43-45a0-4daf-9299-06167d0202f5/44cbb878fc6412d9.png)
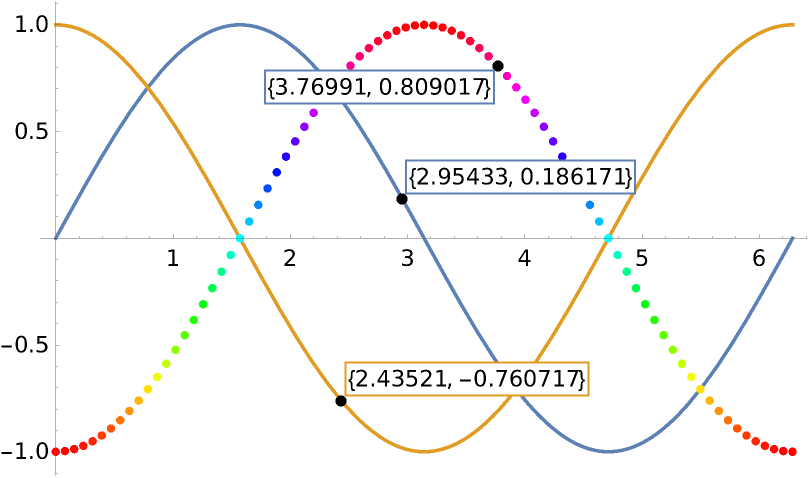
![ResourceFunction["InteractiveGraphics"][
Show[
Plot[{Sin[x], Cos[x]}, {x, 0, 2 \[Pi]}],
ListPlot[Table[{x, -Cos[x]}, {x, Subdivide[0, 2 \[Pi], 80]}], ColorFunction -> Hue]
]
]](https://www.wolframcloud.com/obj/resourcesystem/images/d07/d07cea43-45a0-4daf-9299-06167d0202f5/4773e50da0144173.png)
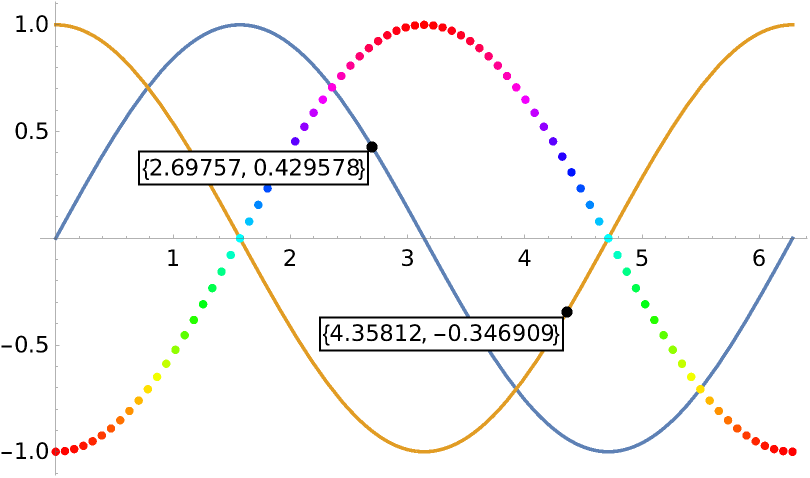
![ResourceFunction["InteractiveGraphics"][
Show[
Plot[{Sin[x], Cos[x]}, {x, 0, 2 \[Pi]}],
ListPlot[Table[{x, -Cos[x]}, {x, Subdivide[0, 2 \[Pi], 80]}], ColorFunction -> Hue]
],
"GroupingStrategy" -> All
]](https://www.wolframcloud.com/obj/resourcesystem/images/d07/d07cea43-45a0-4daf-9299-06167d0202f5/31b213dbfcdf0705.png)

![ResourceFunction["InteractiveGraphics"][
Plot[Sin[x], {x, 0, 2 \[Pi]}]
]
(* Add callout label *)
(* Right \
click\[ThinSpace]+\[ThinSpace]"Convert to Static Graphics" *)
(* Undo \
(\[ControlKey]/\[CommandKey]\[ThinSpace]+\[ThinSpace]Z) *)
(* Click \
on label *)
(* Errors appear in message window *)
(* Re-evaluate cell \
*)](https://www.wolframcloud.com/obj/resourcesystem/images/d07/d07cea43-45a0-4daf-9299-06167d0202f5/01f111ecf11fc31f.png)
![ResourceFunction["InteractiveGraphics"]["FixAfterUndo"]
ResourceFunction["InteractiveGraphics"][
Plot[Sin[x], {x, 0, 2 \[Pi]}]
]](https://www.wolframcloud.com/obj/resourcesystem/images/d07/d07cea43-45a0-4daf-9299-06167d0202f5/52ebe409d33577b5.png)
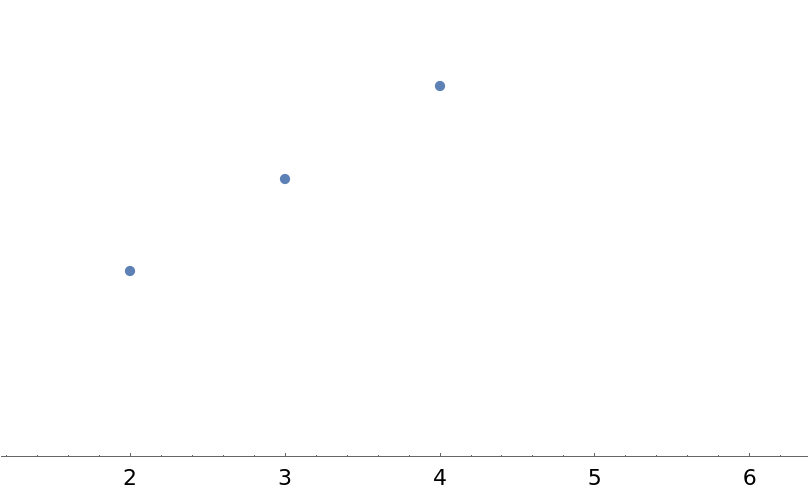
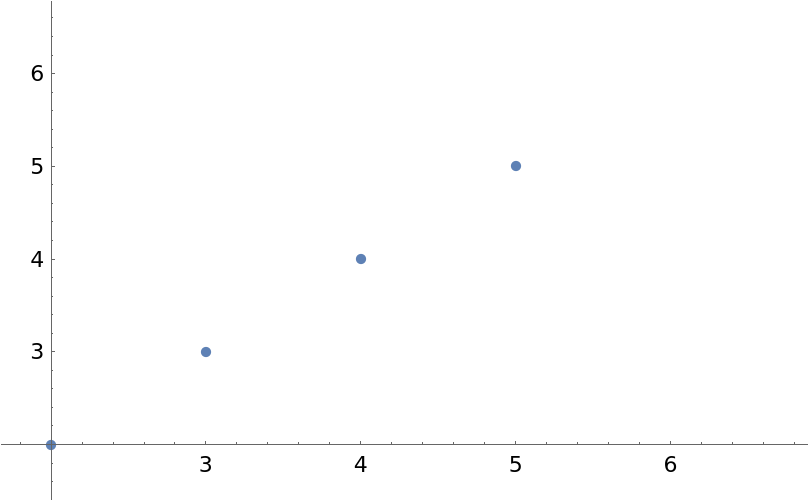
![ResourceFunction["InteractiveGraphics"][
ListPlot[Range[5]]
]](https://www.wolframcloud.com/obj/resourcesystem/images/d07/d07cea43-45a0-4daf-9299-06167d0202f5/15b37ffbe557a68d.png)
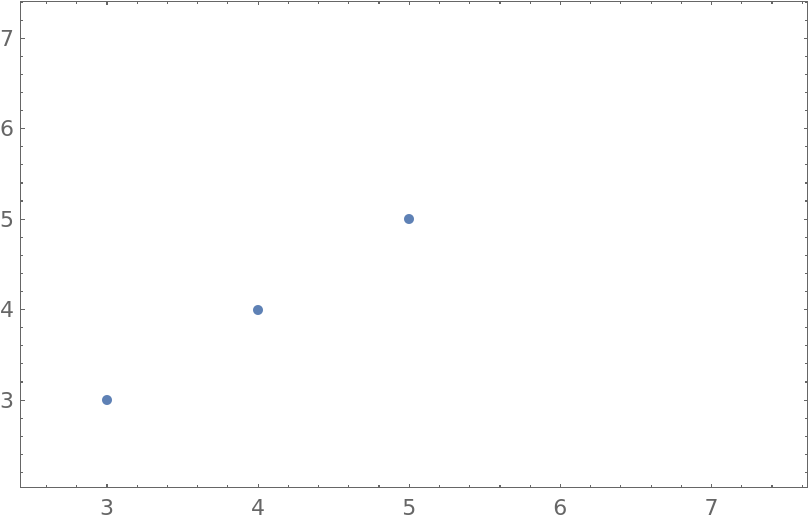
![ResourceFunction["InteractiveGraphics"][
Show[ListPlot[Range[5]], AxesOrigin -> Automatic]
]](https://www.wolframcloud.com/obj/resourcesystem/images/d07/d07cea43-45a0-4daf-9299-06167d0202f5/1eb58e4268097529.png)
![ResourceFunction["InteractiveGraphics"][
ListPlot[Range[5], Frame -> True]
]](https://www.wolframcloud.com/obj/resourcesystem/images/d07/d07cea43-45a0-4daf-9299-06167d0202f5/6d8a4532ae9bf831.png)
![ResourceFunction["InteractiveGraphics"][
Plot[Sin[x]^3, {x, 0, 2 \[Pi]}],
"ReplottingMethod" -> Automatic
]](https://www.wolframcloud.com/obj/resourcesystem/images/d07/d07cea43-45a0-4daf-9299-06167d0202f5/3d73903820937641.png)
![ResourceFunction["InteractiveGraphics"][
Dynamic@Plot[Sin[x]^3, {x, 0, 2 \[Pi]}],
"ReplottingMethod" -> Automatic
]](https://www.wolframcloud.com/obj/resourcesystem/images/d07/d07cea43-45a0-4daf-9299-06167d0202f5/49eae30a73cf9926.png)
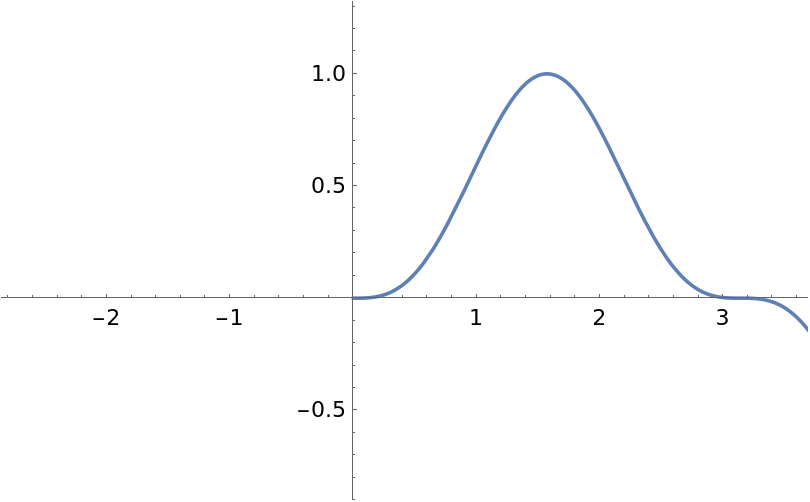
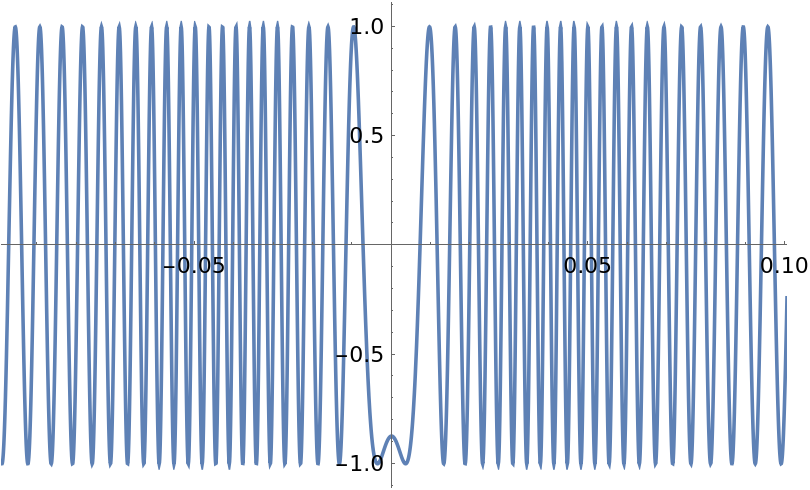
![ResourceFunction["InteractiveGraphics"][
Plot[Sin[1/(x^2 + 0.005)], {x, -2, 2}]
]](https://www.wolframcloud.com/obj/resourcesystem/images/d07/d07cea43-45a0-4daf-9299-06167d0202f5/61eaa25454a96151.png)
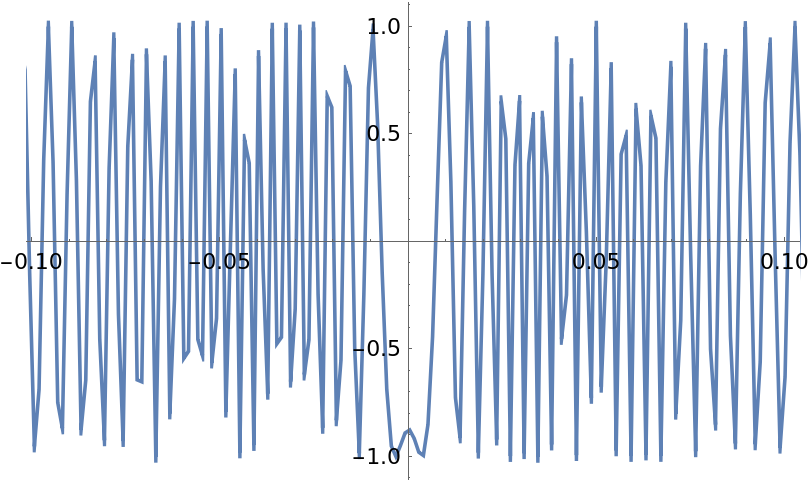
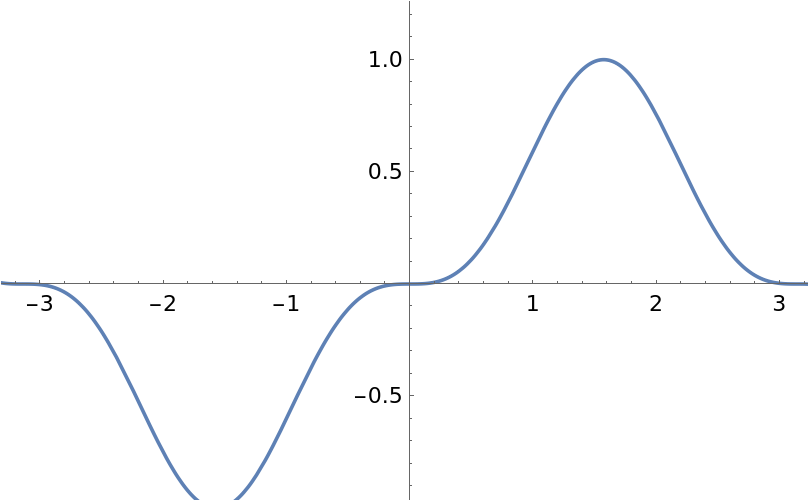
![ResourceFunction["InteractiveGraphics"][
Dynamic@Plot[Sin[1/(x^2 + 0.005)], {x, -2, 2}],
"ReplottingMethod" -> Automatic
]](https://www.wolframcloud.com/obj/resourcesystem/images/d07/d07cea43-45a0-4daf-9299-06167d0202f5/37e4620f891cab84.png)
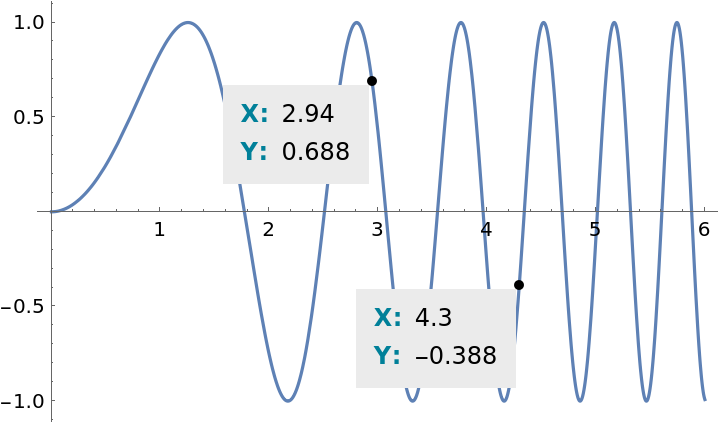
![ResourceFunction["InteractiveGraphics"][
Plot[Sin[x^2], {x, 0, 6}],
LabelStyle -> {Background -> GrayLevel@0.92, FrameStyle -> None, FrameMargins -> 8, Alignment -> {Center, Center}},
LabelingFunction -> (Grid[
{{"X:", NumberForm[#[[1]], 3]}, {"Y:", NumberForm[#[[2]], 3]}},
ItemStyle -> {{Directive[Bold, RGBColor[0, 0.5, 0.6]], Black}},
BaseStyle -> 12,
Alignment -> Left,
Spacings -> {0.5, 0.6}
] &)
]](https://www.wolframcloud.com/obj/resourcesystem/images/d07/d07cea43-45a0-4daf-9299-06167d0202f5/25f8b1df70074ddb.png)
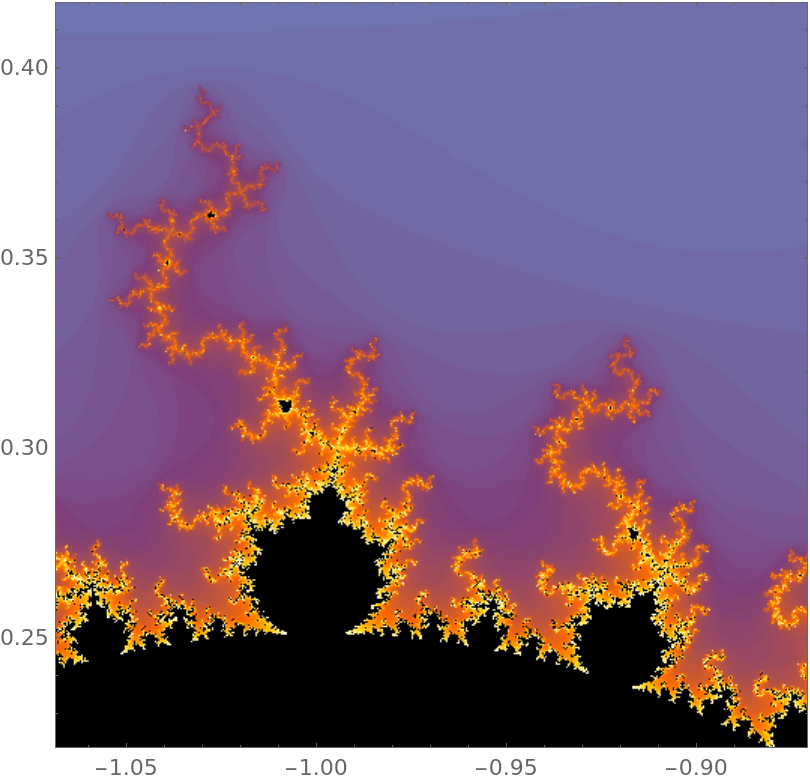
![ResourceFunction["InteractiveGraphics"][
Dynamic@MandelbrotSetPlot[],
"ReplottingMethod" -> Automatic
]](https://www.wolframcloud.com/obj/resourcesystem/images/d07/d07cea43-45a0-4daf-9299-06167d0202f5/7a2a3dc825e296c6.png)
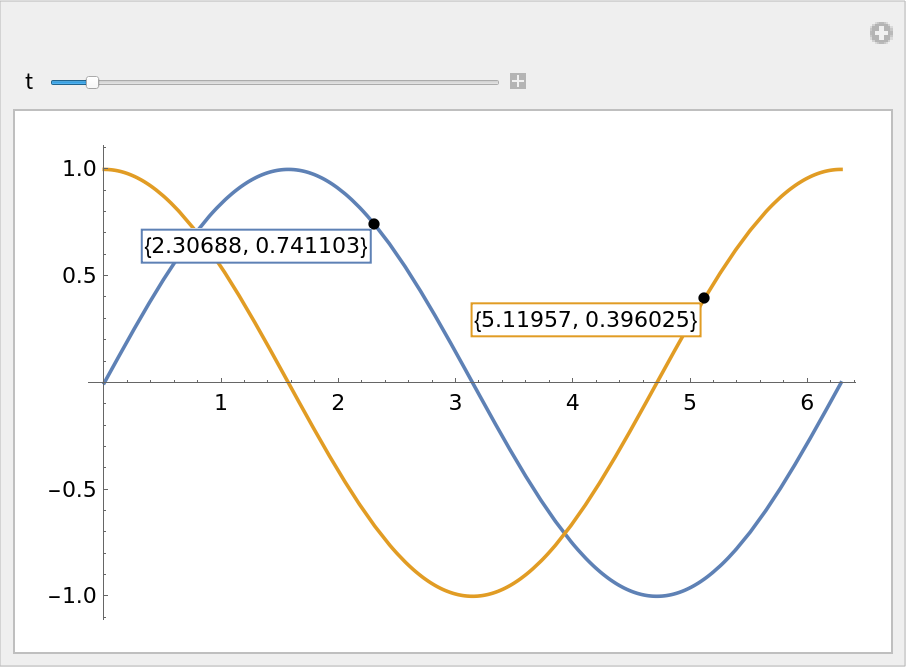
![Manipulate[
ResourceFunction["InteractiveGraphics"][
Dynamic@Plot[
{Sin[x + t], Cos[x - t]},
{x, 0, 2 \[Pi]}
]
],
{t, 0, 2 \[Pi]}
]](https://www.wolframcloud.com/obj/resourcesystem/images/d07/d07cea43-45a0-4daf-9299-06167d0202f5/62ee0702b6456895.png)