Wolfram Function Repository
Instant-use add-on functions for the Wolfram Language
Function Repository Resource:
A version of Plot which allows you to zoom into the plot using the mouse
ResourceFunction["DragZoomPlot"][f,{x,xmin,xmax}] generates a plot of f as a function of x from xmin to xmax that can be zoomed into using the mouse. | |
ResourceFunction["DragZoomPlot"][Dynamic[range],f,{x,xmin,xmax}] takes the setting to be the dynamically updated current value of range, with the value of range being reset if the plot is clicked. |
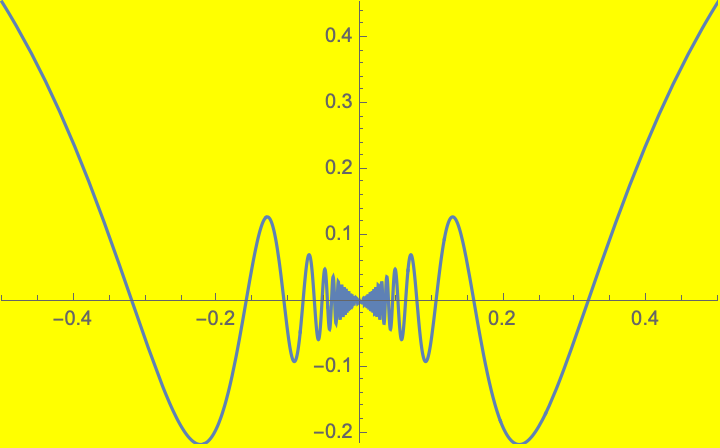
Click and drag to select regions of a plot that you wish to see enlarged. Single-click to reset the zoom area:
| In[1]:= |
| Out[1]= | 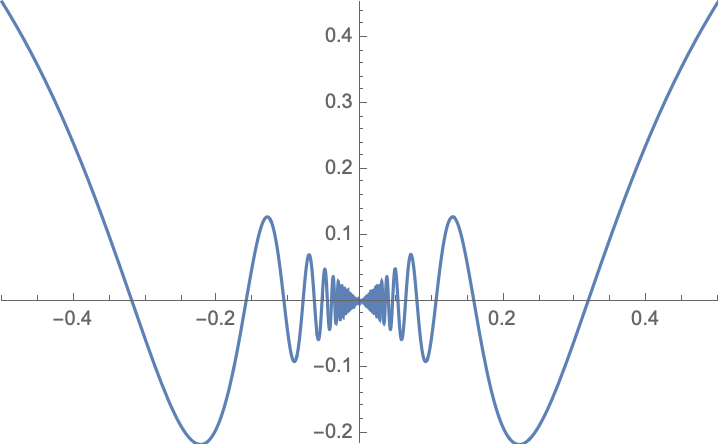 |
The selected range can dynamically update a variable and the plot updates if the variable changes value:
| In[2]:= | ![range = {{0, 4}, {0, 1}};
Column[{ResourceFunction["DragZoomPlot"][Dynamic[range], Sin[x], {x, 0, 6}, ImageSize -> 300], Dynamic[range]}]](https://www.wolframcloud.com/obj/resourcesystem/images/8e9/8e9f1f80-4282-44ba-a412-e34aba4915ed/5ddbd2cf07ce16b5.png) |
| Out[3]= | 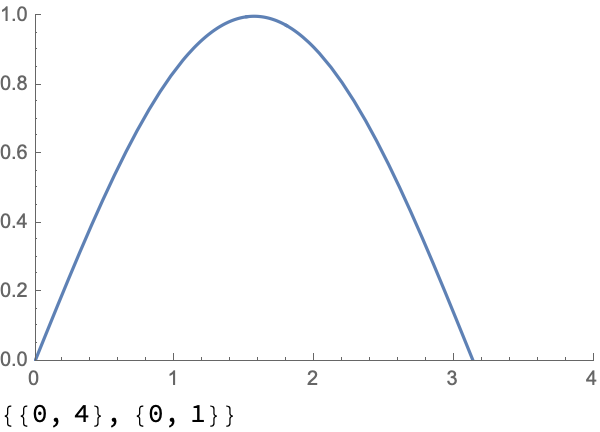 |
You cannot use the mouse to resize the result of DragZoomPlot, so it is is necessary to use ImageSize to control the size:
| In[5]:= |
| Out[5]= | 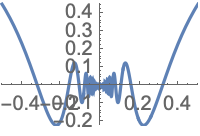 |
If you use DragZoomPlot within Dynamic or Manipulate, you should specify a range variable or the range will reset with each refresh:
| In[6]:= | ![DynamicModule[{range},
Manipulate[
ResourceFunction["DragZoomPlot"][Dynamic[range], Sin[f x], {x, 0, 6}, ImageSize -> 300], {f, 1, 5}]]](https://www.wolframcloud.com/obj/resourcesystem/images/8e9/8e9f1f80-4282-44ba-a412-e34aba4915ed/08beea33587099c2.png) |
| Out[6]= | 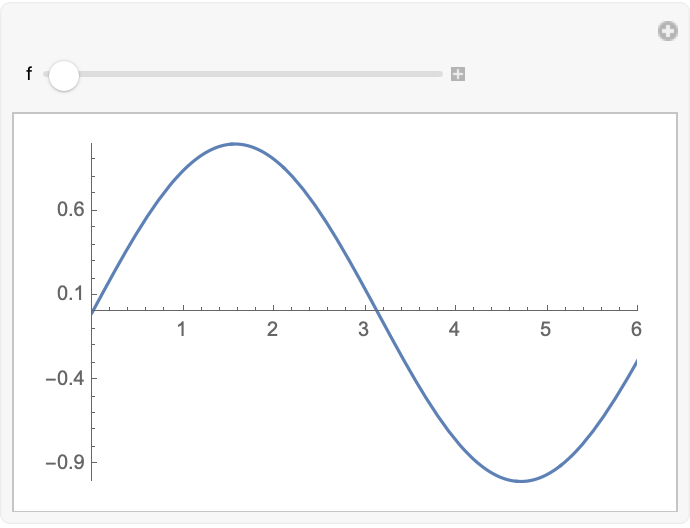 |
Wolfram Language 11.3 (March 2018) or above
This work is licensed under a Creative Commons Attribution 4.0 International License