Details and Options
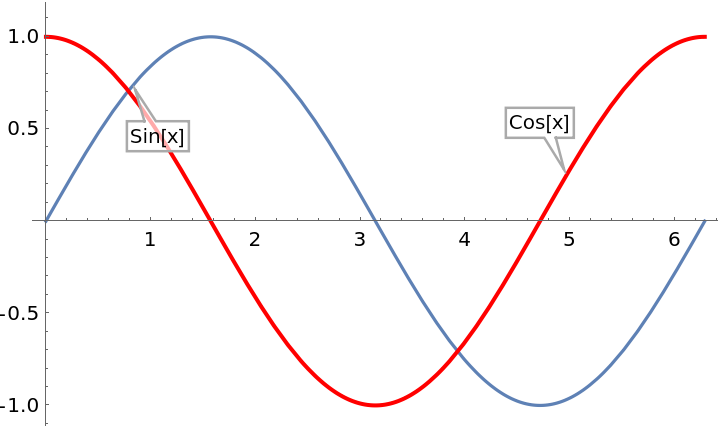
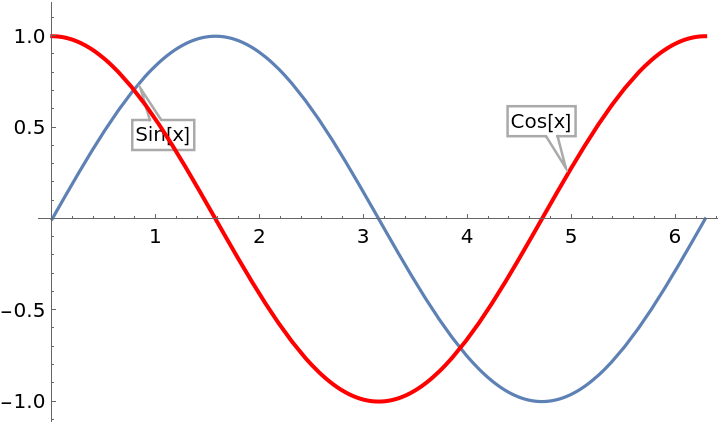
ResourceFunction["CombinePlots"] combines graphics expressions while trying to move labels and callouts to the front.
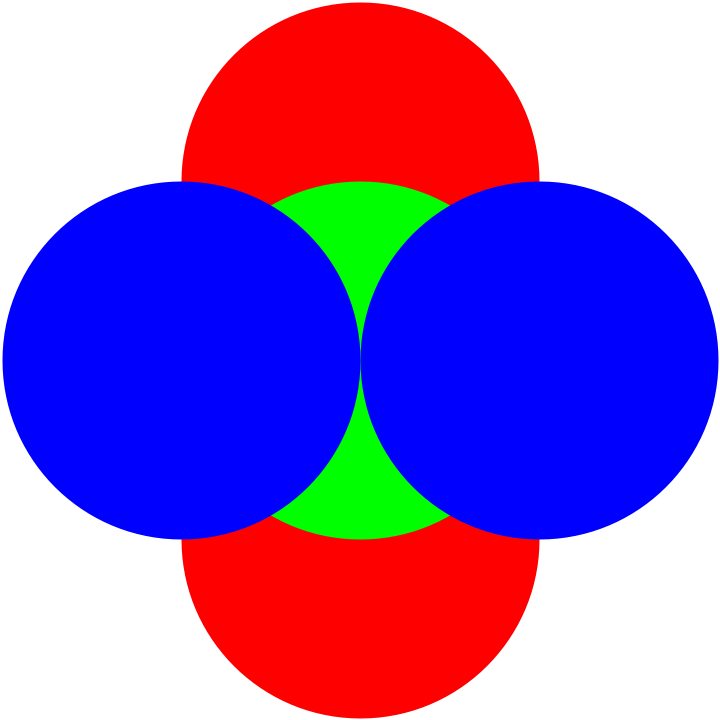
ResourceFunction["CombinePlots"] by default merges the primitives inside the
Prolog and
Epilog options.
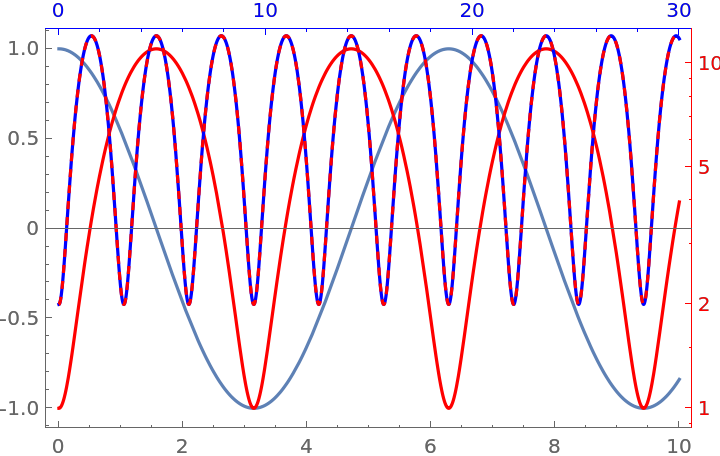
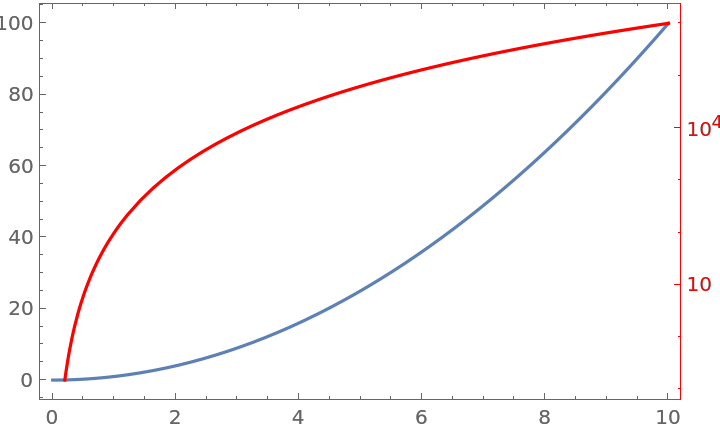
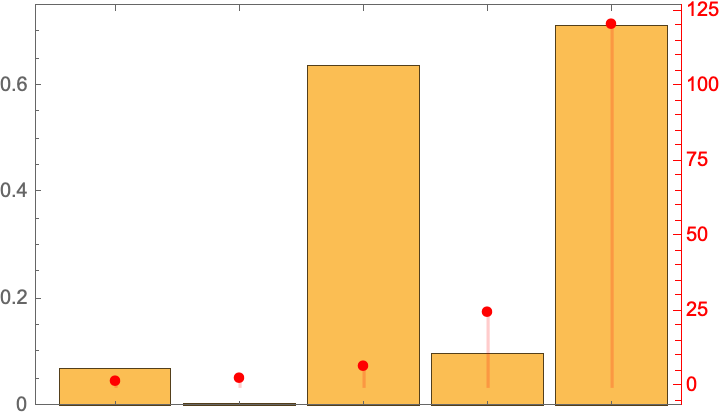
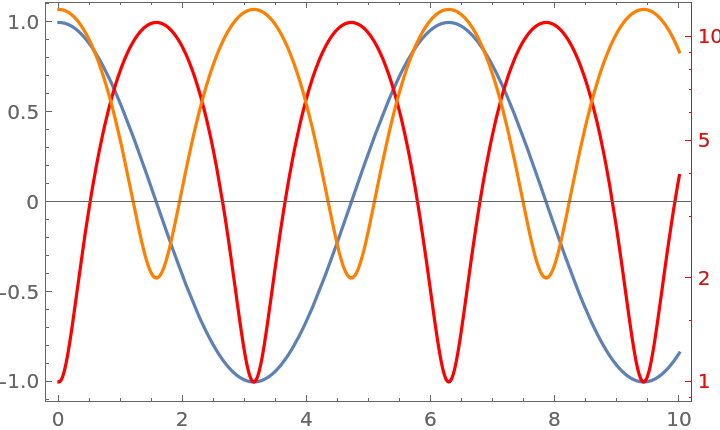
ResourceFunction["CombinePlots"] can reposition frame axes, allowing the creation of plots with two x/y axes.
ResourceFunction["CombinePlots"] accepts the following options:
| "CombineProlog" | True | whether to merge prologs |
| "CombineEpilog" | True | whether to merge epilogs |
| "AnnotationPattern" | (GraphicsGroup|Text)[___] | the pattern used to match annotations |
| "AxesSides" | Automatic | on which side to put the frame axes |
ResourceFunction["CombinePlots"] effectively removes all expressions matching the pattern specified by "AnnotationPattern" and inserts them on top of the remaining primitives.
The option "AxesSides" accepts the following settings:
| Automatic | do not move frame axes |
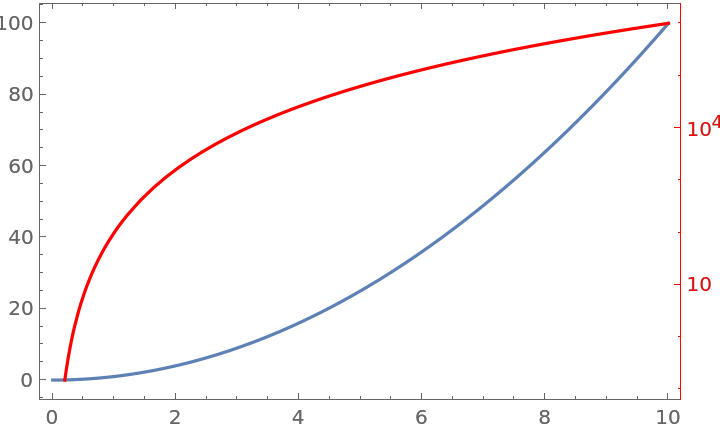
| "TwoY" | move the vertical frame axis of the second plot to the right |
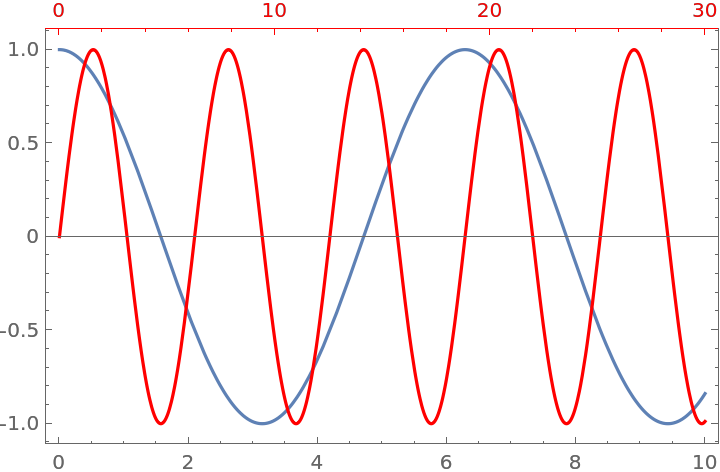
| "TwoX" | move the horizontal frame axis of the second plot to the top |
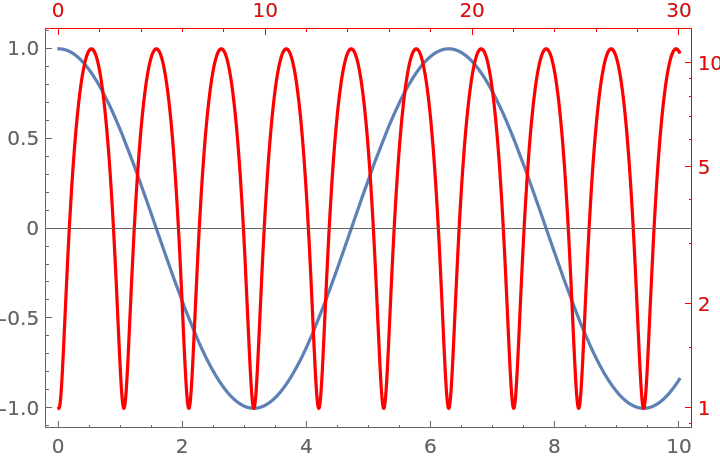
| "TwoXY" | move the bottom/left frame axes of the second plot to the top/right |
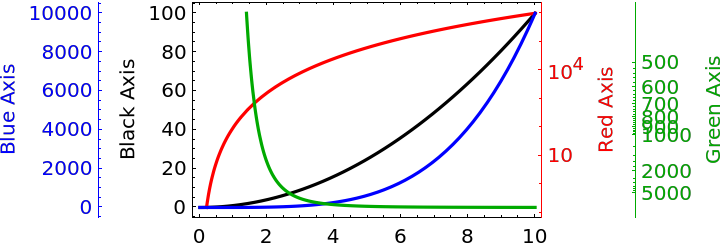
| "MultiY" | use a separate vertical frame axis for each plot alternatingly adding to the left/right side |
| "MultiX" | use a separate horizontal frame axis for each plot alternatingly adding to the bottom/top side |
| "MultiXY" | use a separate pair of vertical and horizontal frame axes for each plot |
| spec | use explicit settings for different plots |
"AxesSides" supports the same sequence specification as documented for
Spacings.
For each plot, the setting can be one of the following:
| Bottom | put horizontal frame axis to the bottom |
| Top | put horizontal frame axis to the top |
| Left | put vertical frame axis to the left |
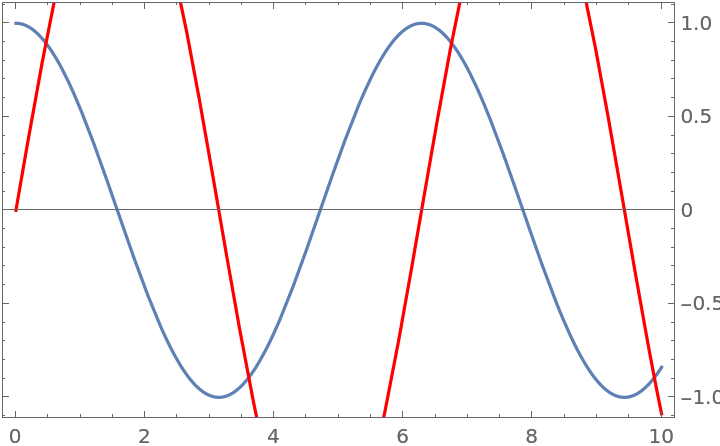
| Right | put vertical frame axis to the right |
| side→Automatic | put the frame axis onto a separate axis on the specified side |
| side→i | put the frame axis onto the axis with the specified index, counting from the inside |
| {sidex,sidey} | position both horizontal and vertical frame axes |
| Directive[sidex,sidey] | same as {sidex,sidey} |
The option "AxesSides" settings "TwoY"/"TwoX"/"TwoXY" are effectively equivalent to settings of the form {2→spec}.
The settings "MultiY"/"MultiX" are effectively equivalent to settings of the form
{{side1→Automatic,side2→Automatic}}, and "MutilXY" is a combination of the former two.
The sides for the frame axes of plots can also be specified by wrapping plots with
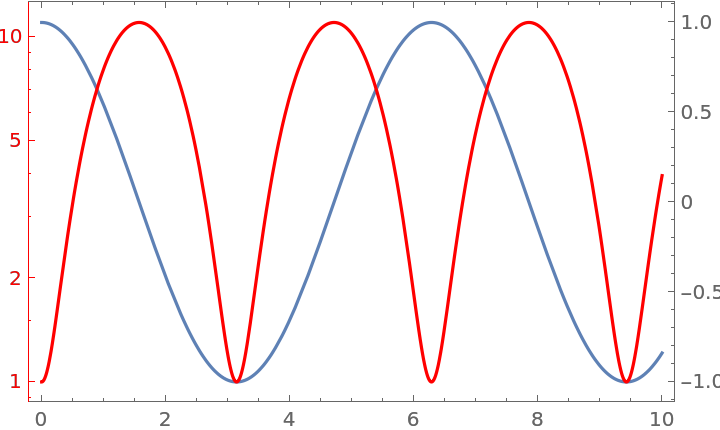
Axes[plot,sideSpec], similar to how
Item works for
Grid.
The arguments of
ResourceFunction["CombinePlots"] can be (nested) lists of plots, where each level can be wrapped in
Axes[plots,sideSpec]. Deeper specifications override outer ones as necessary.
The setting of "AxesSides" applies to each argument of
ResourceFunction["CombinePlots"] as one. Use
Axes[…] type specifications for more granular control.
ResourceFunction["CombinePlots"] will use the frame axis of the first appropriate plot for each side. The values of the
FrameLabel,
FrameTicks,
FrameStyle and
FrameTicksStyle options are used to create the frame axis in the resulting plot.
ResourceFunction["CombinePlots"] effectively uses
GeometricTransformation to rescale plot contents shown on secondary axes. Additional axes beyond the first axis per side are added using
Inset.
ResourceFunction["CombinePlots"] sets
CoordinatesToolOptions to enable extraction of coordinates from any of the axes. The format is
{{{sidex,ix},{sidey,iy}}→{x,y},…}, with one entry for each unique horizontal/vertical axis combination. The
ix,iy indicate the index of the axis on the respective side.
ResourceFunction["CombinePlots"] will always return a (possibly
Legended)
Graphics expression.
If there are no labels/callouts and no prolog/epilog to combine,
ResourceFunction["CombinePlots"][args] is equivalent to
Show[args].
![ResourceFunction["CombinePlots"][
Plot[
Callout[Sin[x], "Sin[x]", 0.8, Appearance -> "Balloon", Background -> White],
{x, 0, 2 \[Pi]}
],
Plot[
Callout[Cos[x], "Cos[x]", 5, Appearance -> "Balloon", Background -> White
],
{x, 0, 2 \[Pi]}, PlotStyle -> Directive[Thick, Red]
]
]](https://www.wolframcloud.com/obj/resourcesystem/images/a0a/a0a25df0-c0bb-4c05-ad71-4960b8ded9cd/0717267c3299e27c.png)
![Show[
Plot[
Callout[Sin[x], "Sin[x]", 0.8, Appearance -> "Balloon", Background -> White],
{x, 0, 2 \[Pi]}
],
Plot[
Callout[Cos[x], "Cos[x]", 5, Appearance -> "Balloon", Background -> White],
{x, 0, 2 \[Pi]}, PlotStyle -> Directive[Thick, Red]
]
]](https://www.wolframcloud.com/obj/resourcesystem/images/a0a/a0a25df0-c0bb-4c05-ad71-4960b8ded9cd/7eb3f5aa64a8ce53.png)
![ResourceFunction["CombinePlots"][
Graphics[
{Green, Disk[{0, 0}]},
Prolog -> {Red, Disk[{0, 1}]},
Epilog -> {Blue, Disk[{1, 0}]},
PlotRange -> 2
],
Graphics[
{},
Prolog -> {Red, Disk[{0, -1}]},
Epilog -> {Blue, Disk[{-1, 0}]}
]
]](https://www.wolframcloud.com/obj/resourcesystem/images/a0a/a0a25df0-c0bb-4c05-ad71-4960b8ded9cd/2126e888ecd0735d.png)
![Show[
Graphics[
{Green, Disk[{0, 0}]},
Prolog -> {Red, Disk[{0, 1}]},
Epilog -> {Blue, Disk[{1, 0}]},
PlotRange -> 2
],
Graphics[
{},
Prolog -> {Red, Disk[{0, -1}]},
Epilog -> {Blue, Disk[{-1, 0}]}
]
]](https://www.wolframcloud.com/obj/resourcesystem/images/a0a/a0a25df0-c0bb-4c05-ad71-4960b8ded9cd/4340e66eb207cdbc.png)
![ResourceFunction["CombinePlots"][
Plot[x^2, {x, 0, 10}, Frame -> True],
Plot[
100 x^4, {x, 0, 10},
ScalingFunctions -> "Log",
Frame -> True, FrameStyle -> Red, PlotStyle -> Red
],
"AxesSides" -> "TwoY"
]](https://www.wolframcloud.com/obj/resourcesystem/images/a0a/a0a25df0-c0bb-4c05-ad71-4960b8ded9cd/350742e401634dcd.png)
![ResourceFunction["CombinePlots"][
BarChart[RandomReal[{0, 1}, 5], Frame -> True],
DiscretePlot[
n!, {n, 1, 5},
PlotStyle -> Red, Frame -> True, FrameStyle -> Red, PlotMarkers -> Style["\[Bullet]", FontSize -> 20]
],
"AxesSides" -> "TwoY", Frame -> True
]](https://www.wolframcloud.com/obj/resourcesystem/images/a0a/a0a25df0-c0bb-4c05-ad71-4960b8ded9cd/7bcfc02b39def1af.png)
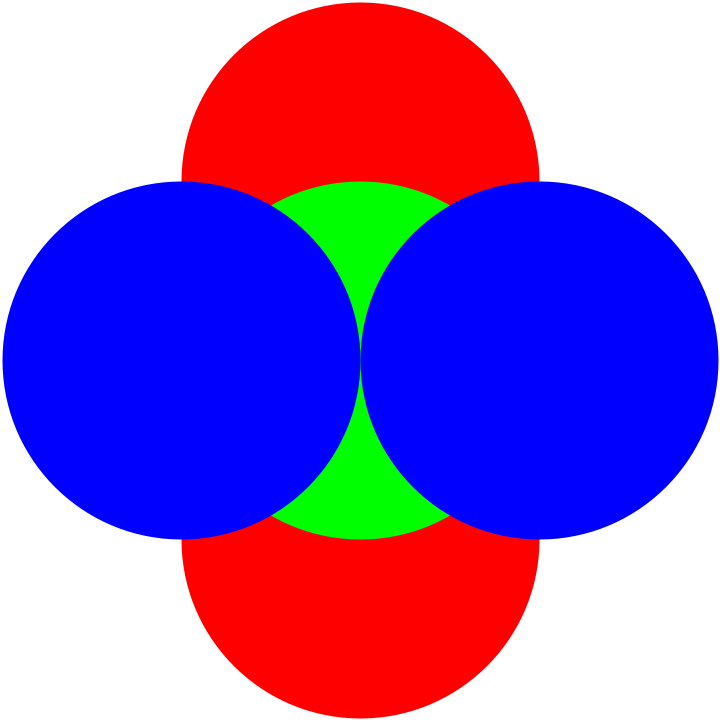
![ResourceFunction["CombinePlots"][
Graphics[
{Green, Disk[{0, 0}]},
Prolog -> {Red, Disk[{0, 1}]},
Epilog -> {Blue, Disk[{1, 0}]},
PlotRange -> 2
],
Graphics[
{},
Prolog -> {Red, Disk[{0, -1}]},
Epilog -> {Blue, Disk[{-1, 0}]}
]
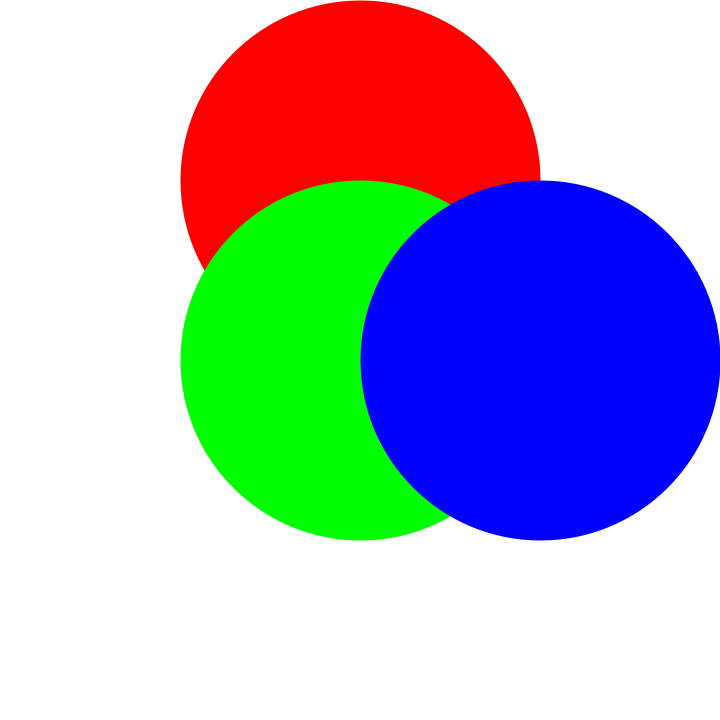
]](https://www.wolframcloud.com/obj/resourcesystem/images/a0a/a0a25df0-c0bb-4c05-ad71-4960b8ded9cd/22477c070f0e4eae.png)
![ResourceFunction["CombinePlots"][
Graphics[
{Green, Disk[{0, 0}]},
Prolog -> {Red, Disk[{0, 1}]},
Epilog -> {Blue, Disk[{1, 0}]},
PlotRange -> 2
],
Graphics[
{},
Prolog -> {Red, Disk[{0, -1}]},
Epilog -> {Blue, Disk[{-1, 0}]}
],
"CombineProlog" -> False
]](https://www.wolframcloud.com/obj/resourcesystem/images/a0a/a0a25df0-c0bb-4c05-ad71-4960b8ded9cd/2632caec4da05db0.png)
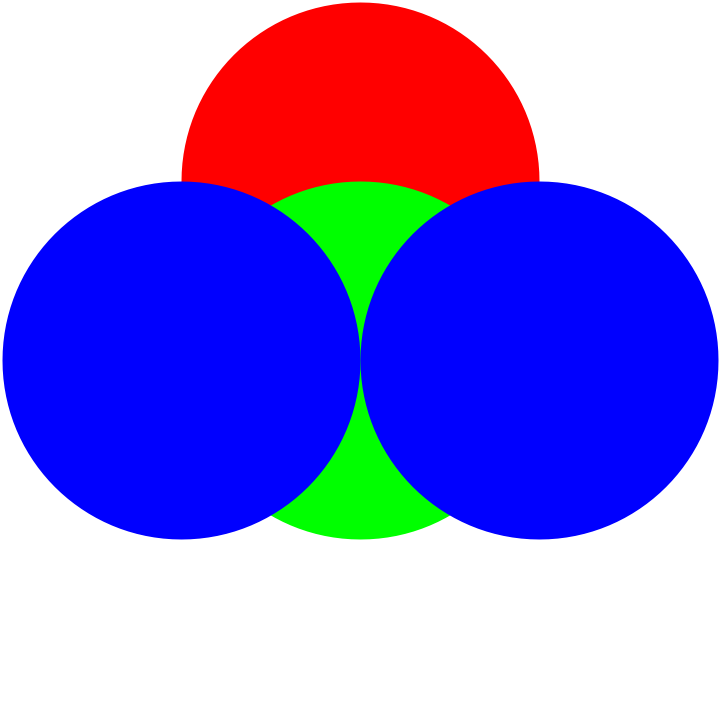
![ResourceFunction["CombinePlots"][
Graphics[
{Green, Disk[{0, 0}]},
Prolog -> {Red, Disk[{0, 1}]},
Epilog -> {Blue, Disk[{1, 0}]},
PlotRange -> 2
],
Graphics[
{},
Prolog -> {Red, Disk[{0, -1}]},
Epilog -> {Blue, Disk[{-1, 0}]}
]
]](https://www.wolframcloud.com/obj/resourcesystem/images/a0a/a0a25df0-c0bb-4c05-ad71-4960b8ded9cd/3cc0aad263ec4da9.png)
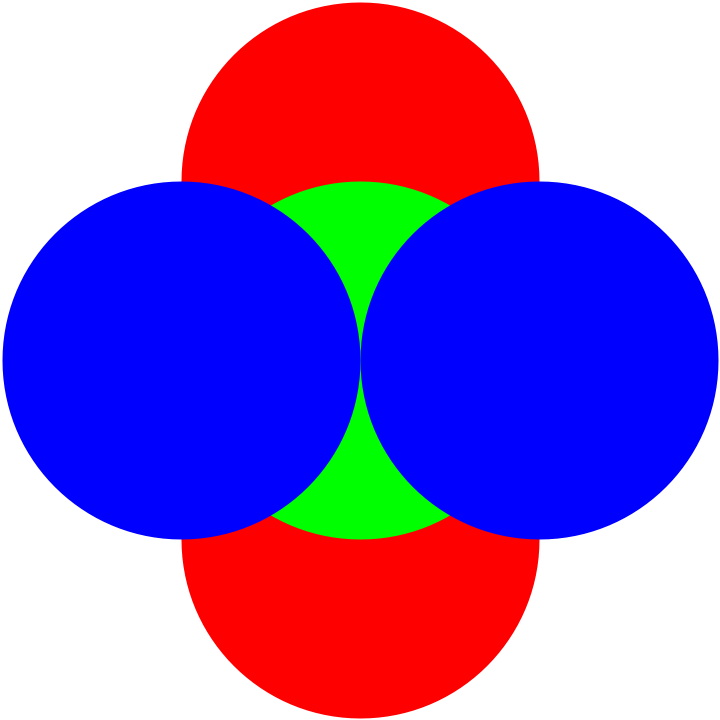
![ResourceFunction["CombinePlots"][
Graphics[
{Green, Disk[{0, 0}]},
Prolog -> {Red, Disk[{0, 1}]},
Epilog -> {Blue, Disk[{1, 0}]},
PlotRange -> 2
],
Graphics[
{},
Prolog -> {Red, Disk[{0, -1}]},
Epilog -> {Blue, Disk[{-1, 0}]}
],
"CombineEpilog" -> False
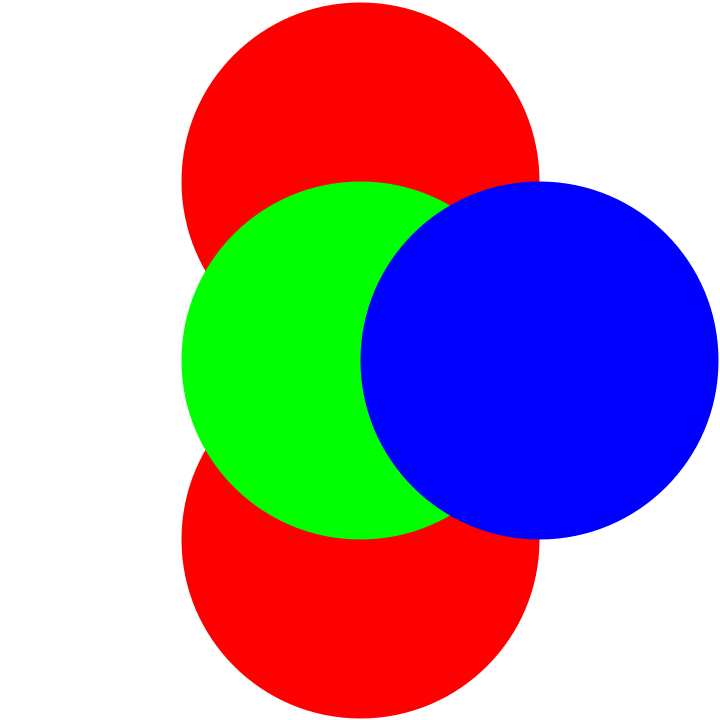
]](https://www.wolframcloud.com/obj/resourcesystem/images/a0a/a0a25df0-c0bb-4c05-ad71-4960b8ded9cd/4e5bc7b3be861f3b.png)
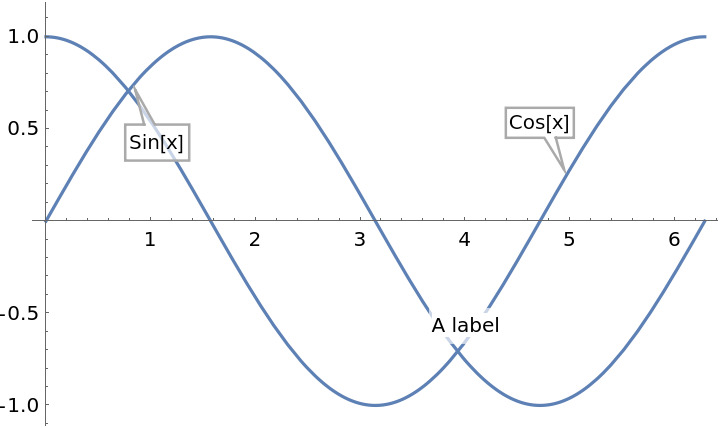
![ResourceFunction["CombinePlots"][
Plot[
Labeled[
Callout[Sin[x], "Sin[x]", 0.8, Appearance -> "Balloon", Background -> White],
Style["A label", Background -> White], 3.8
],
{x, 0, 2 \[Pi]}
],
Plot[
Callout[Cos[x], "Cos[x]", 5, Appearance -> "Balloon", Background -> White],
{x, 0, 2 \[Pi]}
]
]](https://www.wolframcloud.com/obj/resourcesystem/images/a0a/a0a25df0-c0bb-4c05-ad71-4960b8ded9cd/2c10298836d84b5c.png)
![ResourceFunction["CombinePlots"][
Plot[
Labeled[
Callout[Sin[x], "Sin[x]", 0.8, Appearance -> "Balloon", Background -> White],
Style["A label", Background -> White], 3.8
],
{x, 0, 2 \[Pi]}
],
Plot[
Callout[Cos[x], "Cos[x]", 5, Appearance -> "Balloon", Background -> White],
{x, 0, 2 \[Pi]}
],
"AnnotationPattern" -> _Text
]](https://www.wolframcloud.com/obj/resourcesystem/images/a0a/a0a25df0-c0bb-4c05-ad71-4960b8ded9cd/31f9556366f89299.png)
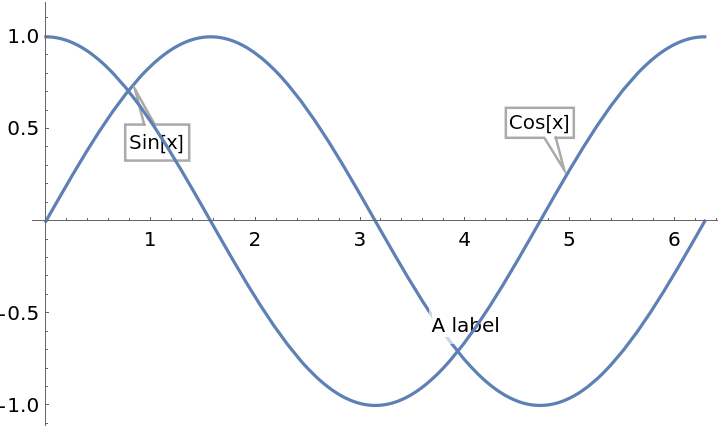
![ResourceFunction["CombinePlots"][
Plot[
Labeled[
Callout[Sin[x], "Sin[x]", 0.8, Appearance -> "Balloon", Background -> White],
Style["A label", Background -> White], 3.8
],
{x, 0, 2 \[Pi]}
],
Plot[
Callout[Cos[x], "Cos[x]", 5, Appearance -> "Balloon", Background -> White],
{x, 0, 2 \[Pi]}
],
"AnnotationPattern" -> _GraphicsGroup
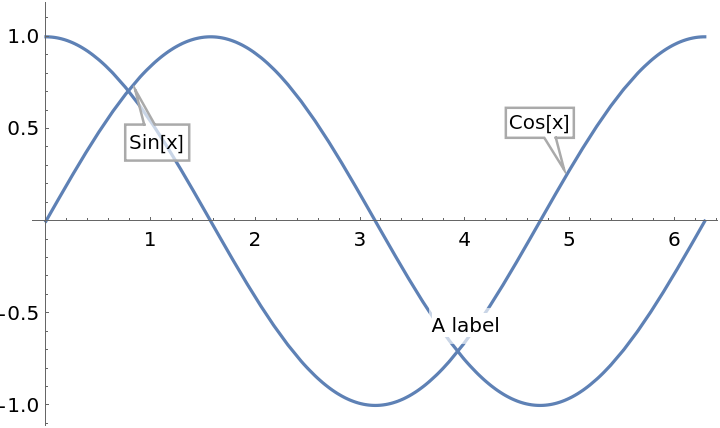
]](https://www.wolframcloud.com/obj/resourcesystem/images/a0a/a0a25df0-c0bb-4c05-ad71-4960b8ded9cd/43542a154acb6c8d.png)
![ResourceFunction["CombinePlots"][
Plot[x^2, {x, 0, 10}, Frame -> True],
Plot[
100 x^4, {x, 0, 10},
Frame -> True, FrameStyle -> Red, PlotStyle -> Red
]
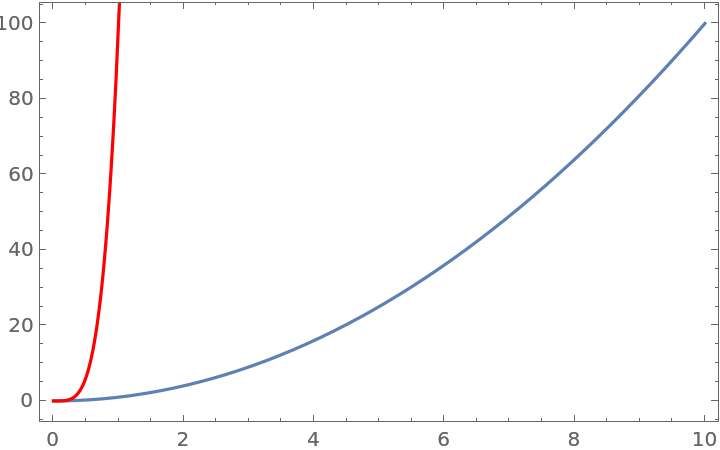
]](https://www.wolframcloud.com/obj/resourcesystem/images/a0a/a0a25df0-c0bb-4c05-ad71-4960b8ded9cd/60304480a7d4c857.png)
![ResourceFunction["CombinePlots"][
Plot[x^2, {x, 0, 10}, Frame -> True],
Plot[
100 x^4, {x, 0, 10},
Frame -> True, FrameStyle -> Red, PlotStyle -> Red
],
"AxesSides" -> "TwoY"
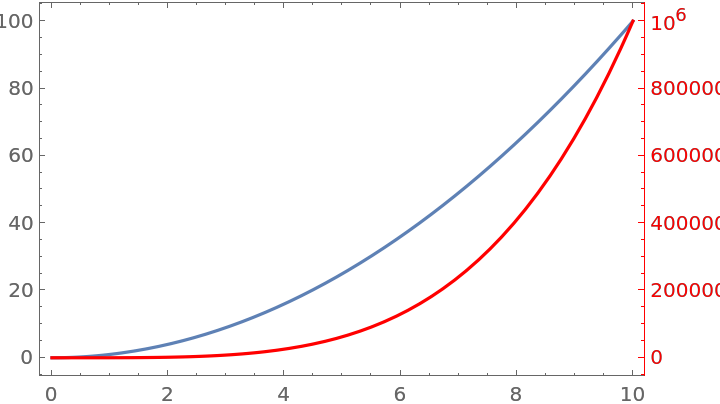
]](https://www.wolframcloud.com/obj/resourcesystem/images/a0a/a0a25df0-c0bb-4c05-ad71-4960b8ded9cd/6665705323a26241.png)
![ResourceFunction["CombinePlots"][
Plot[x^2, {x, 0, 10}, Frame -> True],
Plot[
100 x^4, {x, 0, 10},
ScalingFunctions -> "Log",
Frame -> True, FrameStyle -> Red, PlotStyle -> Red
],
"AxesSides" -> "TwoY"
]](https://www.wolframcloud.com/obj/resourcesystem/images/a0a/a0a25df0-c0bb-4c05-ad71-4960b8ded9cd/6e0d7508cb7c87ac.png)
![ResourceFunction["CombinePlots"][
Plot[Cos[x], {x, 0, 10}, Frame -> True],
Plot[
Sin[x], {x, 0, 30},
Frame -> True, FrameStyle -> Red, PlotStyle -> Red
],
"AxesSides" -> "TwoX"
]](https://www.wolframcloud.com/obj/resourcesystem/images/a0a/a0a25df0-c0bb-4c05-ad71-4960b8ded9cd/179ca96413386ac0.png)
![ResourceFunction["CombinePlots"][
Plot[Cos[x], {x, 0, 10}, Frame -> True],
Plot[
1 + 10 Sin[x]^2, {x, 0, 30},
ScalingFunctions -> "Log",
Frame -> True, FrameStyle -> Red, PlotStyle -> Red
],
"AxesSides" -> "TwoXY"
]](https://www.wolframcloud.com/obj/resourcesystem/images/a0a/a0a25df0-c0bb-4c05-ad71-4960b8ded9cd/112e397700d8ab21.png)
![ResourceFunction["CombinePlots"][
Plot[x^2, {x, 0, 10},
Frame -> True, FrameStyle -> Black, PlotStyle -> Black,
FrameLabel -> {None, "Black Axis"}],
Plot[
100 x^4, {x, 0, 10},
ScalingFunctions -> "Log",
Frame -> True, FrameStyle -> Red, PlotStyle -> Red,
FrameLabel -> {None, "Red Axis"}
],
Plot[
x^4, {x, 0, 10},
Frame -> True, FrameStyle -> Blue, PlotStyle -> Blue,
FrameLabel -> {None, "Blue Axis"}
],
Plot[
100 x^4, {x, 0, 10},
ScalingFunctions -> "Reciprocal",
Frame -> True, FrameStyle -> Darker@Green, PlotStyle -> Darker@Green,
FrameLabel -> {None, "Green Axis"}
],
"AxesSides" -> "MultiY"
]](https://www.wolframcloud.com/obj/resourcesystem/images/a0a/a0a25df0-c0bb-4c05-ad71-4960b8ded9cd/36acd49af6328bc9.png)
![ResourceFunction["CombinePlots"][
Plot[Cos[x], {x, 0, 10}, Frame -> True],
{
Plot[
1 + 10 Sin[x]^2, {x, 0, 10},
ScalingFunctions -> "Log",
Frame -> True, FrameStyle -> Red, PlotStyle -> Red
],
Plot[
2 + 10 Cos[x]^2, {x, 0, 10},
ScalingFunctions -> "Log",
PlotStyle -> Orange
]
},
"AxesSides" -> "TwoY"
]](https://www.wolframcloud.com/obj/resourcesystem/images/a0a/a0a25df0-c0bb-4c05-ad71-4960b8ded9cd/44b17a7e16efe134.png)
![ResourceFunction["CombinePlots"][
Plot[Cos[x], {x, 0, 10}, Frame -> True],
Plot[
2 Sin[x], {x, 0, 10},
Frame -> True, FrameStyle -> Red, PlotStyle -> Red
],
"AxesSides" -> Right
]](https://www.wolframcloud.com/obj/resourcesystem/images/a0a/a0a25df0-c0bb-4c05-ad71-4960b8ded9cd/750d92a0fa83af6a.png)
![ResourceFunction["CombinePlots"][
Axes[Plot[Cos[x], {x, 0, 10}, Frame -> True], Right],
Plot[
1 + 10 Sin[x]^2, {x, 0, 10},
ScalingFunctions -> "Log",
Frame -> True, FrameStyle -> Red, PlotStyle -> Red
]
]](https://www.wolframcloud.com/obj/resourcesystem/images/a0a/a0a25df0-c0bb-4c05-ad71-4960b8ded9cd/6671ecb94e31dad3.png)
![ResourceFunction["CombinePlots"][
Plot[Cos[x], {x, 0, 10}, Frame -> True],
Plot[
1 + 10 Sin[x]^2, {x, 0, 10},
ScalingFunctions -> "Log",
Frame -> True, FrameStyle -> Red, PlotStyle -> Red
],
Plot[
{2 + 10 Sin[x]^2, 2 + 10 Sin[x]^2}, {x, 0, 30},
ScalingFunctions -> "Log",
Frame -> True, FrameStyle -> Blue, PlotStyle -> {Blue, Directive[Red, Dashed]}
],
"AxesSides" -> {Automatic, Right, Directive[Right, Top]}
]](https://www.wolframcloud.com/obj/resourcesystem/images/a0a/a0a25df0-c0bb-4c05-ad71-4960b8ded9cd/3604fa5b50ba7559.png)
