Wolfram Function Repository
Instant-use add-on functions for the Wolfram Language
Function Repository Resource:
Dynamically magnify graphs with your mouse
ResourceFunction["GraphMouseMagnify"][graph] gives a view of graph that is dynamically magnified on mouseover. | |
ResourceFunction["GraphMouseMagnify"][graph,amount,radius] uses magnification factor amount applied over radius. |
Magnify a graph around your mouse pointer:
| In[1]:= |
| Out[1]= | 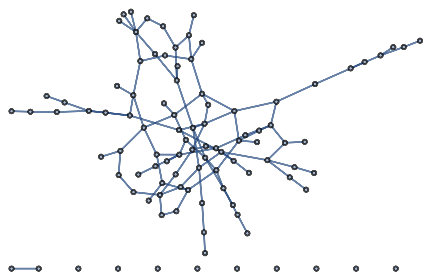 |
Zoom in on dense graphs and forests:
| In[2]:= |
| Out[2]= | 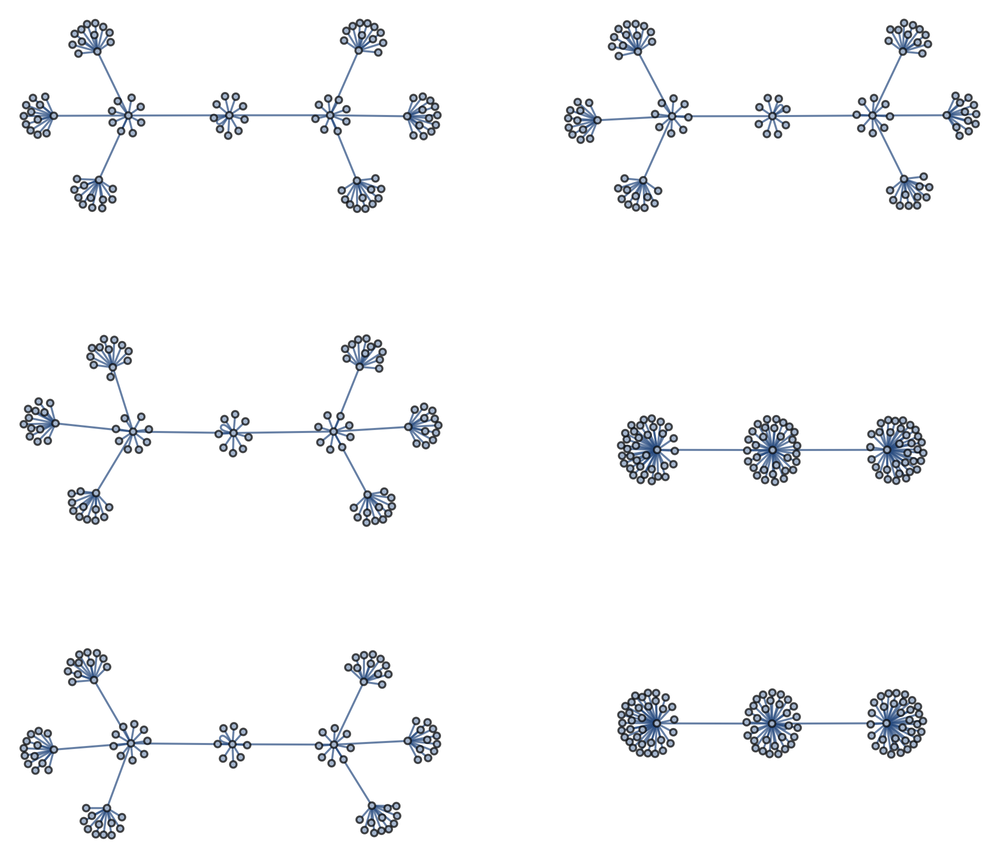 |
Visualize a dense graph of the files in your installation directory:
| In[3]:= | ![files = Flatten[
Rest[NestList[
Union[Flatten[
Thread[# -> FileNames["*", #]] & /@ Last /@ #]] &, {"" -> $InstallationDirectory}, 3]]];
g = Graph[files, GraphLayout -> "BalloonEmbedding", ImageSize -> 500];
ResourceFunction["GraphMouseMagnify"][g, 13, .3]](https://www.wolframcloud.com/obj/resourcesystem/images/a13/a13fe80c-8160-40f8-bb76-653aa60f78fc/289ae652370522d5.png) |
| Out[3]= | 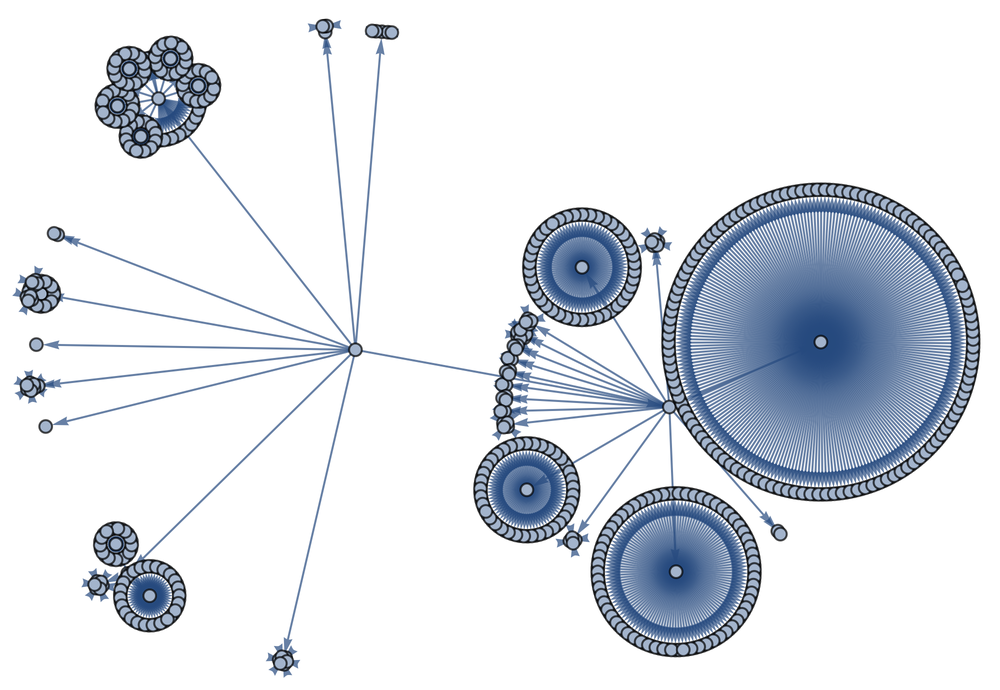 |
Change the parameters of zoom and radius:
| In[4]:= |
| In[5]:= | ![Manipulate[
ResourceFunction["GraphMouseMagnify"][graph, magnify, radius],
{graph, Map[# -> Thumbnail[#, 100] &, examples]}, {{magnify, 4}, 1, 10, Appearance -> "Labeled"}, {{radius, .5}, 0.1, 3, Appearance -> "Labeled"}
]](https://www.wolframcloud.com/obj/resourcesystem/images/a13/a13fe80c-8160-40f8-bb76-653aa60f78fc/11ce9f3da0f75434.png) |
| Out[5]= | 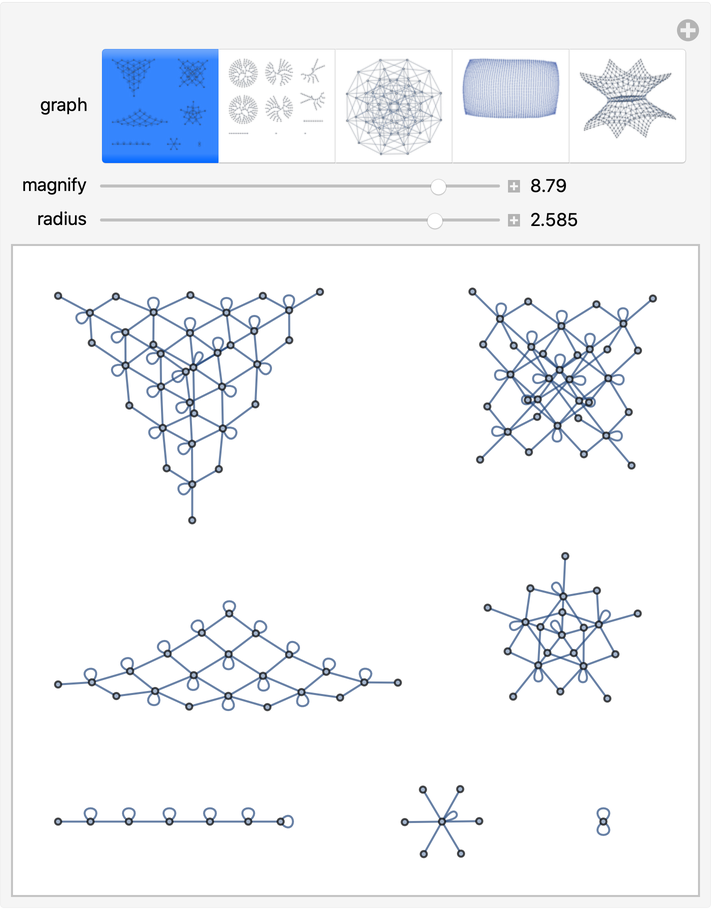 |
This work is licensed under a Creative Commons Attribution 4.0 International License