Wolfram Function Repository
Instant-use add-on functions for the Wolfram Language
Function Repository Resource:
Plot the values of a function at the vertices of a graph
ResourceFunction["GraphFunctionPlot"][g,a] plots the values of the Association a at the vertices of the graph g. | |
ResourceFunction["GraphFunctionPlot"][g,a,fun] uses the function fun to make the plot. |
| ColorFunction | Automatic | function to use for coloring the vertices |
| ColorFunctionScaling | True | whether to scale the argument to ColorFunction |
| PlotRange | Automatic | the range of values to include |
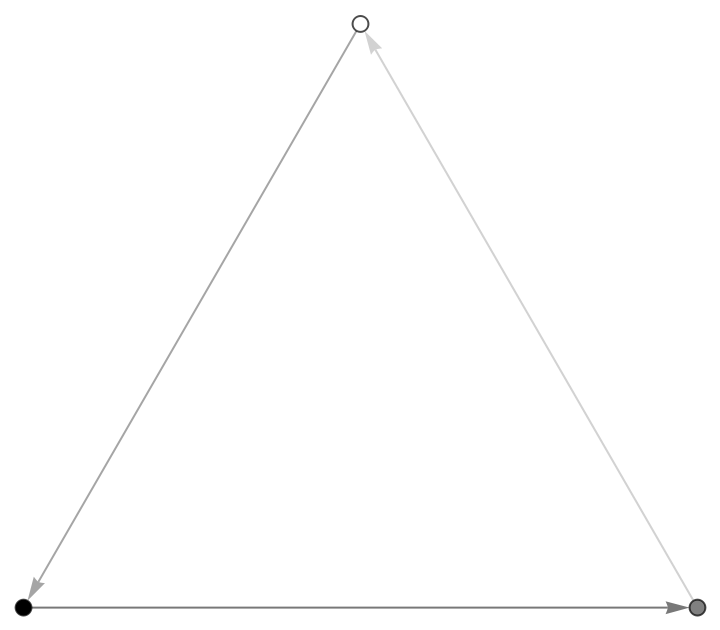
A graph colored by values:
| In[1]:= |
| Out[1]= | 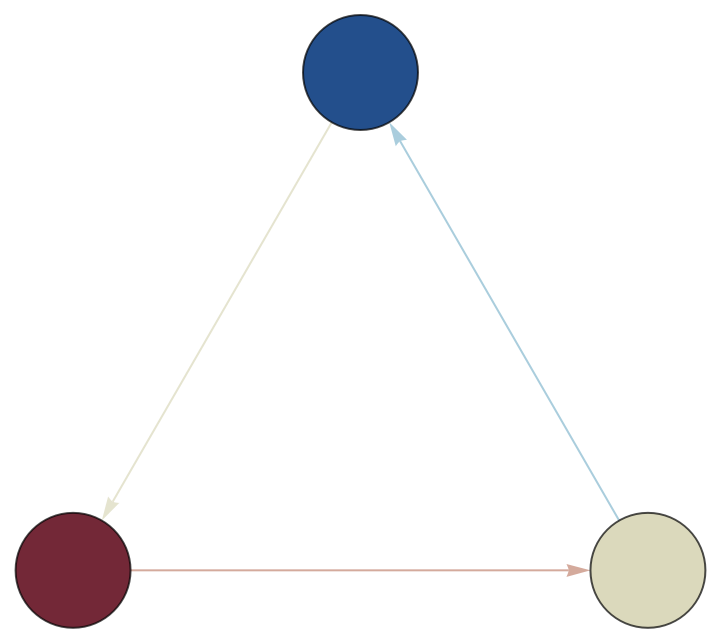 |
Visualize a path graph:
| In[2]:= |
| Out[2]= |
Use GraphPlot3D as the plotting function:
| In[3]:= |
| Out[3]= | 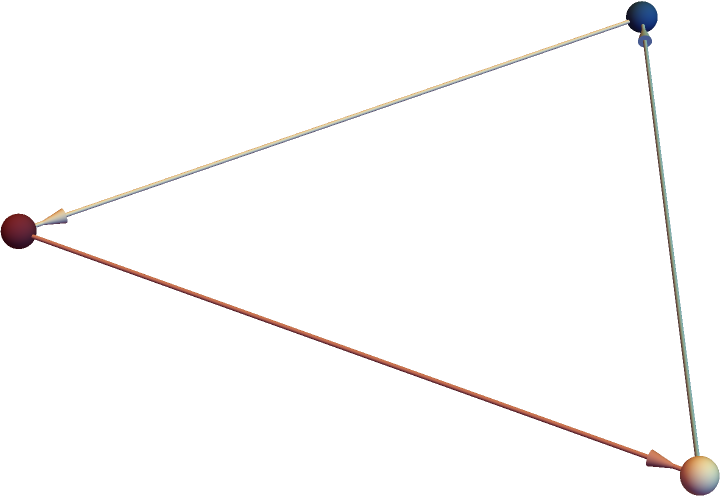 |
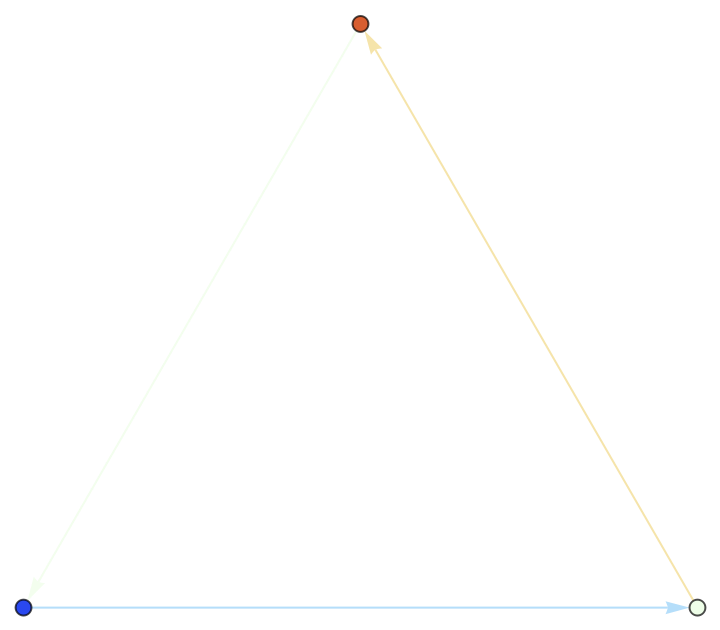
Color the graph with and without scaling:
| In[6]:= |
| Out[6]= | 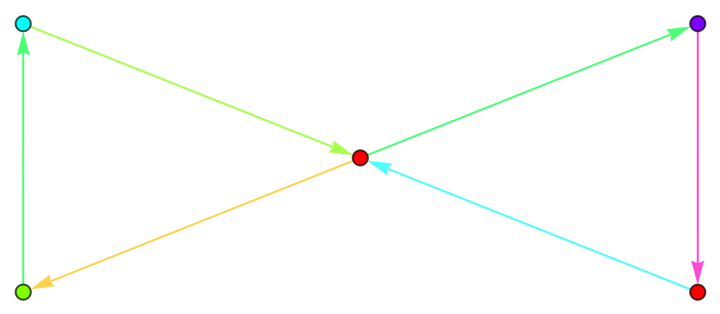 |
| In[7]:= |
| Out[7]= | 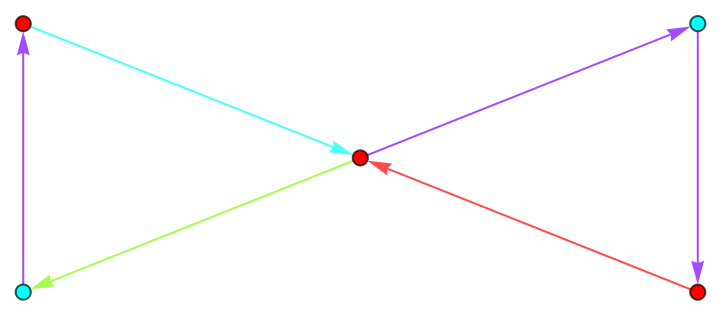 |
Use a different range:
| In[8]:= |
| Out[8]= | 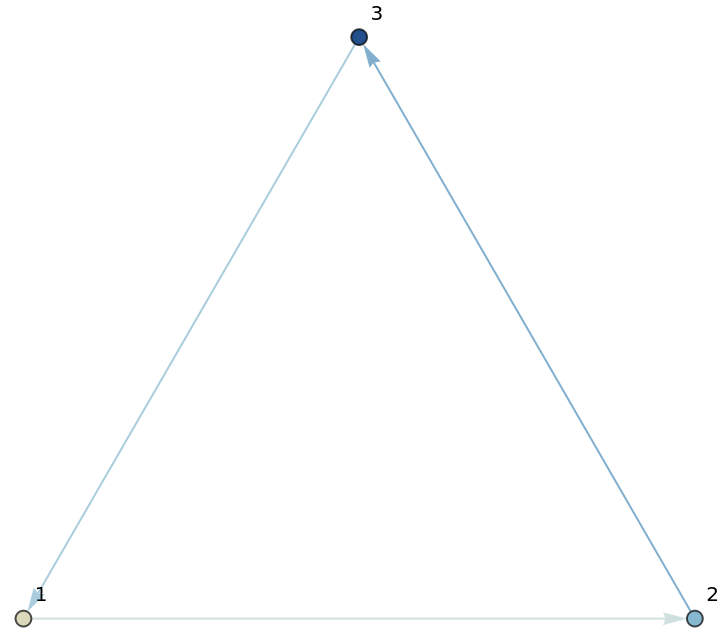 |
This work is licensed under a Creative Commons Attribution 4.0 International License