Wolfram Function Repository
Instant-use add-on functions for the Wolfram Language
Function Repository Resource:
Plot a given number of periods of a periodic function
ResourceFunction["FunctionPeriodPlot"][f,x] plots one period of a periodic function f of x. | |
ResourceFunction["FunctionPeriodPlot"][f,x,n] plots n periods of a periodic function f of x. |
| "PeriodAlignment" | Center | determine where to align the period relative to the starting point using the values Left,Right or Center |
| "StartingPoint" | 0 | where to start plotting period |
Plot a single period of a periodic function:
| In[1]:= |
| Out[1]= | 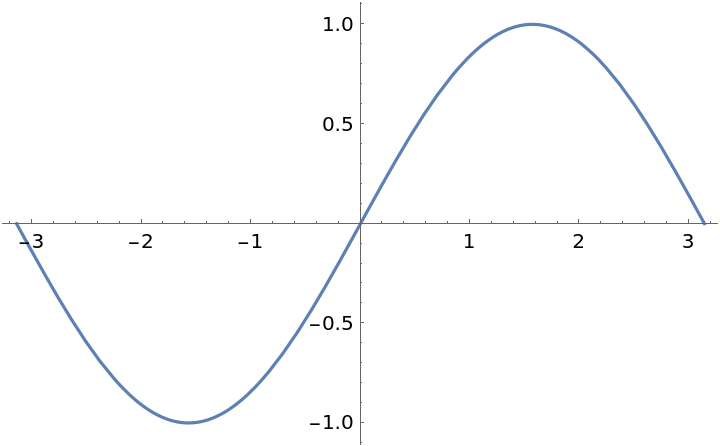 |
Plot two periods of a periodic function:
| In[2]:= |
| Out[2]= | 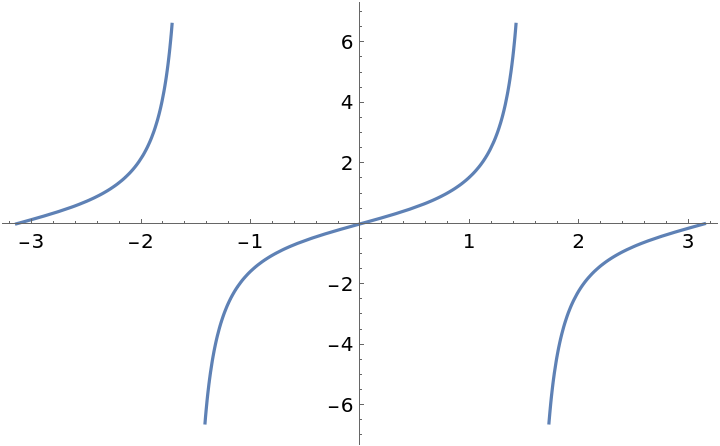 |
Use "StartingPoint" to determine the base point and "PeriodAlignment" to determine whether to plot the period(s) centered around that point, to the right of that point or to the left of that point:
| In[3]:= | ![Table[Labeled[
ResourceFunction["FunctionPeriodPlot"][Sin[x], x, 2, "StartingPoint" -> Pi/2, "PeriodAlignment" -> place], place], {place, {Center, Right, Left}}]](https://www.wolframcloud.com/obj/resourcesystem/images/948/9485e94c-ba73-4b14-9f43-baf636aeea01/1-0-0/44ef64abe5999180.png) |
| Out[3]= | 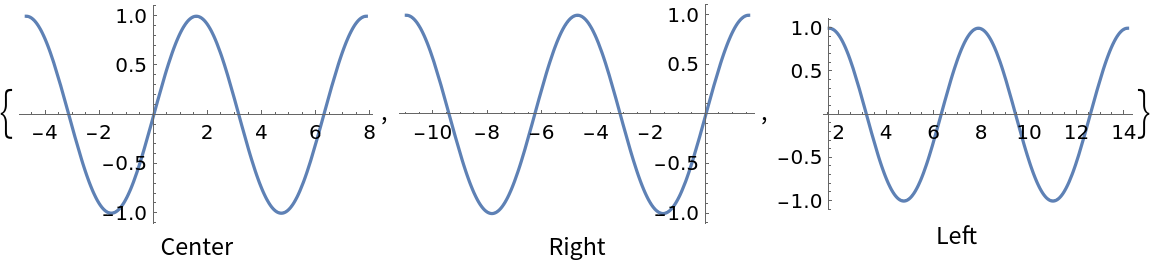 |
FunctionPeriodPlot returns unevaluated when the input expression is not periodic:
| In[4]:= |
| Out[4]= |
To view the full source code for FunctionPeriodPlot, evaluate the following:
| In[1]:= |
This work is licensed under a Creative Commons Attribution 4.0 International License