Wolfram Function Repository
Instant-use add-on functions for the Wolfram Language
Function Repository Resource:
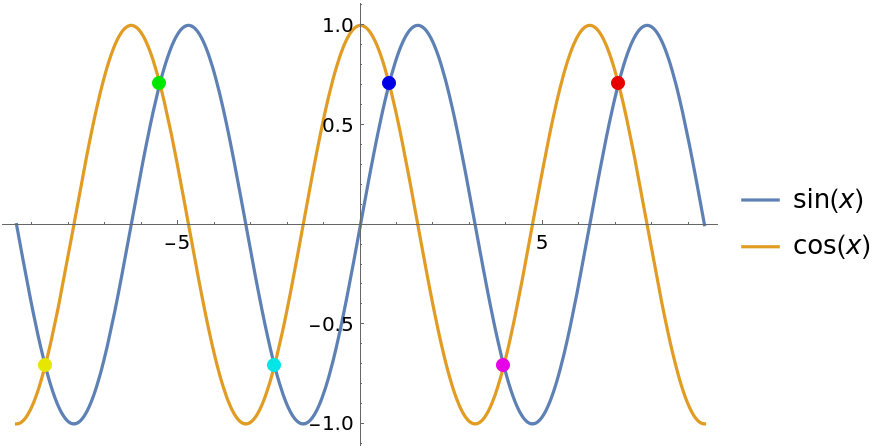
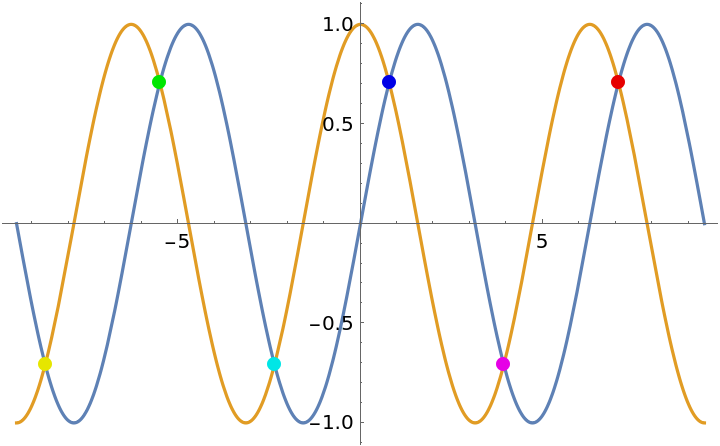
Plot two curves and highlight their points of intersection
ResourceFunction["IntersectionPlot"][{curve1,curve2},{x,lo,hi}] returns a plot of curve1 and curve2 on the domain lo<x<hi and highlights their intersections. |
For curves that intersect infinitely many times, a subset of the points of intersection will be selected:
| In[3]:= |
| Out[3]= | 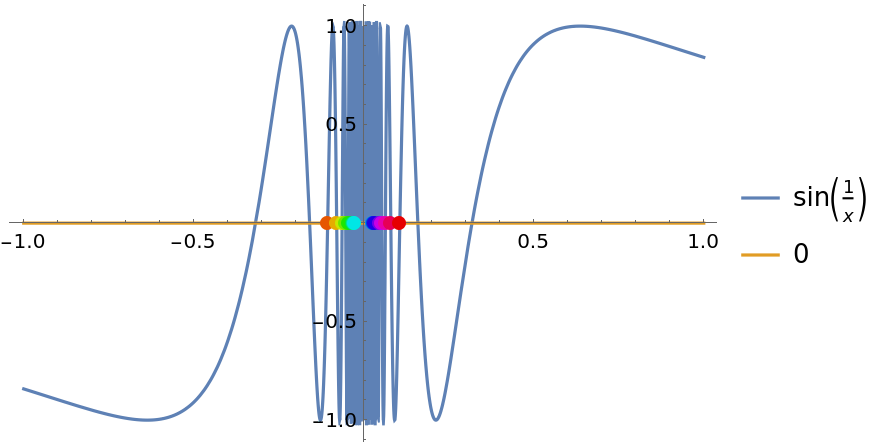 |
This work is licensed under a Creative Commons Attribution 4.0 International License