Wolfram Function Repository
Instant-use add-on functions for the Wolfram Language
Function Repository Resource:
Extract data from a plot image
ResourceFunction["ExtractPlotImageData"][img] converts the plot image img to a normalized set of points. | |
ResourceFunction["ExtractPlotImageData"][img,{xscale,yscale}] scales the results by xscale and yscale. |
Extract data from a plot image:
| In[1]:= | ![Short@ResourceFunction["ExtractPlotImageData"][\!\(\*
GraphicsBox[
TagBox[RasterBox[CompressedData["
1:eJzt3dlXVPfe5/HT3Td92f9C/xfPbV/27dOrbx9CxCnGaIzGGE0emRFBRFFB
RdTgiLNCVQHFTDFbzIPFDMVQVFEUNQ97ny4P52wKNJNs+3f4nfdr7ZVFjMv1
MVeftffv9/3+zy+P/Pu+//qXv/zlu/8e/8e/J5/8X8eOJZ/6P/8j/i//95vv
Du7/Zm/K//7m+N79e4/925f/Lf6Ltf/lL3/pjf/+9z//FQAAAAAAAAAAAAAA
AAAAAAAAAAAAAAAAAAAAAAAAAAAAAAAAAAAAAAAAAAAAAAAAAAAAAAAAAAAA
AAAAAAAAAAAAAAAA4K9/dXkCGWWWhRWv6CAAAEBOgVD0dHHTf6RWHjhnGply
io4DAABkoyjq+fKOeNnYeF40vhOdCAAAyKbsdb9WNkqe94qOAwAAZPOmZVwr
G1m326IxRXQiAAAglY6hBa1snLzS4AtGRCcCAABSeTe7uifDsFE2Dp2vcbj9
ohMBAACpLDp9B3OrN8pGSqZhfN4tOhEAAJDKuj98/FL9RtlISq3sHlkUnQgA
AEglHI2llrZqxzaM7ZOiEwEAAKkoqnrpcY9WNsoNQ6ITAQAA2dwzDmll4+LD
7nj9EJ0IAABIxdQ+pZWNszdbwpGY6EQAAEAq3SOLSf8oG8cv1Xt8IdGJAACA
VGxzq3sy/z5q42Bu9aLTJzoRAACQypLL99U/Rm3syTC8m10VnQgAAEhl26iN
zqEF0YkAAIBUwpHY2Zst2hlRQxujNgAAgJ4URS140MWoDQAA8PmUve7Xysal
xz2M2gAAAPp60WjTykb6LUs4yqgNAACgpybrnFY2Tl5p8AbCohMBAACp9Nkc
X6RVbZSNb/JrV9wB0YkAAIBUJu3ulCzjRtnYl22aWfSITgQAAKSy5PIdOl+z
UTaS06uGJldEJwIAAFLx+ELaXK/4Yxmwi04EAACkEgpHz97YnOtVZZkQnQgA
AEglpij59zuZ6wUAAD6fmy/7tLJxuaJHZa4XAADQ1dP6Ma1sZN5uizDXCwAA
6Kq+Z0YrG6euNvqCEdGJAACAVN6OLiWl/b1sHLlgdnmY6wUAAPRkm1tNyTRs
lI0DOaa55XXRiQAAgFQWnd6vcqs3ysaXGYaRaZfoRAAAQCru9eCxi3UbZSMp
tbJjaEF0IgAAIBVfMPLjtSbtjKipfUp0IgAAIJVwNJZRZtHKxqPaEdGJAACA
VBRFLXjYpZWNGy/6RCcCAACySRwieuFBV7x+iE4EAACk8qh2RCsb6bcs4QhD
RAEAgJ6M7ZMMEQUAAJ+PpX9eKxvfXjSvrgdFJwIAAFLptzmS06s2ysZXudWL
Tq/oRAAAQCrj8+6ULONG2dibZZyYd4tOBAAApGJf8R78x8Ty5PSqgXGH6EQA
AEAqLk/waIFZO7bRNmAXnQgAAEjFF4icutqolY3qjinRiQAAgFTCkVhaaatW
NirMo6ITAQAAqcQUJf9+p1Y2Sl/1i04EAACkoqpqyfNerWwUPupmYjkAANDX
PeOQVjYyb7eFo0wsBwAAenrRaNPKxuniJj8TywEAgK5qO6e1snH8Ur3bGxKd
CAAASCVxPco3+bUOt190IgAAIBXr2PIXaX9fj3LwXPW8Y110IgAAIJWRadee
TIO2HmWc9SgAAEBX0wtr+7JNG2XjywzD4MSK6EQAAEAqCyveQ+drNspGUlpl
1/Ci6EQAAEAqzrVA4i62Juuc6EQAAEAqHl/o+6IGrWwY2iZFJwIAAFIJhCI/
lTRrZeNJ3ZjoRAAAQCrhaCyzzKKVjTuVg6ITAQAAqfxt8WuXVjauPbWqKrvY
AACAbuLVIl4wtLIRLx7x+iE6FAAAkMrtyoHNxa9lFha/AgAAfT2qGdHKxk8l
zYEQi18BAICeErfMnyxq8PhY/AoAAPRkbJ/UysaxwjqXJyg6EQAAkEp9z0zi
lvnlVbbMAwAAPbUN2JP+UTYOna+xO7yiEwEAAKn0jC59kVa1UTYO5JimFz2i
EwEAAKkMTqx8mWHYKBt7s4y22VXRiQAAgFTGZlwpWcaNsrEnwzA0uSI6EQAA
kMrUwtr+HNNG2UhOr7KOLYtOBAAApDLvWP8qt3qjbCSlVbYPLohOBAAApLLk
8h3Or9VuvzZaZ0UnAgAAUnGuBb69aNbKRnXHlOhEAABAKmve0InLDVrZeNVs
E50IAABIxRsI/3itSSsbFeZR0YkAAIBU/MHIz9ebtbJxt2pQdCIAACCVQCia
erNVKxs3Xvapqio6FAAAkEcoHM0os2hl4+qTtwplAwAA6CcciWXfadfKxuXH
PYpC2QAAALqJRGO55R1a2Sh40BWNKaJDAQAAecSrRf79Lq1snC/voGwAAAAd
xRSl8FG3VjZy7raHozHRoQAAgDwURb3y5K1WNjLLLKEIZQMAAOhGUdWS571a
2UgtbQ2Go6JDAQAAeaiqWvqqXysb/3mjxR+MiA4FAACkcrtyQCsbZ4qbfAHK
BgAA0NM945BWNk5dbVz3h0UnAgAAUnlUO6KVjZNFDWvekOhEAABAKs/qx7Sy
cfxS/ep6UHQiAAAglVfNNq1sHLtY51wLiE4EAACk8qZlXCsbRwvMjlW/6EQA
AEAqla0TWtk4nF+75PKJTgQAAKSypWzk1SyseEUnAgAAUqmybCkbdsoGAADQ
lSGhbHwdLxsOygYAANCToW2SsgEAAD4fY0LZOHS+Zt6xLjoRAACQirF9S9mY
W6ZsAAAAPVV3TFE2AADA50PZAAAAn1VN52bZ+Cq3enbJIzoRAACQSm3ndGLZ
mKFsAAAAXdV2bZaNg5QNAACgt8Q3G+/LxiJlAwAA6MnUvnlm4+C56mnKBgAA
0FXiuPL3ZWNhTXQiAAAgldct41sOiPJmAwAA6OpFo405GwAA4PN5Vj+2ZcU8
i9gAAICuKsyjWtn4Jr920UnZAAAAenpQPayVjaMF5iWXT3QiAAAglXLjkFY2
vr1odqz6RScCAADyUFX1btWgVja+K6xbcQdEhwIAAPKIl42y1/1a2Th+qd7l
oWwAAADdKKp682WfVja+L2pYXQ+KDgUAAOQRLxslz3u1svHDlUa3NyQ6FAAA
kIeiqNeeWrWycepqo8dH2QAAALqJKUpRRY9WNk4XN637w6JDAQAAeUSisYIH
XVrZ+Kmk2RugbAAAAN2EIrFzv3RoZePsjRZfMCI6FAAAkEcgFM0os2hlI/5z
IETZAAAAuvEFImdvtGhl49wvHaFITHQoAAAgD48vdLq4SSsbFx50RaKUDQAA
oBuXJ3iyqEErG0UVPdGYIjoUAACQh8Pt/66wTisb11/0KooqOhQAAJDHotN7
5IJZKxu3KwdUlbIBAAB0M7vk+TqvRisbD6qHRScCAABSmbS7D56r1srGs/ox
0YkAAIBUxmZc+7JNWtmobJ0QnQgAAEhlcGIlJcuolY3azmnRiQAAgFSsY8t7
MgwbTSMprbLJOic6EQAAkErH0EJyetVG2Yj/0D64IDoRAACQSsPb2aS0v39D
+TLD8HZ0SXQiAAAglSrLhHZgIyXTMDixIjoRAACQSoV5VCsb+3NMYzMu0YkA
AIA8VFW9XTmglY1D52umFz2iQwEAAHnEFOXqU6tWNr69aF50+kSHAgAA8ghH
Y/n3u7SycbKoweUJiA4FAADkEQhFMm+3aWXj5+vN6/6w6FAAAEAe8WoRLxha
2YgXj3j9EB0KAADIw+UJnCxq0MpG/v2ucDQmOhQAAJDHotP37UWzVjauPrXG
FEV0KAAAII/pRc+h8zVa2bhdOaCqquhQAABAHmMzrv05m/vlK8yjohMBAACp
9L5bTsk0aGWjyjIhOhEAAJBKS9/8F2lV2n75hrezohMBAACpJG5hS06v6hhi
vzwAANCNqqoPqoe1srEv28jKVwAAoKOYopQ8703cwja1sCY6FAAAkEcoEsu/
36mVjWOFdUsutrABAADdeAPh1NJWrWycLm5ye0OiQwEAAHm4PIEfrjQmLkbx
B1mMAgAAdGN3eI8WbM4qL3zUHWExCgAA0I9tbvVgbrVWNm697lcUZpUDAADd
bBsf+qRuTHQiAAAglS3jQ1MrazqnRCcCAABS2TY+tH2Q8aEAAEA3jA8FAACf
VTSmXH1qZXwoAAD4TPzBSPaddsaHAgCAz8TlCf54rUkrGz+VNDM+FAAA6Ghu
eT1xoldueUcwHBUdCgAAyGN4ynkgx6SVjesvemOKIjoUAACQR/ugPTm9iole
AADgM0kcspGUVlnfMyM6EQAAkIeiquWGIa1spGQZrWPLokMBAAB5hKOxS497
EodsTMy7RYcCAADy8AUi6bcsWtk4fqmeIRsAAEBHK+7AySsNWtk4e7Nl3R8W
HQoAAMhjemHtcH6tVjYKHnSFIjHRoQAAgDysY8t7s4xa2Sh7M6AoquhQAABA
HjWdU0lplVrZeNlkE50IAADIQ1HVe8bNe6/J6VWt/fOiQwEAAHmEIrGLD7u1
snHwXPXItEt0KAAAII81b+g/b7Qk3ntddHpFhwIAAPKYd6x/e3Fz32tqaSv3
XgEAgI4GJ1b2J+x7LaroCUe59woAAHTTaJ1N3Pf6qGZEVbn3CgAA9BHvFRXm
Ua1pfJFWxb5XAACgo0g0dvXJW61s7Ms29Y87RIcCAADy8PrDiSvYjhaYZ5c8
okMBAAB5LDq9Jy7Xa2Xj5+vN7vWg6FAAAEAeQ5MrB85tXkW58KArFI6KDgUA
AORh7p75Im3zKsrdqkGFqygAAEAniqKWJ2xFibeOms4p0aEAAIA8AqFI3r1O
rWzszzENcBUFAADox7HqP3W1MXErin2FrSgAAEA3YzOuQ+drtLKRebvNy1YU
AACgn+beucRB5Tdf9kVjiuhQAABAEqqqPqod0ZpGUmpllWVCdCgAACCPUDh6
8WG3Vjb2ZhmtY0uiQwEAAHm4PIEzxU1a2fj2IoPKAQCAnsbn3Yfza7WykVra
6vGFRIcCAADyaB+078k0aGXj2lNrJBoTHQoAAEhCVdUK86jWNOLPi0ab6FAA
AEAegVC04EGX1jRSMg0dQwuiQwEAAHksuXw/XNmcHXrkgnnSviY6FAAAkMfA
uCNxs3xaaeual9OhAABAN4a2yaS0SmaHAgCAzyESjZU8703cLF/dMSU6FAAA
kId7PXj2ZotWNg7mVg9NOkWHAgAA8hifd3+TMM7rx2tNjlW/6FAAAEAezb1z
X2ZsjvMqfNQdDEdFhwIAAJJQFPWeaThxnNez+jFVVUXnAgAAkvAFIrm/dCQu
e+0aXhQdCgAAyGNmyXP8Ur1WNo4V1rHsFQAA6MgyYE9J2L+WfafN6w+LDgUA
ACQRU5R7xqHEAxu/GAbjvyg6FwAAkITHF8q63aY1jT2Zhpa+edGhAACAPCbm
3UcLzIkHNqYXObABAAB00/B2NnHCRu4vHd4ABzYAAIA+ojGl7HV/4oGNx7Wj
ChM2AACATlyeYOrNVq1p7MtmwgYAANDT6LTr67warWx8X9Rgd3hFhwIAAPIw
tU99kVallY2LD7sDoYjoUAAAQBLhSKz4mVVrGkmplS8abaxEAQAAelly+c4U
N2ll48A5U5/NIToUAACQR8/I0v4ck1Y2Tl9rWl71iw4FAAAkEVOUhzUjiZde
rz61hiIx0bkAAIAk3N5QZplFaxrJ6VXVHVOiQwEAAHmMTDkPJ1x6PVpgHp9z
iw4FAAAkoarq65bxpLTNbyi55R2slQcAAHrxBSMFD7oSL70+a3jHlHIAAKCX
6YW17wrrtLLxVW51/ziXXgEAgG7qe2b2JGx6Tb3Z6vIERIcCAACSCEdiJc97
Ey+9/mIYjMYU0bkAAIAkFp3e09c2B4fuzTK2Dy6IDgUAAORh6Z+PFwytbJy6
2riwwqZXAACgj3AkVvqqP/EbyrWn1lA4KjoXAACQhN3hPXW1UWsaezIMdd0z
okMBAAB5NPfOpSR8Q/m+qGFmySM6FAAAkEQoErv+Yss9lOJn1iDfUAAAgE7m
ltdPXmnQmkZKpqHx7azoUAAAQB4Nb2f3ZG7O8vrhSmO8fogOBQAAJBEMR689
tSZ+Q7nxoi8UiYnOBQAAJDGz6DlxOeEbSpaxpW9edCgAACAPc9d04j6UH681
2ZnlBQAAdOILRAofdSd+Qyl91R/mGwoAANDJyJTzyAWz1jT2ZRvbBuyiQwEA
AEnEFOVJ3WhSwmuNn683Lzp9onMBAABJONz+1NLWxG8o903D7JQHAAB6sQzY
92WbtKZxOK9mYNwhOhQAAJBEMBwteb5lRHnevU6PLyQ6FwAAkMSk3X38Ur3W
NL7MMBjbJ0WHAgAAklBV9U3LeHJ6lVY2Tl5hzSsAANCNez2Yc7c98RvKrdeM
1wAAALqxji19lVutNY2D56q7hhdFhwIAAJIIR2J3KgcTX2tk3m5zeQKicwEA
AElM2tdOFm1uXvsireplk01RVdG5AACADBRFjVeLxKOhxwrrbHOronMBAABJ
LLl8aVunhpY87w2EoqJzAQAASTS8nd2bZdw8GprL0VAAAKAbjy9U8LAr8bXG
+fIO93pQdC4AACAJ69jS13k1WtPYk2mo6ZwSHQoAAEgiFI6Wve5PfK3x8/WW
hRWv6FwAAEAS43NblqEkpVU+qRuNKSyUBwAAOoiXiqf1Y/GCoZWNePGwzXLj
FQAA6GNuef2nkubEbyilr/qDYW68AgAAHSiK+rp5y47XQ+drekaXROcCAACS
sK94z95sSXytUfCwy+MLic4FAABkoKiqwTKxJ8OgNY0DOaaWvnnRuQAAgCSW
XL70W5bE1xp59zpXGeQFAAD0oKpqdcdUSubma4192aaGt7OicwEAAEk43P7s
O22JrzVy7rY71wKicwEAAEnUdc/sy95cu5aSZaztmlZVVXQuAAAgA5cnkFve
kfhaI7PMsrzqF50LAABIotE6uz/HlLh2zdg+yWsNAACgixV3IPeXLa81Uktb
F52sXQMAADpQ/nYJZW/W5mmNLzMMla0TCq81AACAHuwr3rTS1i2vNW622h28
1gAAADqIKcrLJtuXCSNDU7KMxrZJXmsAAABdTC+snSlu2jZbw8ElFAAAoIdw
NPaoduSLtM0FrwdyGBkKAAB0Mzbj+r6oYduCVzebUAAAgB6C4ejdqsHEpnHo
fE374ILoXAAAQBL9NsfRAnNi2Sh+ZvX6w6JzAQAAGXh8oXi1SGwa8eLR+25Z
dC4AACADVVUb384ePFedWDZuvxkIhKKiowEAABnYV7yZZZbEpnHicv3ItEt0
LgAAIININPa0fiw5ffO6a/znJ3Wj4WhMdDQAACCDoUnnictbrrtmlFkYTg4A
AHSx7g+XPO9NbBoHzpnqe2ZYJQ8AAHTRZJ07mLvlXOi1p1aPLyQ6FwAAkMGi
05t9py2xaRy/VD8w7hCdCwAAyCASjT1reJe43TU5varCzLlQAACgj953y8cv
1Se+1ki/ZZlbXhedCwAAyGDFHSh81L3lXGiOqa6bc6EAAEAH0ZjyssmWkmnY
di50zcu5UAAAoIP+cce2wRqnrjaOTDlF5wIAADJweQKXH/ckNo192cYqy0RM
UURHAwAAu140prxuGU/JMiaWjStP3q6uB0VHAwAAMhiaXDlZtOUDyskrDfFf
FJ0LAADIYHU9WFTxNrFppGQZ37SMR2N8QAEAADsVbxSVrRN7t35AuVzR4/IE
REcDAAAysI4tnbi8ZYTXicsNTCYHAAC6sDu8ueUdWz6gZBpeNdv4gAIAAHbO
F4yUG4a+SKtKLBtFFT3ONT6gAACAnVJU1dw989XWJfJnSppHp12iowEAABmM
TDlPFzclNo1D52vqe2YUdqAAAIAdW3EHLldsGRaanF51zzjkD0ZERwMAALte
KBJ7Uje2J2PLtrW8e50LK17R0QAAwK6nqmpL3/yRC+Ztd12tY8uiowEAABkM
TTp/Kmneum3NVGWZ4K4rAADYOfuK98KDrsSmkZRaefNln8cXEh0NAADsevFG
cbtyYNtUjZy77dOLHtHRAADArheOxl412/ZlmxKbxg9XGjmqAQAAdm7jUOjR
AvO2qRrmrmlFYaoGAADYqZEp58/XtxwK3ZNpqDCPBkJR0dEAAMCuZ1/xFmw9
FBp/Sp73skEeAADsnMsTLH3Vn5S2pWlk32mbXlgTHQ0AAOx63kD4QfXwtkmh
J4sarGNLoqMBAIBdLxR5f/1kf86W6ydf59XUdk3HFOZ3AQCAHYnGlHipOJxX
s21S6ItGWyjMoVAAALAjqqq2DdiPX6rfcv0kw3DPNOz1h0WnAwAAu16/zXFm
6/aTpLTKGy/7nGtcPwEAADs1PufOut227aJr4aNuu4P18QAAYKfmltcvPuze
1jSy77TFG4joaAAAYNdbWPFeefI2aWvTOFPS3G9ziI4GAAB2vSWXr/iZddvw
ruOX6tsG7KrK9hMAALAjjlX/jRd923bHH7lgNjNSAwAA7JhzLXDrdX9y+pam
cTi/trpjKhKNiU4HAAB2N5cneLtyYFvTOHS+xmCZCEdoGgAAYEfc3lC5YWjb
6pODudVvWsYZEwoAAHZozRu6bxrek7mlaRw4Z3rZZAvSNAAAwM64PIG7VYPb
3mnszzE9a3jnD0ZEpwMAALvb8qq/9NX2E6H7so0V5lFfgKYBAAB2xL7iLX5m
3XbLNd40HteOsmQNAADs0MySp6iiZ9uM0APn3n894Z0GAADYoYl5d8HDrm17
Tw6dr3ndPB4IcSIUAADsyNiMK7e8Y1vT+Ca/1tg2GWKeBgAA2Jn+cUfmB1vj
j12sM3dNMyMUAADsRExRLP3zp4ubtjWNE5frG62z7D0BAAA7EQpHTe1T3140
b2sap642WgbsisIuVwAA8Ok8vtCTutGD56q3NY2zN1q6hhfZGg8AAHZiyeUr
ezOwbUBo/Mm71zky5RSdDgAA7G4T8+7Lj7cP00hOryp53ju3vC46HQAA2N16
3y1nfXDxZF+28Z5p2OUJiE4HAAB2sUg01mid/fHa9osnh/Pej+3ysV4NAADs
gNsbelo/duh8zbam8X1RQ33PDMM0AADATkwtrJU87922xTX+pJa2do9w8QQA
AHw6RVG7hhczyizbakZSWuWlxz1jMy7RAQEAwC7mD0YMloljF+u2NY39Oab7
puEVN8dBAQDAp1t0+u5WDe7NMn44h7y6YyoYZosrAAD4RIqq9r5bzr/fua1m
xJ+cu+3WsWUOaQAAgE+27g+/aRk/Vrj908meTEPpq35mdgEAgJ2wza0WP7N+
+cEQ8m/ya1822bz+sOiAAABgtwqFo/U9M2c+2BQffzLKLG0D9miMZfEAAOAT
2R3eXwyD+3NMHw4hv/1mgE8nAADgk8UUpWNoIfvO9l0n8efU1cbarulAiFsn
AADgEzlW/U/qRg/n126rGcnpVVeevB2dZmAXAAD4RJForG3AnnO3/cMXGkcL
zC+bbB5fSHRGAACwW80uecoNQwfPVX/YNM6Xd/SMLimM0QAAAJ8kEHp/5eTs
jZYPa8bhvJpHNSNLLp/ojAAAYLd6N7t640Vfygfjx5PSKvPvd/WMLMUULrcC
AIBP4faGqiwTJ680fPhC4/il+pdNttX1oOiMAABgVwpHYpYBe969zqS07TVj
T4bh6lPr0OQKi04AAMAniFeI4SnnjZd9+7K3fzeJP6eLm6o7pnyBiOiYAABg
V1pY8VaYR48WmD+sGQfOmcreDEza3aIzAgCAXcnrD9d0Tn30vklyelXBg67O
oYVINCY6JgAA2H3iFaJreLHgYVe8VHzYNP7zRkt1x9Q6a1sBAMCfF1OUPpuj
5Hnvh5vUNiaCVphH7Ste0TEBAMDuoyjq0ORK6av+g7kfGQe6L9t440Xf0KST
+yYAAODPiveHsRnX3arBr/NqPqwZSWnvB49b+ufDEY5nAACAP2183n3PNHzk
wkcumySlVmaWWWq7ptmkBgAAPsH0oudR7cixwroPa0b8Sb3ZamybZBwoAAD4
s1RVfTe7+qB6+LtfqRk/lTS/aRlfcQdEJwUAALtMNKb0jzvK3gwc/tjZjPhz
6mrji0bbopNtrQAA4M8JRd7PzSh+Zj3wsQut8efE5YYndWNzy+uikwIAgF1m
Zc1f3T518WH3nkzDR2vGmeKm5w3vZpc8opMCAIBdZtHpu/6i9+C5jwzN2Lhp
kn7LYrBMOFb9opMCAIDdJBpTBidWyo1DJy7Xf7RmJKdX5ZZ31HXPrHm50AoA
AP4EtzfUaJ0tfNT90UXwG0/evU5L/7w/yDp4AADwR6mqOml3P2t49/P1j6xn
3XiOXDCfLm6qMI96A2xPAwAAf5TXH24fXLjxou/XrrImpVamlra+bLJNL3L+
EwAA/FHRmDI06XxcO/rz9eakX3mVcSDHVFTxtqVvnkXwAADgj5tbXje0Tebd
60z5lXus8eeHK40PqodHppwxRRGdFwAA7A5ub6ilb77kee/h/Npf6xh7s4z5
9zurO6a4ygoAAP4gjy/UMbRwt2rw1NXGX+sYSamVZ2+0VJhHR6ac0RivMgAA
wO9b84baBxduVw78cOVXO0b8OVZYd+t1f7yN+ALcYwUAAL/PvR5sG7CXvRk4
WdTwGx1jf46p8FF3bdf0kot1aQAA4PctOn3NvXOlr/pPXP6tjrE3y5hb3vG6
edw2t6ooqujUAADgn1ooEhuZcsabw4UHXV/lfnx3ycazL9uUd6/zTcv4+Jyb
2yUAAOC3Odx+y4D9btXgz9ebv0ir+u1vJfn3OytbJybm3bzHAAAAvyEUiY3N
uOK1ofBR929cXN14vs6rufiw22CZmLSvKSodAwAAfFy8YNhmV6s7pkqe9566
2piU9lsFI/5fz5Q0364caO2fX2ZEBgAA+BXhfxSM6y9+v2DEn4O51fn3O182
2YYmnaFwVHR8AADwz2jdHx6ecprap2686PvxWtPvFoyk1Mp4Dyl91d9knVtY
8YqODwAA/ulEorHpRU9z79yD6uHc8o7fPYOxUTBOXmkofmY1tk+Ozbh4iQEA
ABKpqupY9feMLr1sshVVvI3Xht99ffH3glH0t4LR9r5gBCkYAADgH0KR9+8u
2gftzxveXX1q/fl6894s4++2i/iTnF51+lpTvGAY2iZHpykYAADgPVVVV9yB
/nFHdcfUncrBnLvtRwvMf6RabDzx35x/v/NR7YhlwD63vM4eNAAA/sXFFMWx
6h+cWKnrnnlYM3L5cc/pa017Mg1/vF3szzGl37LcfjNQ2zU9NuPyB9mABgDA
vyhFUZ1rgXgfaO2ff9lkK33Vn3O3/bvCut+e2/nhc+RCbfad9ni7MLZP9tkc
8T9T9N8MAAD8fxUvFS5PcHze3Tm0EO8D903DRRVv00pbjxaY/2yviD8pmYYz
xU3xP+Fp/Zilf37SvsbRCwAA/hX4g5FFp29sxhVvFLWd00/qxkpf9eff7/qp
pPlwXk3Sn2wUidXi1NXGggdd94xDNZ1TgxMrzrWAypBwAAAkEo0pHl9o0ekd
n3P3vlu29M9Xd0w9a3h3t2rwypO3OXfbzxQ3HblQm5z+p99RfHhV5FhhXfad
thsv+l40vmvpm49XF7c3JPp/AAAA+FWKqoajsUAoEm8LLk9gyeWbW16ftLtH
p139447ukcV4c6jvmTG2Tb5ssj2qHYn3h5LnvYWPuuMV4uyNlu+LGg7n16b8
mcOZf+RJ+tspi7M3Wy4/7ik3DhksE+2DC7bZVZcnyF4zAAD+GcQLw3eFdRvP
sfhzse5ogfnIBfM3+bVf59V8lVt9IMe0N8u4J8PwR2ZbfaYnOb0qnurn6y35
9ztLX/U/qRut7ZyO15vxeXe8VMQU7p8CAPBPbdK+JqpF/MffVqDGK82Jy/Vn
b7bk3essfma9Zxx62WSr657pGl4cm3EtOr0+LpwCALDL6dI39mQaDp6rPnLB
fOJyw5mS5vRbltzyjkuPe0qe996tGnxcO/qq2VbbOd3SN98zujQy7ZpZ9Ky4
A4EQRQIAgH8J3kC4Y2hBezqHFrqGF7tHFt+OLlnHlvttjsGJlZEp59iMa3ze
Pb2wNre8vuTyOdcCa96QPxiJRGOi/wYAAAAAAAAAAAAAAAAAAAAAAAAAAAAA
AAAAAAAAAAAAAAAAAAAAAAAAAAAAAAAAAAAAAAAAAAAAAAAAAPwJ/w+XyuM6
"], {{0, 222.}, {360., 0}}, {0, 255},
ColorFunction->RGBColor,
ImageResolution->144.],
BoxForm`ImageTag["Byte", ColorSpace -> "RGB", Interleaving -> True],
Selectable->False],
DefaultBaseStyle->"ImageGraphics",
ImageSizeRaw->{360., 222.},
PlotRange->{{0, 360.}, {0, 222.}}]\)]](https://www.wolframcloud.com/obj/resourcesystem/images/91f/91f1e9af-7d3b-430a-a095-6ac18b5a77cb/5461b65e27d2ca81.png) |
| Out[1]= |  |
An x-Ray diffraction (XRD) pattern of low-density polyethylene (LDPE) converted to a list of points:
| In[2]:= | ![(* Evaluate this cell to get the example input *) CloudGet["https://www.wolframcloud.com/obj/dfdac2e6-9502-47c1-9ffd-6e17b092df3e"]](https://www.wolframcloud.com/obj/resourcesystem/images/91f/91f1e9af-7d3b-430a-a095-6ac18b5a77cb/3db781e68f7d816c.png) |
| Out[2]= | 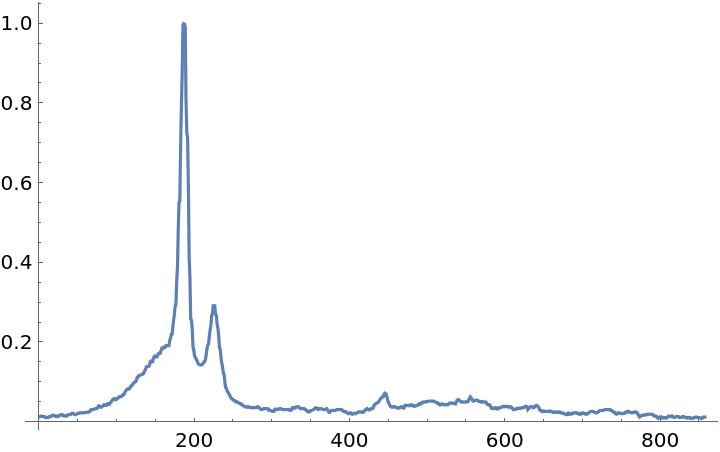 |
Create a Sin plot:
| In[3]:= |
| Out[3]= | 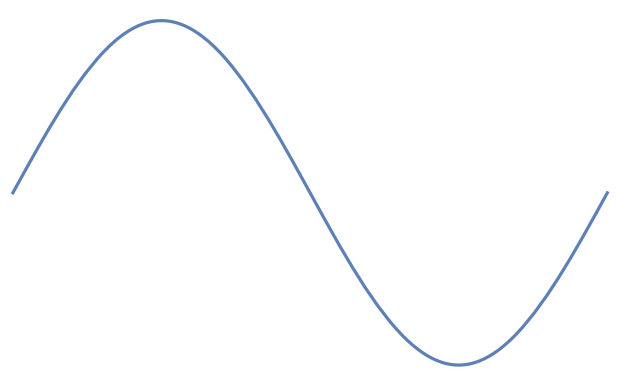 |
Convert the plot into a list of points such that the points are rescaled:
| In[4]:= |
| Out[4]= | 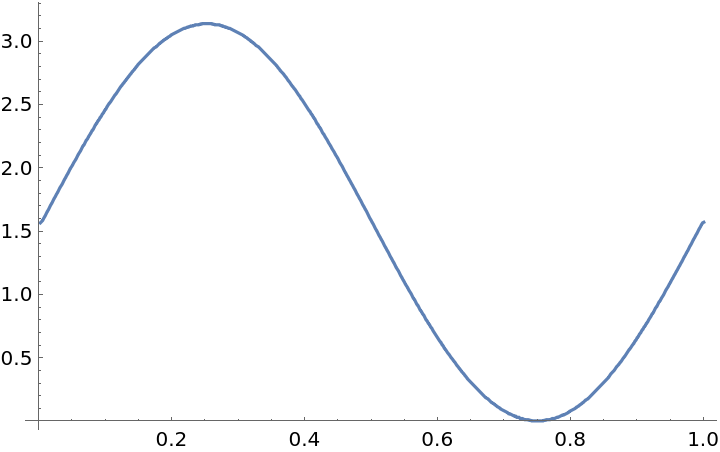 |
You can use ExtractPlotImageData on data consisting of points:
| In[5]:= | ![ListPlot[ResourceFunction["ExtractPlotImageData"][\!\(\*
GraphicsBox[
TagBox[RasterBox[CompressedData["
1:eJzt3dlXW3e24PHc7pf72P9CP9z/4b72Y7/eXv0asK/jKdWVqrjq3txVlaQA
xxg7cWwnpOJ5ShxsY8fBlhhkDGY0g4QRBiSQ0ISEBjQPR0dnoH+gisqZSFBV
5XCc72dRWRUpuHa97Oz1++392/9z7xv/tv+/vfLKK0f+Wfzl3/b85/968809
//V//of4m//76yOHDvz6tX3/+9e/e+3Aa2/+697/Lj78l3965ZWs+M/mf98A
AAAAAAAAAAAAAAAAAAAAAAAAAAAAAAAAAAAAAADYfTRdzxbk5VCqKFU0TTc6
HABAnRRVm19Z77Attnc6bj1a9ITSkqwYHRQAoB7JrPR578K/v9f9apNlz1Hr
3QF3JJE3OigAQD0Wfcmzt+win1d/PuyYcnriRgcFAKhHIl28apmrpfQO22Io
ljM6KABAPSqKOudJXLc+P3594prluTuQkmTV6KAAAHXKlyq+SMbuiq6EM6Uy
d6MAAAAAAAAAgF8oXd8oy+pyKJ3KSYqqGR0OAKBOqqavxvP3Bpc+6XR81jPv
cEWLUsXooAAA9cgV5QF7YN+xnoZmS2OL9c/3ZjyraaODAgDUIxjN3exbqM0T
NV0aHXQEjQ4KAFCPbKFsm/DVUvpHt+2uQNLooAAA9VBULRDN3u53td2YuHB/
dnJ+rcBZOgCYVrmihhN5uyu6FExl8mWjwwEAAAAAAAAAAACAv5Wm6Yl0ial/
ADA1Xd+QZGXOk3gw7Ol5urLoWxd/Kz4EAJhORdGC0ezvPxrc02JtbLG2Xhtf
CWeo1QHAjFI5qX/Kf/hEX3VE9HdnB+4/WWJLEQCYUaFUcbijr5+0VVP6Hz4d
GnWGyxUWiQKA+SiqFksVr1met1wee+/K+O1HrmiyqGocpgOAKamqHozmhmZC
o87VQDRrdDgAAAAAAAAAABiD+VAAeAkwHwoALw3mQwHgpcF8KAC8NJgPBYCX
BvOhAPAyYT4UAAAAAAAAAIAqTdcz+XI8VVQUrj8BwMRUTfeE0rZJf9fQssMV
zRZk2loAwIxEfZ4tlE93TO99r7uh2frGqUciqxdKFaPjAgDsmKyodlf0nfMj
DVvzRPtbe688nFuN542OCwCwY4qq+cKZo5fHqiOiB9v6LKPe9UzJ6LgAADum
63qhVHkw7Gm7PtF0cfTcl8+8q2lJZuofAMwqlixOLqwN2IPuQJK3FgEAAAAA
AAAAv1i6rhelSjiRL8uKxsI5ADAtTdNFMh96FrrT7xpzrkaThYrCNSgAmFJB
qtx57N53rOfVJsveo93WMW+S5nMAMCeXP/nRbXtDs6U6UnTm1vScN2F0UACA
ekQS+Utdzmo+Fz/Xrc99kYzRQQEA6lEqK6Ozqx9+MfXHc8Onbk5NL0ZzRdno
oAAAdUrnyk5Povepb3Y5Tj4HAAAAAAAAAPwyMR8KAC8H5kMB4KXBfCgAvDSY
DwWAlwbzoQDw0mA+FABeJsyHAgAAAAAAAACwsTkiulFRtEginy/JqsaIKACY
labrqZw0ubB2p981YA/4Ixm5ohodFACgHpKsjM+F97f2NjRb9hy1Xn7gDCfy
RgcFAKhHKJbrsC3WRkRbLo89mQkaHRQAoB7JrGQd9dZGRE99MeX0xI0OCgBQ
D7miLvqT7Z2Ot88Nt92YsE34RZI3OigAQJ2KkrIcSvVN+KYW1uKpotHhAAAA
AAAAmI+q6qFYjuVEAGBqmq7ni3LPU9/Fr2avPJwbdARzBZldogBgRpKsuAPJ
N888bmyxNjZbmy+NOj1xanUAMKNUVrJN+g+19VWbz4+cHbg36C6VFaPjAgDs
mMje8yuJ10/aqin9nfMjdldUVnjLBQDMR9P0TL5sHfOevWVv73TYJvxZztIB
wLREVo+nS3PexPzKOvNEAAAAwM9M1XRF5VgFAExPVfXVWM4dSEqyQlYHAJMS
CVyuqF3DnrbrEy2Xxz69NxNYy7KiCADMSFE1XyTTeu1pY4u1odly+GRf99jK
eqZkdFwAgB2rKJpzOf7uhZFq8/n+1t7Pexci6wWj4wIA7Jim6Yl08XTH9IHj
va+19hw5MzA+F84WZKPjAgDUQ2T1Bd/6nX7XxS7nwHQgX6rQ+AIA5lWUlGiy
GIrl0jmJfA4AAAD8PETpXSoruaKsahThAGBiIp9nC/Jzb2JiPlLdT8ThCgCY
kcjekqxc6nL+5sP+19+3vX1+2OXfnBI1Oi4AwI6JmnzBt95yeayx2fpqk+Vg
W++dfpeo1Y2OCwCwY4qqibK86dJodZjowPHeuwPuGC/lAoAJabqezknXrM/f
an9y5MzAsavjzuV4QaoYHRcAoE7BaM426Rf1uYNlcwBgcqqqS7JSKisin9Pt
AgAAAPxsdF0vSpVwIl+WaT0HABPTNF0k86FnoTv9rjHnanWkyOigAAD1KEiV
O4/d+471vNpk2Xu02zrmTbLJAgDMyeVPfnTb3tBsqfafn7k1PedNGB0UAKAe
kUT+Upezms/Fz3Xrc18kY3RQAIB6lMrK6Ozqh19M/fHc8KmbU9OL0VyR5UQA
YFbpXNnpSfQ+9c0ux8nnAAAAAAAAO6XrG2VZXQ6lUzlJUek8BwCzUjV9NZ6/
N7j0Safjs555hyta5E1FADCnXFEesAf2HetpaLY0tlj/fG/Gs5o2OigAQD2C
0dzNvoVa83nTpdFBR9DooAAA9cgWyrYJXy2lf3Tb7gokjQ4KAFAPRdUC0ezt
flfbjYkL92cn59fYTwQA5lWuqOFE3u6KLgVTmXzZ6HAAAACAXwpd36gomsYe
CwAwOV3XS2VldjkeTxUV1lgAgGkpqrYUTJ29Zf/ThdETNyYeTfk5MAcAk0pm
pe7xlb3vdTc0WRqbrac72GQBAGYVSeTv9LtrnefHro6POcNGBwUAqEehVBma
CR060bfvWM+B472Xupy+SNbooAAA9dB1fT1TGnQEP7k70/nY7Q4keW4RAMxL
5PB0vhyIZmPJYqmsGB0OAODHaZqeSJd49hwATE3XNyRZmfMkHgx7ep6uLPrW
xd8yVgQAZlRRtGA0+/uPBve0WBtbrK3XxlfCGWp1ADCjVE7qn/IfPtFX7VT8
3dmB+0+WODYHADMqlCoOd/T1k7ZqSv/Dp0OjznC5ohodFwBgxxRVi6WK1yzP
Wy6PvXdl/PYjVzRZVDUO0wHAlFRVD0ZzQzOhUedqIMowEQCYgyi/RVlOQwsA
mJ2oxldjOXcgSZsiAJiXSOByRe0a9rRdn2i5PPbpvZnAWlbmDhQATEhRNV8k
03rtaWOLtaHZcvhkX/fYynqmZHRcAIAdqyiaczn+7oWRaqfi/tbez3sXIusF
o+MCAOzY1hMuxdMd0weO977W2nPkzMD4XDhbkI2OCwBQD5HVF3zrd/pdF7uc
A9OBfKlC4wsAmFdRUqLJYiiWS+ck8jkA7HIiUWfy5XiqqCjMfwKAiama7gml
bZP+rqFlhyuaLcjM9QOAGYn6PFson+6Y3vted0Oz9Y1Tj0RWL5QqRscFANgx
WVHtrug750cavm5TvPJwbjWeNzouAMCObQ4ThTNHL49VO88PtvVZRr0MEwGA
Gem6XihVHmyN/DddHD335TPvalqSGfkHALOKJYuTC2sD9qA7kGTZHACYgqbp
FUXT6S0HAJMT+TyZlWaX47kibYoAYGKiOB9zhj+4OfXuhZEPbk7OuGNFiU5F
ADClSCJ/5eHcnqPdrzZZGlusn3XP+yMZo4MCANTDE0q3dzqqnYrip/2uY8G3
bnRQAIB6pHPSrUeLB9v69h3rOdjW2zXkiSaLRgcFAKiHpuuBtaxl1Ptxp+Ph
iDeSKHBDCgDmVa6o65mSSOyJTElWGCYCgN1O1zebWyKJfL5EpyIAmJim66mc
NLmwdqffNWAP+CMZuUI1DgCmJMnK+Fx4f2tvQ7Nlz1Hr5QfOcII3FQHAlEKx
XIdtUeTzaqdiy+WxJzNBo4MCANQjmZWso95a8/mpL6acnrjRQQEA6iFX1EV/
sr3T8fa54bYbE7YJv0jyRgcFANiOqm1ufy5vtrR8u6elKCnLoVTfhG9qYS2e
YpgIAHYvfau9PLJeeOIILgWT2UJZo1MRAMxJUbRnS7HffzR4+ITtjVP9d/pd
LJUDAJOKJgv3nyztabG+2mRpaLacuDExubBmdFAAgHrEUsWvnizXelpESp9e
jBodFACgHqWyYl+Mvnth5LenH7/V/qTzsTuSKBgdFACgTvmi/GwpfrNv4dGU
fzWWMzocAED9dH1zJXRRqkiyysNcAGAKqqqHYrlosiASuNGxAADqpOl6vij3
PPVd/Gr2ysO5QUcwV5C/O1UEANj9JFlxB5Jvnnnc2GJtbLY2Xxp1euLU6gBg
RqmsZJv0H2rrq3YqHjk7cG/QXSorRscFANgxkb3nVxKvn7RVU/o750fsriir
5QDAjLStV7msY96zt+ztnQ7bhD/LWToA7HoiUYvsHU8VFeUb/Ygiq8fTpTlv
Yn5lnQcVAWD3UzXdE0rbJv1dQ8sOV1SU4vSZA4AZifo8Wyif7pje+153Q7P1
jVOPRFYvlCpGxwUA2DFZUe2u6DvnRxq27kD3t/ZeeTi3Gmf7MwCYj6JqvnDm
6OWxalvLwbY+y6iXx88BwIx0XS+UKg+GPW3XJ5oujp778pl3NS3JdCoCwO6l
65t95rni9199xpLFyYW1AXvQHUiKuv3nDw8A8BOJfJ4tyM+9iYn5SPUBLrrL
AcCMRPaWZOVSl/M3H/a//r7t7fPDLn9SfGJ0XACAHRM1+YJvveXyWGOzdesC
tPdOv0vU6kbHBQDYMUXVRFnedGm02tNy4Hjv3QF3jFFQADAhTdfTOema9flb
7U+OnBk4dnXcuRwvSAwTAcBup2n61u3nt68/g9GcbdIv6nMHrykCgBmIfJ7M
SrPL8e82K6qqLslKqayIfE63CwDscqI4H3OGP7g59e6FkQ9uTs64Y0VOVwDA
nCKJ/JWHc3uOdr/aZGlssX7WPe+PZIwOCgBQD08o3d7pqLa1iJ/2u44F37rR
QQEAfoSubx6zaN+cAU3npFuPFg+29e071nOwrbdryBNN0qkIALuaruulsjK7
HK8uIap9LhJ8YC1rGfV+3Ol4OOKNJApssgCA3UxRtaVg6uwt+58ujJ64MfFo
yp/Jl2vflivqeqYkEnsiU6JTEQB2uWRW6h5f2dxA1GRpbLae7pie8yaMDgoA
UI9IIn+n3127Az12dXzMGTY6KABAPQqlytBM6NCJzTvQA8d7L3U5fZGs0UEB
AOqh6/p6pjToCH5yd6bzsZuNFQBgCqqqh2K56saKFz8XOTydLwei2ViyWCrz
7DkA7GqarueLcs9T38WvZq88nBM1ea4gs4gIAMxIkhV3IPnmmceNLdbGZmvz
pVGnJ/6tWh0AYAqprGSb9B9q66u2tRw5O3Bv0M0ZCwCYkcje8yuJ10/aqin9
nfMjdh45B4Dd7YcuQDVNz+TL1jHv2Vv29k6HbcKf5SwdAHarH70AFVk9ni7N
eRPzK+tx9oQCwC7GBSgAvDS4AAWAlwYXoABgRpun4qliMJqVK2rtsJwLUAAw
F5GgFUUbnwtftz4/f//Zg2FPLFWsHZhzAQoAJqJqejRZeP/zyT1HuxuaLb96
3zY0E3pxYwUAwCzkijq1sPb2ueHqgflrrT2XHjhX4zmj4wIA7Jio0sPx/LGr
49WUfqitr38qkMpJRscFANiOpuvZgrwcShWlivb1Emdd31wGOjK7ev7+7Kkv
pjofu6PJIs3nALCbKao2v7LeYVts73TcerToCaUl+a8d5ulc2R1IzS7HV2M5
VaOnBQB2tWRW+rx34d/f6361ybLnqPXugDuSyBsdFACgHou+5Nlb9tqK5w87
ppyeuNFBAQDqkUgXr1rmaim9w7YYitHWAgC71/degFZVFHXOk7hufX78+sQ1
y3N3ICXJjPYDwC61/QWokC9VfJGM3RVdCWd4fQsAdjMuQAHAjHR9o6Jo2jef
0OICFABMR9f1UlmZXY7HU0XlhZkgLkABwFwUVVsKpkQ1/qcLoyduTDya8tee
2OICFADMJZmVusdX9r7X3dBkaWy2nu6YnvMmat9yAQoAJhJJ5O/0u2unK8eu
jo85w0YHBQD4cYqqqeo3LkELpcrQTOjQib59x3oOHO+91OX0RbLGBQgA+Emq
x+aBreVxtQ91XV/PlAYdwU/uznQ+drsDSfGPGRgkAGB7mqanstLlB3NHr4wf
uzp+u98l0nhtGlTk8HS+LFJ9LFnkwBwAdrmCVJlxx974sL+x2drQbHn7/PD4
XPjFWh0AsNvoup4vyt99jyWTL1cPzKt3oP/x8aB1zPut6X4AwO6hanoyK00u
rM0ux5PZ0ouLJ8oV1RNK/efHg6+19uxv7T1+/emCb51NQwCwO4kEHksVj14Z
/38fPBI/H99xrK0X1BeWx4mafGph7arl+Wc989OLayKfs2oIAHanbEEec4Z/
9f6jhmaL+PmvT57YJv0vHq1Uz2TC8XwkUcgVZQNDBQDUaLqeyZer77HUKm2R
pZ8+jxz++rT8rU+e9E8HyszvA8Aupmq6J5QWFXjX0LLDFRXFefV0paKowWju
/c8nf3d24PcfDZ778pkvkqXDHAB2ra0dQ+XTHdObT7I0W9849Uhk9UKpUv22
Okn01dDyw1GvO5A0NlQAwPZkRbW7ou+cH2nYOl3Z39p75eHcavyvaylEVi+V
FamsUJ8DwO7xvUs/RaL2hTNHL49VD8wPtvVZRr3rmZKxoQIAtvFDSz91XS+U
Kg+GPW3XJ5oujp778pl3Nc0b5gCwm22/9DOWLE4urA3YgzyxBQC7h6bpmyM/
+reHflj6CQDmom3N788ux3NFWf3mKCdLPwHARERxPuYMf3Bz6t0LIx/cnJxx
x4pS5YVvWfoJALuOrm9m70giny99oxQXn1x5OLfn6OZpeWOL9bPueX8k8+Iv
svQTAHYVTddTuc2nEe/0uwbsAZG0a0+Ue0Lp9k5H7Wil/a5jwbdubLQAgG1I
sjI+F97f2tvQvNm4cvmBM/x140o6J916tHiwbXPj58G23q4hTzRZNDZaAMA2
QrFch21R5PNqKd5yeezJTLD6lSjgA2tZy6j3407HwxFvJFFQeewWAHYHVdVF
Ao8mCy/ulUhmJeuot3a6cuqLb/QilivqeqYkEnsiU5IVbj8BwHja1jvkPU99
F7+avfJwbtARzBVkbavVXK6oi/5ke6fj7XPDbTcmbBN+keSNjhcA8INrPSVZ
cQeSb5553NhibWy2Nl8aFaV4rVYvSspyKNU34ZtaWIunOC0HAONts9YzlZVs
k/5DbX/ZPXHk7MC9QTdthwCwO22/1lNk7/mVxOsnbdWU/s75Ebsrytk4ABhO
0/R4qhiMZuWKWnt5Zfu1nuJXMvmydcx79pa9vdNhm/Bnvz5LBwAYQqRgRdHG
58LXrc/P33/2YNgjKvPqkfiPrvXc/BdBujTnTcyvrHNgDgA/J1FBiyJclNab
65i/rqZVTY8mC+9/PrnnaLcoxX/1vm1oJiT+mQ3WegKA0X7o3VrxQVGqeFcz
TxzBYDS72cHydcPh1MLa2+eGq6X4a609lx44V+N/ef+QtZ4AYJRt3q0Vqds6
tnLkzMDhE32/Pd0vSvFcQd7YqtLD8fyxq+PVlH6ora9/KpDK/bWNnLWeAPDz
2/7dWl8kc+7LZ40tVpG3G5qt5+8/cwdTG1vVe7mijsyunr8/e+qLqc7H7miy
+OIoKADgH6e+d2sDa1mR0mtD+he/ml3aSulV6VzZHUiJ8n41luPRFQD4u/ve
sc26360Vf1T3+MofPh36zYf9f/jz0IA9yJA+APzdiapYUb/d0P1DY5t/y7u1
8XRpzBn+vGdhZHY1nSOfA8Dfmarqq7GcO5AUufrFxsIfGtv8W96tFdW+KOlF
2V+ufOdfIQCAn+B7BzM3vu4S7xr2tF2fEJn503szIiFXT1G2Gdvk3VoA+EfT
dV1Uv+FEviz/dYxnm8HMja3mQF8k03rtaWOLVeTtwyf7usdWRELe2HZsk3dr
AeBbfujB2I2tQ49MvlyWv/9o4nu/FX+ISOZDz0J3+l1jztXaPohtBjM3tnoO
ncvxdy+MVPP2/tbez3sXIuuFjR8b2+TdWgCo+aGbR33r4EIk1SeO4FIwmS2U
X0z423xbkCp3Hrv3HesRmXnv0W7rmDe5VWxvP5gpfj2RLp7umD5wvFd8deTM
gKjns1vjPxuMbQLAT7DNzaOiaM+WYqIqPnzC9sapflFyV49Bqrb51uVPfnTb
XruyPHNres6b2PgJg5kiqy/41sUfdbHLOTAdyJcqLxb/jG0CwPa2uXmMJgv3
nyzt+ct8peXEjQlRydd+cZtvI4n8pS5n7cryuvW5b2vG56cMZhYlRXwYiuXS
OYkuFADYkW1uHkX1/tWT5VpmFkl7ejFa+8VtvhW19Ojs6odfTP3x3PCpm1Pi
c/G/UvtFBjMB4B9km5tHkZnti9F3L4z89vTjt9qfiKI6kijUfnH7b0XednoS
vU991SezDPg/BgC/SNvcPOaL8rOl+M2+hUdTflFUf+sXt/8WAGCIH7p51PXN
x8aLUkWS1e8ekmz/LQCgPv8frmvxnw==
"], {{0, 293.}, {497., 0}}, {0, 255},
ColorFunction->RGBColor],
BoxForm`ImageTag["Byte", ColorSpace -> "RGB", Interleaving -> True],
Selectable->False],
DefaultBaseStyle->"ImageGraphics",
ImageSize->{154., Automatic},
ImageSizeRaw->{497., 293.},
PlotRange->{{0, 497.}, {0, 293.}}]\)], PlotRange -> All]](https://www.wolframcloud.com/obj/resourcesystem/images/91f/91f1e9af-7d3b-430a-a095-6ac18b5a77cb/777ea74ea33bec5f.png) |
| Out[5]= | 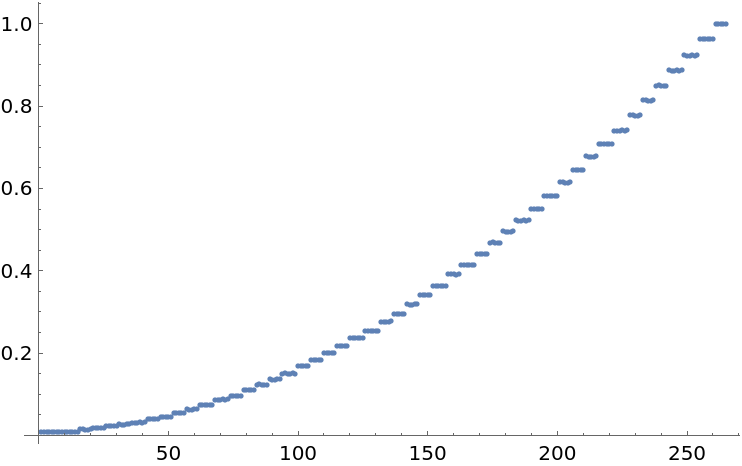 |
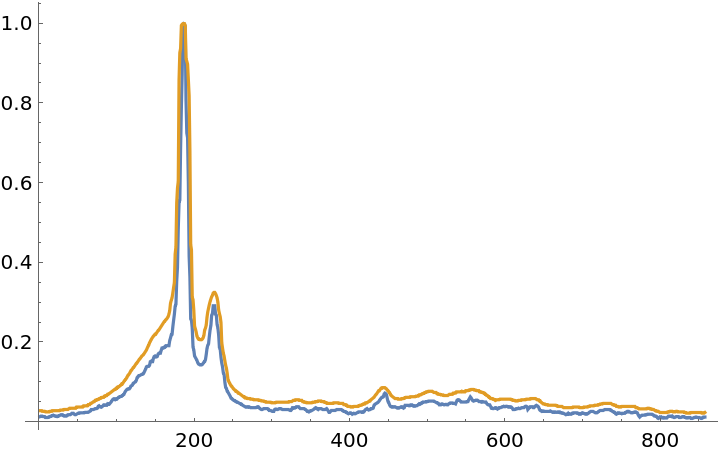
The x- and y-scales can be arbitrarily manipulated. Take for example this UV-Vis spectroscopy graph of ZnO nanoparticles:
| In[6]:= | ![(* Evaluate this cell to get the example input *) CloudGet["https://www.wolframcloud.com/obj/9b7e6b57-5536-4c84-80b4-4fd4ce40d669"]](https://www.wolframcloud.com/obj/resourcesystem/images/91f/91f1e9af-7d3b-430a-a095-6ac18b5a77cb/46b38abdfd885bdc.png) |
| Out[6]= | 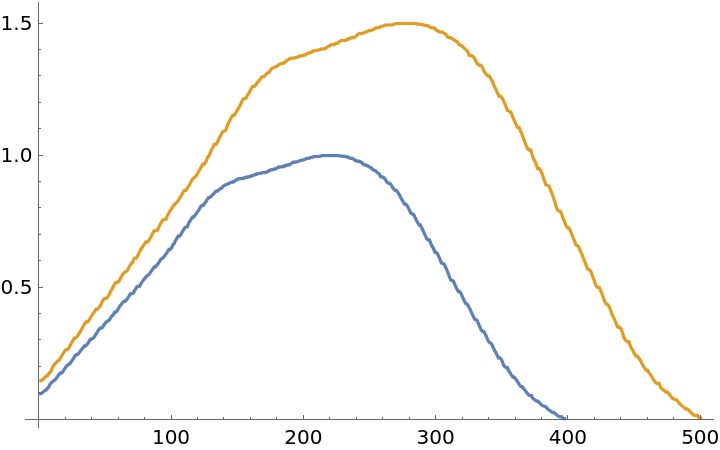 |
The extracted data can be interpolated:
| In[7]:= | ![(* Evaluate this cell to get the example input *) CloudGet["https://www.wolframcloud.com/obj/2b9d2cf9-0493-45d4-8f75-78f7069d4263"]](https://www.wolframcloud.com/obj/resourcesystem/images/91f/91f1e9af-7d3b-430a-a095-6ac18b5a77cb/7db719a47a60a347.png) |
| Out[7]= |
| In[8]:= |
| Out[8]= | 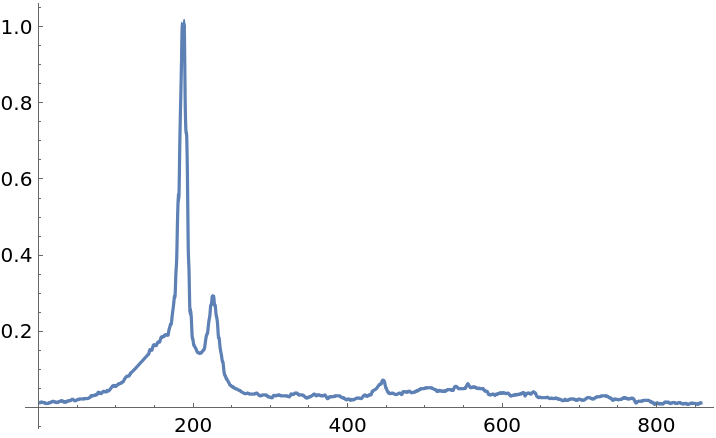 |
On sets of points, FindFormula can be used to detect what relationship is found in the data:
| In[9]:= | ![FindFormula[ResourceFunction["ExtractPlotImageData"][\!\(\*
GraphicsBox[
TagBox[RasterBox[CompressedData["
1:eJzt3dlXW3e24PHc7pf72P9CP9z/4b72Y7/eXv0asK/jKdWVqrjq3txVlaQA
xxg7cWwnpOJ5ShxsY8fBlhhkDGY0g4QRBiSQ0ISEBjQPR0dnoH+gisqZSFBV
5XCc72dRWRUpuHa97Oz1++392/9z7xv/tv+/vfLKK0f+Wfzl3/b85/968809
//V//of4m//76yOHDvz6tX3/+9e/e+3Aa2/+697/Lj78l3965ZWs+M/mf98A
AAAAAAAAAAAAAAAAAAAAAAAAAAAAAAAAAAAAAADYfTRdzxbk5VCqKFU0TTc6
HABAnRRVm19Z77Attnc6bj1a9ITSkqwYHRQAoB7JrPR578K/v9f9apNlz1Hr
3QF3JJE3OigAQD0Wfcmzt+win1d/PuyYcnriRgcFAKhHIl28apmrpfQO22Io
ljM6KABAPSqKOudJXLc+P3594prluTuQkmTV6KAAAHXKlyq+SMbuiq6EM6Uy
d6MAAAAAAAAAgF8oXd8oy+pyKJ3KSYqqGR0OAKBOqqavxvP3Bpc+6XR81jPv
cEWLUsXooAAA9cgV5QF7YN+xnoZmS2OL9c/3ZjyraaODAgDUIxjN3exbqM0T
NV0aHXQEjQ4KAFCPbKFsm/DVUvpHt+2uQNLooAAA9VBULRDN3u53td2YuHB/
dnJ+rcBZOgCYVrmihhN5uyu6FExl8mWjwwEAAAAAAAAAAACAv5Wm6Yl0ial/
ADA1Xd+QZGXOk3gw7Ol5urLoWxd/Kz4EAJhORdGC0ezvPxrc02JtbLG2Xhtf
CWeo1QHAjFI5qX/Kf/hEX3VE9HdnB+4/WWJLEQCYUaFUcbijr5+0VVP6Hz4d
GnWGyxUWiQKA+SiqFksVr1met1wee+/K+O1HrmiyqGocpgOAKamqHozmhmZC
o87VQDRrdDgAAAAAAAAAABiD+VAAeAkwHwoALw3mQwHgpcF8KAC8NJgPBYCX
BvOhAPAyYT4UAAAAAAAAAIAqTdcz+XI8VVQUrj8BwMRUTfeE0rZJf9fQssMV
zRZk2loAwIxEfZ4tlE93TO99r7uh2frGqUciqxdKFaPjAgDsmKyodlf0nfMj
DVvzRPtbe688nFuN542OCwCwY4qq+cKZo5fHqiOiB9v6LKPe9UzJ6LgAADum
63qhVHkw7Gm7PtF0cfTcl8+8q2lJZuofAMwqlixOLqwN2IPuQJK3FgEAAAAA
AAAAv1i6rhelSjiRL8uKxsI5ADAtTdNFMh96FrrT7xpzrkaThYrCNSgAmFJB
qtx57N53rOfVJsveo93WMW+S5nMAMCeXP/nRbXtDs6U6UnTm1vScN2F0UACA
ekQS+Utdzmo+Fz/Xrc99kYzRQQEA6lEqK6Ozqx9+MfXHc8Onbk5NL0ZzRdno
oAAAdUrnyk5Povepb3Y5Tj4HAAAAAAAAAPwyMR8KAC8H5kMB4KXBfCgAvDSY
DwWAlwbzoQDw0mA+FABeJsyHAgAAAAAAAACwsTkiulFRtEginy/JqsaIKACY
labrqZw0ubB2p981YA/4Ixm5ohodFACgHpKsjM+F97f2NjRb9hy1Xn7gDCfy
RgcFAKhHKJbrsC3WRkRbLo89mQkaHRQAoB7JrGQd9dZGRE99MeX0xI0OCgBQ
D7miLvqT7Z2Ot88Nt92YsE34RZI3OigAQJ2KkrIcSvVN+KYW1uKpotHhAAAA
AAAAmI+q6qFYjuVEAGBqmq7ni3LPU9/Fr2avPJwbdARzBZldogBgRpKsuAPJ
N888bmyxNjZbmy+NOj1xanUAMKNUVrJN+g+19VWbz4+cHbg36C6VFaPjAgDs
mMje8yuJ10/aqin9nfMjdldUVnjLBQDMR9P0TL5sHfOevWVv73TYJvxZztIB
wLREVo+nS3PexPzKOvNEAAAAwM9M1XRF5VgFAExPVfXVWM4dSEqyQlYHAJMS
CVyuqF3DnrbrEy2Xxz69NxNYy7KiCADMSFE1XyTTeu1pY4u1odly+GRf99jK
eqZkdFwAgB2rKJpzOf7uhZFq8/n+1t7Pexci6wWj4wIA7Jim6Yl08XTH9IHj
va+19hw5MzA+F84WZKPjAgDUQ2T1Bd/6nX7XxS7nwHQgX6rQ+AIA5lWUlGiy
GIrl0jmJfA4AAAD8PETpXSoruaKsahThAGBiIp9nC/Jzb2JiPlLdT8ThCgCY
kcjekqxc6nL+5sP+19+3vX1+2OXfnBI1Oi4AwI6JmnzBt95yeayx2fpqk+Vg
W++dfpeo1Y2OCwCwY4qqibK86dJodZjowPHeuwPuGC/lAoAJabqezknXrM/f
an9y5MzAsavjzuV4QaoYHRcAoE7BaM426Rf1uYNlcwBgcqqqS7JSKisin9Pt
AgAAAPxsdF0vSpVwIl+WaT0HABPTNF0k86FnoTv9rjHnanWkyOigAAD1KEiV
O4/d+471vNpk2Xu02zrmTbLJAgDMyeVPfnTb3tBsqfafn7k1PedNGB0UAKAe
kUT+Upezms/Fz3Xrc18kY3RQAIB6lMrK6Ozqh19M/fHc8KmbU9OL0VyR5UQA
YFbpXNnpSfQ+9c0ux8nnAAAAAAAAO6XrG2VZXQ6lUzlJUek8BwCzUjV9NZ6/
N7j0Safjs555hyta5E1FADCnXFEesAf2HetpaLY0tlj/fG/Gs5o2OigAQD2C
0dzNvoVa83nTpdFBR9DooAAA9cgWyrYJXy2lf3Tb7gokjQ4KAFAPRdUC0ezt
flfbjYkL92cn59fYTwQA5lWuqOFE3u6KLgVTmXzZ6HAAAACAXwpd36gomsYe
CwAwOV3XS2VldjkeTxUV1lgAgGkpqrYUTJ29Zf/ThdETNyYeTfk5MAcAk0pm
pe7xlb3vdTc0WRqbrac72GQBAGYVSeTv9LtrnefHro6POcNGBwUAqEehVBma
CR060bfvWM+B472Xupy+SNbooAAA9dB1fT1TGnQEP7k70/nY7Q4keW4RAMxL
5PB0vhyIZmPJYqmsGB0OAODHaZqeSJd49hwATE3XNyRZmfMkHgx7ep6uLPrW
xd8yVgQAZlRRtGA0+/uPBve0WBtbrK3XxlfCGWp1ADCjVE7qn/IfPtFX7VT8
3dmB+0+WODYHADMqlCoOd/T1k7ZqSv/Dp0OjznC5ohodFwBgxxRVi6WK1yzP
Wy6PvXdl/PYjVzRZVDUO0wHAlFRVD0ZzQzOhUedqIMowEQCYgyi/RVlOQwsA
mJ2oxldjOXcgSZsiAJiXSOByRe0a9rRdn2i5PPbpvZnAWlbmDhQATEhRNV8k
03rtaWOLtaHZcvhkX/fYynqmZHRcAIAdqyiaczn+7oWRaqfi/tbez3sXIusF
o+MCAOzY1hMuxdMd0weO977W2nPkzMD4XDhbkI2OCwBQD5HVF3zrd/pdF7uc
A9OBfKlC4wsAmFdRUqLJYiiWS+ck8jkA7HIiUWfy5XiqqCjMfwKAiama7gml
bZP+rqFlhyuaLcjM9QOAGYn6PFson+6Y3vted0Oz9Y1Tj0RWL5QqRscFANgx
WVHtrug750cavm5TvPJwbjWeNzouAMCObQ4ThTNHL49VO88PtvVZRr0MEwGA
Gem6XihVHmyN/DddHD335TPvalqSGfkHALOKJYuTC2sD9qA7kGTZHACYgqbp
FUXT6S0HAJMT+TyZlWaX47kibYoAYGKiOB9zhj+4OfXuhZEPbk7OuGNFiU5F
ADClSCJ/5eHcnqPdrzZZGlusn3XP+yMZo4MCANTDE0q3dzqqnYrip/2uY8G3
bnRQAIB6pHPSrUeLB9v69h3rOdjW2zXkiSaLRgcFAKiHpuuBtaxl1Ptxp+Ph
iDeSKHBDCgDmVa6o65mSSOyJTElWGCYCgN1O1zebWyKJfL5EpyIAmJim66mc
NLmwdqffNWAP+CMZuUI1DgCmJMnK+Fx4f2tvQ7Nlz1Hr5QfOcII3FQHAlEKx
XIdtUeTzaqdiy+WxJzNBo4MCANQjmZWso95a8/mpL6acnrjRQQEA6iFX1EV/
sr3T8fa54bYbE7YJv0jyRgcFANiOqm1ufy5vtrR8u6elKCnLoVTfhG9qYS2e
YpgIAHYvfau9PLJeeOIILgWT2UJZo1MRAMxJUbRnS7HffzR4+ITtjVP9d/pd
LJUDAJOKJgv3nyztabG+2mRpaLacuDExubBmdFAAgHrEUsWvnizXelpESp9e
jBodFACgHqWyYl+Mvnth5LenH7/V/qTzsTuSKBgdFACgTvmi/GwpfrNv4dGU
fzWWMzocAED9dH1zJXRRqkiyysNcAGAKqqqHYrlosiASuNGxAADqpOl6vij3
PPVd/Gr2ysO5QUcwV5C/O1UEANj9JFlxB5Jvnnnc2GJtbLY2Xxp1euLU6gBg
RqmsZJv0H2rrq3YqHjk7cG/QXSorRscFANgxkb3nVxKvn7RVU/o750fsriir
5QDAjLStV7msY96zt+ztnQ7bhD/LWToA7HoiUYvsHU8VFeUb/Ygiq8fTpTlv
Yn5lnQcVAWD3UzXdE0rbJv1dQ8sOV1SU4vSZA4AZifo8Wyif7pje+153Q7P1
jVOPRFYvlCpGxwUA2DFZUe2u6DvnRxq27kD3t/ZeeTi3Gmf7MwCYj6JqvnDm
6OWxalvLwbY+y6iXx88BwIx0XS+UKg+GPW3XJ5oujp778pl3NS3JdCoCwO6l
65t95rni9199xpLFyYW1AXvQHUiKuv3nDw8A8BOJfJ4tyM+9iYn5SPUBLrrL
AcCMRPaWZOVSl/M3H/a//r7t7fPDLn9SfGJ0XACAHRM1+YJvveXyWGOzdesC
tPdOv0vU6kbHBQDYMUXVRFnedGm02tNy4Hjv3QF3jFFQADAhTdfTOema9flb
7U+OnBk4dnXcuRwvSAwTAcBup2n61u3nt68/g9GcbdIv6nMHrykCgBmIfJ7M
SrPL8e82K6qqLslKqayIfE63CwDscqI4H3OGP7g59e6FkQ9uTs64Y0VOVwDA
nCKJ/JWHc3uOdr/aZGlssX7WPe+PZIwOCgBQD08o3d7pqLa1iJ/2u44F37rR
QQEAfoSubx6zaN+cAU3npFuPFg+29e071nOwrbdryBNN0qkIALuaruulsjK7
HK8uIap9LhJ8YC1rGfV+3Ol4OOKNJApssgCA3UxRtaVg6uwt+58ujJ64MfFo
yp/Jl2vflivqeqYkEnsiU6JTEQB2uWRW6h5f2dxA1GRpbLae7pie8yaMDgoA
UI9IIn+n3127Az12dXzMGTY6KABAPQqlytBM6NCJzTvQA8d7L3U5fZGs0UEB
AOqh6/p6pjToCH5yd6bzsZuNFQBgCqqqh2K56saKFz8XOTydLwei2ViyWCrz
7DkA7GqarueLcs9T38WvZq88nBM1ea4gs4gIAMxIkhV3IPnmmceNLdbGZmvz
pVGnJ/6tWh0AYAqprGSb9B9q66u2tRw5O3Bv0M0ZCwCYkcje8yuJ10/aqin9
nfMjdh45B4Dd7YcuQDVNz+TL1jHv2Vv29k6HbcKf5SwdAHarH70AFVk9ni7N
eRPzK+tx9oQCwC7GBSgAvDS4AAWAlwYXoABgRpun4qliMJqVK2rtsJwLUAAw
F5GgFUUbnwtftz4/f//Zg2FPLFWsHZhzAQoAJqJqejRZeP/zyT1HuxuaLb96
3zY0E3pxYwUAwCzkijq1sPb2ueHqgflrrT2XHjhX4zmj4wIA7Jio0sPx/LGr
49WUfqitr38qkMpJRscFANiOpuvZgrwcShWlivb1Emdd31wGOjK7ev7+7Kkv
pjofu6PJIs3nALCbKao2v7LeYVts73TcerToCaUl+a8d5ulc2R1IzS7HV2M5
VaOnBQB2tWRW+rx34d/f6361ybLnqPXugDuSyBsdFACgHou+5Nlb9tqK5w87
ppyeuNFBAQDqkUgXr1rmaim9w7YYitHWAgC71/degFZVFHXOk7hufX78+sQ1
y3N3ICXJjPYDwC61/QWokC9VfJGM3RVdCWd4fQsAdjMuQAHAjHR9o6Jo2jef
0OICFABMR9f1UlmZXY7HU0XlhZkgLkABwFwUVVsKpkQ1/qcLoyduTDya8tee
2OICFADMJZmVusdX9r7X3dBkaWy2nu6YnvMmat9yAQoAJhJJ5O/0u2unK8eu
jo85w0YHBQD4cYqqqeo3LkELpcrQTOjQib59x3oOHO+91OX0RbLGBQgA+Emq
x+aBreVxtQ91XV/PlAYdwU/uznQ+drsDSfGPGRgkAGB7mqanstLlB3NHr4wf
uzp+u98l0nhtGlTk8HS+LFJ9LFnkwBwAdrmCVJlxx974sL+x2drQbHn7/PD4
XPjFWh0AsNvoup4vyt99jyWTL1cPzKt3oP/x8aB1zPut6X4AwO6hanoyK00u
rM0ux5PZ0ouLJ8oV1RNK/efHg6+19uxv7T1+/emCb51NQwCwO4kEHksVj14Z
/38fPBI/H99xrK0X1BeWx4mafGph7arl+Wc989OLayKfs2oIAHanbEEec4Z/
9f6jhmaL+PmvT57YJv0vHq1Uz2TC8XwkUcgVZQNDBQDUaLqeyZer77HUKm2R
pZ8+jxz++rT8rU+e9E8HyszvA8Aupmq6J5QWFXjX0LLDFRXFefV0paKowWju
/c8nf3d24PcfDZ778pkvkqXDHAB2ra0dQ+XTHdObT7I0W9849Uhk9UKpUv22
Okn01dDyw1GvO5A0NlQAwPZkRbW7ou+cH2nYOl3Z39p75eHcavyvaylEVi+V
FamsUJ8DwO7xvUs/RaL2hTNHL49VD8wPtvVZRr3rmZKxoQIAtvFDSz91XS+U
Kg+GPW3XJ5oujp778pl3Nc0b5gCwm22/9DOWLE4urA3YgzyxBQC7h6bpmyM/
+reHflj6CQDmom3N788ux3NFWf3mKCdLPwHARERxPuYMf3Bz6t0LIx/cnJxx
x4pS5YVvWfoJALuOrm9m70giny99oxQXn1x5OLfn6OZpeWOL9bPueX8k8+Iv
svQTAHYVTddTuc2nEe/0uwbsAZG0a0+Ue0Lp9k5H7Wil/a5jwbdubLQAgG1I
sjI+F97f2tvQvNm4cvmBM/x140o6J916tHiwbXPj58G23q4hTzRZNDZaAMA2
QrFch21R5PNqKd5yeezJTLD6lSjgA2tZy6j3407HwxFvJFFQeewWAHYHVdVF
Ao8mCy/ulUhmJeuot3a6cuqLb/QilivqeqYkEnsiU5IVbj8BwHja1jvkPU99
F7+avfJwbtARzBVkbavVXK6oi/5ke6fj7XPDbTcmbBN+keSNjhcA8INrPSVZ
cQeSb5553NhibWy2Nl8aFaV4rVYvSspyKNU34ZtaWIunOC0HAONts9YzlZVs
k/5DbX/ZPXHk7MC9QTdthwCwO22/1lNk7/mVxOsnbdWU/s75Ebsrytk4ABhO
0/R4qhiMZuWKWnt5Zfu1nuJXMvmydcx79pa9vdNhm/Bnvz5LBwAYQqRgRdHG
58LXrc/P33/2YNgjKvPqkfiPrvXc/BdBujTnTcyvrHNgDgA/J1FBiyJclNab
65i/rqZVTY8mC+9/PrnnaLcoxX/1vm1oJiT+mQ3WegKA0X7o3VrxQVGqeFcz
TxzBYDS72cHydcPh1MLa2+eGq6X4a609lx44V+N/ef+QtZ4AYJRt3q0Vqds6
tnLkzMDhE32/Pd0vSvFcQd7YqtLD8fyxq+PVlH6ora9/KpDK/bWNnLWeAPDz
2/7dWl8kc+7LZ40tVpG3G5qt5+8/cwdTG1vVe7mijsyunr8/e+qLqc7H7miy
+OIoKADgH6e+d2sDa1mR0mtD+he/ml3aSulV6VzZHUiJ8n41luPRFQD4u/ve
sc26360Vf1T3+MofPh36zYf9f/jz0IA9yJA+APzdiapYUb/d0P1DY5t/y7u1
8XRpzBn+vGdhZHY1nSOfA8Dfmarqq7GcO5AUufrFxsIfGtv8W96tFdW+KOlF
2V+ufOdfIQCAn+B7BzM3vu4S7xr2tF2fEJn503szIiFXT1G2Gdvk3VoA+EfT
dV1Uv+FEviz/dYxnm8HMja3mQF8k03rtaWOLVeTtwyf7usdWRELe2HZsk3dr
AeBbfujB2I2tQ49MvlyWv/9o4nu/FX+ISOZDz0J3+l1jztXaPohtBjM3tnoO
ncvxdy+MVPP2/tbez3sXIuuFjR8b2+TdWgCo+aGbR33r4EIk1SeO4FIwmS2U
X0z423xbkCp3Hrv3HesRmXnv0W7rmDe5VWxvP5gpfj2RLp7umD5wvFd8deTM
gKjns1vjPxuMbQLAT7DNzaOiaM+WYqIqPnzC9sapflFyV49Bqrb51uVPfnTb
XruyPHNres6b2PgJg5kiqy/41sUfdbHLOTAdyJcqLxb/jG0CwPa2uXmMJgv3
nyzt+ct8peXEjQlRydd+cZtvI4n8pS5n7cryuvW5b2vG56cMZhYlRXwYiuXS
OYkuFADYkW1uHkX1/tWT5VpmFkl7ejFa+8VtvhW19Ojs6odfTP3x3PCpm1Pi
c/G/UvtFBjMB4B9km5tHkZnti9F3L4z89vTjt9qfiKI6kijUfnH7b0XednoS
vU991SezDPg/BgC/SNvcPOaL8rOl+M2+hUdTflFUf+sXt/8WAGCIH7p51PXN
x8aLUkWS1e8ekmz/LQCgPv8frmvxnw==
"], {{0, 293.}, {497., 0}}, {0, 255},
ColorFunction->RGBColor],
BoxForm`ImageTag["Byte", ColorSpace -> "RGB", Interleaving -> True],
Selectable->False],
DefaultBaseStyle->"ImageGraphics",
ImageSize->{211., Automatic},
ImageSizeRaw->{497., 293.},
PlotRange->{{0, 497.}, {0, 293.}}]\)], x]](https://www.wolframcloud.com/obj/resourcesystem/images/91f/91f1e9af-7d3b-430a-a095-6ac18b5a77cb/3a43931d00aaab63.png) |
| Out[9]= |  |
Content in the image other than the curve is treated as data. Here, the "(a)" distorts the average pixel height:
| In[11]:= | ![ListLinePlot[ResourceFunction["ExtractPlotImageData"][\!\(\*
GraphicsBox[
TagBox[RasterBox[CompressedData["
1:eJzsvWd8VNmV7j3ve++H+/H9cMeT7BnfmfE4jO0Z26/tbrc7BzqTc5NzBoEE
IgoQWeScc845BwFKKCCJKIIQAiEQWSIIqaqeu9Y+dU6dElmoGlp6/vwKVTxn
n312ePbaa6/9f1p2q9X2//2bv/mbnv9L/qvVoveHYWEtImv/f/KibteeHdp1
bdP6i6692rRrE/ZWy/8hb/7P/+dv/maufP9/ynMQQgghhBBCCCGEEEIIIaTC
8Mk/89fnMw8bj9eLUo8HXq/vaT8lhBBCCCHkhSgt9ThaU/Wn1+c1D3lmPff6
H+Y59SchhBBCCHl53HrT+t8XeO5zPczr15pUQgghhBDyA8dSlV6/trQfXvMA
fM63CCGEEEIIeVkClk1rDt2xaQbZPC17KOfWCSGEEEJI+bDn1C29qeuGVq9Z
i+27duHewwd+304fPKI3PR5qTkIIIYQQUh4C8+aWtvQirGcvjBgTgzv37onm
9FtBy6xrJ4QQQggh5EVR+2bguWXz7Cmac1TMWNx78PD1JYwQQgghhFQanqk5
H1JzEkIIIYSQV4d2TkIIIYQQEmpo5ySEEEIIIaHmWZqz6MGD15cwQgghhBBS
afDBV+a5pTmHjRqNO0X3Xl/CCCGEEEJIpcTWnL16haNb70iczb30WGx4Qggh
hBBCXgW3nbNG46Y4cCQZHq/HPKg5CSGEEEJIRWBrzoiIPviiTn1sjz1EGych
hBBCCKlQ3HbOL+s1wPaDh+HxeJ/7O0IIIYQQQl4UW3OGh0egxndNsS8pybFx
+rj3JSGEEEIIqQDcds6v6jfC7vgEzqsTQgghhJAKhZqTEEIIIYSEGmpOQggh
hBASaqg5CSGEEEJIqKHmJIQQQgghoYaakxBCCCGEhBpqTkIIIYQQEmqoOQkh
hBBCSKih5iSEEEIIIaGGmpMQQgghhIQaak5CCCGEEBJqqDkJIYQQQkiooeYk
hBBCCCGhhpqTEEIIIYSEGmpOQgghhBASaqg5CSGEEEJIqKHmJIQQQgghoYaa
kxBCCCGEhBpqTkIIIYQQEmqoOQkhhBBCSKih5iSEEEIIIaGGmpMQQgghhIQa
ak5CCCGEEBJqqDkJIYQQQkiooeYkhBBCCCGhwtaVXq8PD4sfYeT4SWjaraej
OX0+H7w+S48SQgghhBBSPiwtqbLy4aNHmL9mHboMGY6dh+OcT2nvJIQQQggh
5SVYS/pQXFKCJZu2oNvQEdh+8JAz325/TgghhBBCyMvi83ldutOHEk8plmzc
jK5DhmN77CGAmpMQQgghhLwiluYM6M5SjwdLN211aU7nm68ngYQQQgghpBJg
rRGydadqzuWbt1lz647m5PohQgghhBDyijia0wuPx1tGc/q4fogQQgghhLwy
Rm/6dSc1JyGEEEIICQWqNUHNSQghhBBCQog9r07NSQghhBBCQgXtnIQQQggh
JNQ8z87JNeuEEEIIIeRVceyc8nhccxJCCCGEEPLqPNvOSQghhBBCyKtDOych
hBBCCAk1tHMSQgghhJBQQzsnIYQQQggJNbRzEkIIIYSQUGPrTX1WKppzZ1wC
mnTqitnzF4KxkgghhBBCSEUQrDk9yL16DQNHjMbsBYv8n1FzEkIIIYSQV6Os
5rx66zaGjhmPOQsWw+uTT7xe4+upD0IIIYQQQspDWc1ZIJpzyOhxmDV/kehM
r19rUm8SQgghhJDy8yTNOXTMBMxesNjMq3tFd3q91JyEEEIIIaT8lNWc+Tdv
YYjOrS+0NCfn1QkhhBBCyKvjK+PPKZozRjXnEnDdOiGEEEIIqSh8fm2pmvOa
zq3HTHA0J9etE0IIIYSQioCakxBCCCGEhBpqTkIIIYQQEmqoOQkhhBBCSKih
5iSEEEIIIaGGmpMQQgghhIQaak5CCCGEEBJqqDkJIYQQQkiooeYkhBBCCCGh
hpqTEEIIIYSEGmpOQgghhBASaqg5CSGEEEJIqKHmJIQQQgghoYaakxBCCCGE
hBpqTkIIIYQQEmqoOQkhhBBCSKih5iSEEEIIIaHE1pten2pOr2jOOxg2diLm
LloKn7xnPwghhBBCCCkvojZR4imFx+s1ulPtnEPGjMfsBYstvan/fF7qTkII
IYQQUm5Uc5Z6PUZTFt5/gEsFBRg8ehxmzV9oaU3Q1kkIIYQQQl6VgJbMOHMW
py/kYNT4yZg9f5Hfm9P6nJqTEEIIIYS8CrYdc/vhOKSfzsL4KdON5oTf15MQ
QgghhJDyY2lNr9+Xc8vBQ8jIysK4KdMwc96Cx75LCCGEEELIy+L21dR/aufM
PHsW4yaL5pw7P+ib1JyEEEIIIeRVUc25TTXnmbNmbj1g52SMTkIIIYQQUjFQ
cxJCCCGEkFBDzUkIIYQQQkINNSchhBBCCAk11JyEEEIIISTUUHMSQgghhJBQ
Q81JCCGEEEJCDTUnIYQQQggJNdSchBBCCCEk1FBzEkIIIYSQUEPNSQghhBBC
Qg01JyGEEEIICTXUnIQQQgghJNRQcxJCCCGEkFBDzUkIIYQQQkINNSchhBBC
CAk11JyEEEIIISTUUHMSQgghhJBQQ81JCCGEEEJCDTUnIYQQQggJNdSchBBC
CCEk1FBzEkIIIYSQUEPNSQghhBBCQg01JyGEEEIICTXUnIQQQgghJNRQcxJC
CCGEkFBDzUkIIYQQQkINNSchhBBCCAk11JyEEEIIISTUPFlzUm8SQgghhJCK
g5qTEEIIIYSEGmpOQgghhBASaqg5CSGEEEJIqKHmJIQQQgghoYaakxBCCCFP
o9TjeeVjqKbwen1w/vmoMaomlubMEM25bP1GrN++018evOYzQgghhFQ9VBd6
5eHxelEiulNfl9ceJUcKaE7RF9ScVRdbc+5OSMTBlDRqTkIIIaSK4/PrTX3c
f1iMywXXUFzyqJzH8uLegwfIvVbgHJNUTey59f1HUhB3NN1v+bY1J3UnIYQQ
UtVQG6etO/fHJyE6Zhxyci+V71hyjEsFBRg5ZTou5ufjUUkJ1UUVxdacB1PT
kJCZ6bJ9e+nXSQghhFRBSvx+nHfv30fTjl3xXbMWyBKt8LLz4vp91ZjXb99G
ZNRQRI8dhzjRGw+Li0ORbPKGY82tnzGaMzHzmDFt+ny2jy81JyGEEFLV0LVD
JaWl2HogFrW+a44TWVko9ZbiZXWBaokHD4vh8XjNMf/jF79CjSYtkJefH5qE
kzcay84Z0Jz2ujJCCCGEVE1UK57JuYjazVph4sIluHnnzmPa4EkmzyepBz3W
w2LLF/Sdjz7FP//0X3HmzFmzrohULR6bW+eaMkIIIaTKEJjbhBPL6FZhIQaO
m4Cf/uu/Iy3zGB4+ehT0HV0TdCH3EjKPnUB6eobzOJqRgTPnzpl1R/Z3rb/W
uqE+Q0fg33/+K+zedwBF9x5Qd1Yx3HPrtj8nY3QSQgghlR/VkaVerxOHU3v+
4pJiLN++Ez/+55/if//vH+Fibq75TNcC2bpz16E4fNeuE372y9/gH//pn/GT
n/4rfvIv/4p//PFP8MGnn2F3XEJQbE9bcz4Q7VqzcXN82aAJTp89Z85NO1fV
gZqTEEIIIdrr6zr1wqJ7qN+mI370o783uvNcdrYVq9Mj+rTUa/w823foiH/4
xx/jt7/7/1G9QWO0CotAzUZN8evf/Bf+9Wc/x9e16iArJ8doTSs+p/VXNWb3
gUPxq//6PTbt2IVCtXX64zPa+oNUXqg5CSGEkKpMIEai/i24ccPYN/XRqldv
3Lh9K/C5+nnmXkLDps3x03/7GabNnCU61WP88lQ7XriSh/6jx+AXv/lvdO8X
5TqDZed8JHo17fQZ/O4Pf8RXDZvieFaW+R3jglcNqDkJIYSQqo1qyRJPqdGG
t27dwo/+/u+N5owYPRa37tw139G15/q9ogcPMGfVGgyYMAUJ6ZnOMdSWeauo
CAtXrMTPfvlr9Bkxxon/bts61U6ad+063v/4M7z3ZQ2kZR4P8hOl7qzcUHMS
QgghVRPbn1P1pP06L/+qY+dMSM/Ao9KSwPct9SjvPTL7EqnPpu3nqX9PnM9G
l34D8B+/+jV6RkX7f+N17JzKvfsP8ee3/oKf//q/sGnHbtGwD117a1J7VGao
OQkhhJCqii9ID6puvH79uqM5k4+fwMPikqC4SKWlHly6VoCF6zeiRsPG+M1v
fovf/va/5e9/4ee/+KXxAf33X/wK4UOGWbZRl0+n2jm9Pg/eevsvxl90wcpV
uF1Y5NetnF+vrKgvsI4rdsTFI/MsNSchhBBS1TD7Wzq60Or3dW797/7hH4zm
zDh1qsz6c0s79B84CL/4z1/jn37yz/jbH/0d/vZv/86sC6rdsh2+adQE//bz
X6HX4OGu/bTt81nP333vffObhaI57967x9jglRSPL3BXtdxsO0Q7JyGEEFIV
sefE9Z/HrwdVc6oeVM2ZXkZz6vr1vOs30LRlK6M16zRugtnLlmPV5i3Yc+iw
aNQzmDRrNn72q18jfOgI89sgzel//s4775pzzFm6DLeLCs37uhbJy7hJlQr1
5/U6Pr0+7IxPwLFzZ6k5CSGEkCqGajxbF9q2RrOG6Ed/j7//h3/Chr378eDR
Q/Nd+/Opc+fjd396C9169DRrgG7euYu79+7jQXExMk6fQcsuPczcesTQ4eb4
Xl9gHZH+r2uQ3vnre/jd2+9g14FYPHxUbL7jYazOSoelKAO+FYvXb0J8Who1
JyGEEFLFMDPfjia07FK2nVN1Z9+Y8bh1967/c0s7RA6Oxn/852/Rd0g0LuZf
dfYxun7nDqYvXIxfqF+nfD4gZoI5nr12Xe2o6td3IvsC/vDHP+OTmrWRKprV
o5rXtRcSqTwY3w2fNZ559KgEIyZMwbY9e6k5CSGEkCpJoL9XjXBbtOOvf/9n
49P57mdfIv/qNWOvtPXB7oOHUe3rb/HOBx+he98BGDN1JkZOnIKu4X3w0edf
GV9Ojd3ZqGUb3Lxb6Mytloi2LCnxYObKNfj5r36NcdNnIP/6jaBjk8qFez91
3Uug35BhWLd5CzUnIYQQQsxe6l0HDsY//tOP8eOf/BSXLl92YhnpX51H79i1
O378L/8H//7LX+M3f/gzfvlfv8fHX36DwWPGonf/gWaPonc//hSHjqb7ffos
v1HVnC269sRfRcvGJh4x+7grgbVG1B6VCbcvr/pwREYNxdqNm6g5CSGEEGK0
wcGUVPyH6Ml/+MefIOdiLpyo7f54Rhu3bUezDp2NdvzT+x/j2/qNMHXefFy8
ehXHTp7CgOhhGDZ+IuIyMo0dU7WmciEvH2+9+wF6DI7GudxL/nl3n3Nszq9X
Lqg5CSGEEPI0zF5D9++j/7AR+NkvfoXYI8koLrHiwtvrfG4XFeHIsWNYt30n
lq/fjH1xibhy/Yb5/JF898qNm0Z/Xrt9W35b6sScHzZhCv7lp/+GLXv24t7D
B0H2TerNygc1JyGEEEKehcfrQ07+VTTv3AWDJ0xGwc2b5n2vf88ir39/dXvt
j71WSB/W3kSWjtDXqldtzfmnd9438/DnsrOt3wfNqVN3VDaoOQkhhBDyLIz/
pWjJwxkZqFajDiZOnWr2J1KMf6aJ6+nzx9P0ObGObM0JBO+f/uhRKfbHJeKv
H3+GoTFjcfPWbf/aISCgNak7KxvUnIQQQgh5Nj7/HjI+tGjbHm9/9Ckyj58I
/kZQfCOfP768r8xRrPc13lLLsD6YNG8R7hQWcR69ivC6NKf7iO4ySgghhJA3
C90TXdH+OvXUaUxZuAR5V6+V61iqNfKuX8fEuYtQeP++EzuJVH5ej+YMjH8C
tvjgtBBCCCHkzaDUH6ddY7jrP/XJLM++lPqT0lLrWPrX6/9LM2fV4HXOrdt7
bAXSwkJHCCGEvIm47ZFGe76CUCwtDcSFZ89fdXh9mtNam6bxt2hXJ4QQQt5s
TFwk1+vyxmxXqWqvW2f/X7V4bf6cUugeFhfj1p27gbLnY9kjhBBC3kRUL7g1
YnnsnLbetLWH+zmp/LwOzWn8OKScpR47gSmLlzjlluWOEEIIeXMJ0oqvIAvs
47Dfr1q8Tn/O3Xv3o3WHzk9MCyGEEEIIqTy8Ds3p9e9REBsXj7B+A+jPQQgh
hBBSyXldsZIuXbuGwTHjULduPTO3XlJSSjsnIYQQQkgl5XXNredcyUe/4SNR
r159f7wurl8nhBBCCKmsvC7NeTH/KgaMHC2as4GVDp+Pdk5CCCGEkErK69Kc
uVevYeCoMahTpy5jwRNCCCGEVHJelz9nzpUrxs7ZoGEj6+g+L7UnIYQQQkgl
5Wma80BKCuIzMqzv+Hzl2lf1Wejcuto569at708H59YJIYQQQiorT9acm3Ew
NRUJGZnmfbMvuteD8uxx9TROX8hBt/4D0bBxE7OGyOul5iSEEEIIqaw8UXNu
2ITYlFTEp2dYa3vUzukt376qTzvr4eQU1GvbEb0GDPLvS1SxmpYQQgghhLw5
PE1zHhBNGHc0oDnLs6/qs9gdexA1W7TFhHkLjB21oufuCSGEEELIm8OTNOfq
9RuRdOw4kk+cxKOSEmPjrEjNqYfatf8g6rTpiGlLV5g9iQghhBBCSOXlaZoz
r+A6svOuoOj+A+NrWZF2SNWvqjlrt+qAyYuWWr6ctHMSQgghhFRanraGSG2P
t4uKcPfefVR0rCQ91q4DsajTugOmL1tJzUkIIYQQUsl5LZrT2DljUbdNJ8xa
uQYeD+fWCSGEEEIqM69Xc3Y0mjPgL0pbJyGEEEJIZeR1aE493s79+9GoY1es
3L4LD4sf+fchor2TEEIIIaQy8ro05/Y9e9E2LAIJmcdx5caNEJyDEEIIIYS8
KVia09J6paIzIwcNMfE5Q6s5ga07d6NzeCTO5F7C+bw82jgJIYQQQioxVrx3
a15bn/cZEIXV6zaE3M65ddcudOzVBycu5CDn6jV4OLdOCCGEEFKp0TU8unb8
4aMS9FE75/cQK2nz9h3o1CsC5y/nGVun9T41JyGEEEJIZUS1ph0aU5/3jYoO
uebUY2/fux89B0XjePYF5F4rMO9z/0tCCCGEkMqJrTlVU14W7dc1om/INadq
y807dqFTeKSZWz+RnY3bhYXYfOhwhZ2DEEIIIYS8WeictmrP2NSj6NBnALbu
3hvyNURbRHO2694Lx85nIzsvD3lXr6FfzIQKPQchhBBCCHkzsNSk1/KxjD2E
8JExiE1KDnlMeNWcuobo7OXLyLqYiw37DlBzEkIIIYRUUtyxkjYeiEXEqLE4
eCS0mtNat77bzK3r+qHTojnXi+bsPXKsX/96XWkD92InhBBCCPmB414rbmnO
GBwMsZ1T0ficnXpF4uylPJy5eMnYOSNHjy2TLp/zjxBCCCGE/HB5XZpzm2rO
nn1wNvcysnJysWLHTrQN74vikpKgdHkZt5MQQggh5AfPa9Ocu/YYO6f6cp6+
kINFG7egfusOyL95Cx6fr8y8Ou2chBBCCCE/ZF6X5ty+ey+69u6PrNxLOHbu
POat24B6rTua1xpLSe2bsM9Mf05CCCGEkB80r9PO2Tmir9GYx89fwNy1G9Cg
bSecyrloPtfz2+mj5iSEEEII+WHzZM15BCWlpTiZfUEe2VY0pQrUfXqoLTv8
69YvXcIJ0ZyzVq1F/TYdcfqipTkDdk76chJCCCGE/NB5mub0eDzYcfAwtuw7
YPRfqbfi7I16mG279qJrn/5+zZn9mOYsGy+JEEIIIYT8cHna3Lp+snHXHqzc
vNVoTZ3rrkhb5zYTn7MPjmadwc74RGdunZqTEEIIIaTy8TQ7p9mXaM8+rNm2
w/89VJjm1MNs3rYTHXqE42BKGobPnINJS5ajPjUnIYQQQkil5EmaMzbxiLFt
quZcvXWH0YgVuYzH7H25fRe69e6Hg8mpaN93ILoPGYb6bTpQcxJCCCGE/ODx
uR72Oz4nBuam2IMIHzkG++MT4fV6sWn3Pqzaut187vVW8D5EO3aha0QkYo8k
o27bTvi8QRM0bNf5jdScxsbrDcQL5Tp6QgghhJCnY+9l7tZxqp48Hise5uaD
h9BrxBgcSEgynxg757btIdl7UuNzduszANsPxqF26474rN53qN2izRupOdWn
4GFJCR7Jw+Pxmpj1hBBCCCHkyRj95g3WcdaeP5b9bs2uPYgcOxFxaWkIpeZU
7bZm0xZ0ieiL/UlH0KhTD1Sr2xjf1G/yRmpO5d6DB8g8nYXSUs/rTgohhBBC
yBvNk+yczmciK1VzRoweh0MpKQil5ryYfxWjps1E+IAoJKSkoUazVviyYTPU
bNrqjdScumb/+Jmz6DFgiHn9JqSJEEIIIeRNx609PV4PSj1elJR6MWnBEnQf
OgIJR9MRSs2p8TiHzZiNyfMXIT4xEW99+CnqtO6Ir+s1fiM1552ie1i8dj3e
//BjyxfB+/rTRAghhBDypmPrTV0Xc/lqgZnrvl9cjK7hkZgwZx6u3LiOUGrO
rJyLGD59NsZMm4n4pCS89VE11GrRFl/UbvjGaU71ObhTeA+rNm8xmrOEc+uE
EEIIIS+ErTd1b6FxCxaL7ryGkhIPevYdhKVr16Pw/j2EUnOeupCDYdNnIWbG
bCQcOYJ6zVpix8FDb6yds/D+A6zesg3vfvSp2TeJEEIIIYQ8zpPmg0tLvXhU
WorIETE4dTYb9x8Wo1tEXyxZvRZF9++b76/dvgsrNm01R/D5Km7vy9M5FzF6
9nxMnLsQJ86dN/pzf+IR1GjUDDn5V53vaRpe7Iw+v+3WimNUkevK9XgnJY0d
+kUZv4P5GzdX2LHJq/OksUn6mTO4kJ9v7PfO54xxRQghhHwvPEl36nufVvsC
CckpeFj8CN1Fcy5btwH3Hj40n2/eewBrRHdWNOrPOXjydMRMn40HxcW4UnAd
p8+cxQfVvsJOE6cpgMYmKn2G9iz1eFDiKXWuKBRxnTJOnkKrnn2wcttO1G/R
tsKPT8qPxvhSjG+yx3r+p7feRtTEKbh+65Z5j1qTEEII+X4wetMXvF69RLSa
xuP8onZ9s3Zc7ZxdevbG4lVrUPTggfnVpj17TUz4iub0hRyMmjUXE+csMJpB
03L91k2MmjkHnfsNDE67D89UkXa8+ryCG5g6dz46demKqzdvVWh604+fQLMu
PbB+917U+q658UMgbwZe1zhKy8IDKce1m7dBn7ETcOX6DVO+rHJP3UkIIYR8
H/j888822hfPWrMW1Wo3wOHkFDzw2zmXr9sg+vOhsYnOW7ocE2bMEQ0qr0UX
VpQNUTXniFlzMG72PGOjVFvl7cJCzFq9Di3DIp6Y9mdfmReXCwowbNwEfF29
BrKvXKmQdNqkHzsumrM7NogG/+Sbmjh/Oa9Cj0/Kj8brL9ZY/X5bpj7vET0S
XQYPR/51ay2c+Z6Xc+uEEELI90VgHtLa63LWmnWo07o9pq9YhfwbN0VzRmKp
vHdPNKb2z9PnzMfQ0WNxu6jI+W1FoP6cI2bOwVh5eP1+drcLi4zmbNE9wtEG
ttb0PePc+nt9HD11Gs06dRXNWRMXr16rsLQqRzOPo2nnHlixfQe+qNMAh9Iz
KvT4pHzY/iJq69QycFfK6ZgZczF24RJ827g5cnIvw5aZlJuEEELI90fAzmP9
nb5itWi/2eg7bpKxPXYL7yOac73RnMqMOfMxeNQY3CosrFA/yayLuRgpenPM
9Fl++6sPd0QvzF67Hs269nTSqf4A3ues/bDUsw97D8ejRrPWqNuyLeavWlth
adWjp2VmonGHzli3dz8GjZ+EDr36VODxyatg1gbJP/XPyLl8Be998Q1OnDuH
D+XveSnTNl5fKDx9CSGEEPI8jB1z5WrMXLsO4aPG4uS5bHTvHZhbV2bOWyCa
MwY3796t0HNnXbyIETNmI2b6TNiq8XZRIeat34SWPSIcHep9obXy1nd3Hzxs
9tBs13cgBsVMqLC06trn3bGxqF6/ERKPncC6PfvwWfW6FXZ88upoOblf/BCL
NmzGb//4Nm7fuYtq39bG+ewcl50zNOvLSFXEBzhzMIHnhBBCgrH1nLaVc0Vf
zlizDj2Hj8ap8+cRFjlANOfGxzTnjQrWnKdzcjB85myMmznHee920V3MkfTo
+nDjd+oL9j99HntEc37XtSc6R0UjatykCkvrrbuFWLx+I5q274T8Gzew7VAc
vhL9Sd4MTGwsj9fE9xo0eRrqtGyLO3eL8GWt+sh22Tl9oDYgFYU/NpszB8Oy
RQghbgI+koE1vLNWr8Uc0VPhI8fgxNlz6NGnn4kJb61bD53mNHZOM7c+23lP
7Zw6t25rTt8Lak5r3boXuw4cEs0Zho6DhmLw+MkVltbrt+9gvqSrY0Sk0eJ7
E46gWq16FXZ88mqYUuL14baU0UYdu6LXyBgU3ruPllIWcvPyXLZNagJScXj9
8TLs9oflixBCAgRrTitWUvjQEZi8bIVozhjsjk9Eu+69THzOUGvOjKwzGDhh
CsbPnu/4a6o/p86tl1dz7tgXi0ade6DjwCGIGjexwtKqfgWLRJe3CwtHSUkp
Tp49jy/q0M75JqFl4PKVfPzpvY8xe816E/N1zJx5KLh5k3GSSIVi2zZNDDf/
+sVSxoAlhJAnYvlJWvFlqjdsiujps9BtiGjPpSvQvnc/bN93wPgwKqHSnLsO
HETY4GjsPhzvWrdeiDkuO+eLzq2bWS357rbde83a8gGiN8OjoissrTfu3MFC
0ZwdwiPNefKvFaBuq/YVdnzy6ujadbVp/v6tvyJdxjMer8f4Kl+/fZt2TlKh
BM+nW/EQGIeLEEKCcccf0n19Sko9+LxGXcTMXYAWPSIwaNJUMy+ZlJ7p9NOh
0pyr1m1AWL+BuHrrlrO245acQ2M3lcvOKY8de/ejz9ARWLlpKzr0eDzGZ3lR
zblA0tsxvK/pX27euoM+I8dU2PHJq6GlROMbXL1egD+/9xHyrl83a4omLl6K
a2rn9FFzkorF9olXdL7o2s1bOJd76TWnihBC3gyssbi977TXxM9WO2e16rWx
ed9+1GrcDP1ixqHXiBgkpmc4/bTRnKMD69afNZR/fJzvc30W/NvV6zehV//B
yL9xyx9b0YuiB/exfu9+1GvVDnfvFcFb6n2hdcZ2+7/3UBzGzpiDxOQUdK7A
WEbqzzlvzVozt67ovO3Ww3HPvN5QE5jfk/GDjB0ePnokY4jSwLiiCtlc9N4X
y/UnZmTi429r4k7RPVPGdyck4vqt2zK+qri9DMjLEVwOK8c9cOqe/NN1a0lH
0zFu+kzEzJ5n9r0q+93Kct2EEPKiaNPncTSn1WY+Eo1SrUYdXMi5iLoNv0Pv
kaMRNmwUEtLSnRhFM+fOxxA7PqffZ/5peDzBn7n96Oy5J9sPao1ozp79opAn
bbRtp9K9iE6eOYd3P/0CJ3NyjO/ki11bwM45bNwkJKakoEtEZLny6UlYds71
6BBu6Vj1O0g/ew637hYF6eiKjJn/bKz8smKh+0RX3cHR01m4mJ/vxKAs9QTu
dWXv8/QadVwwZv5CNO3W02hwu6wV3LwterykSmnwNwV7PsXm+6sfocfESpCx
zMnz2eg1dBj+/MHHaBnWGyt37DafW+2kz9RRjncIIVURd9tXWmppls9Fc2aL
5mzUojUiR49F7zHjcSTjmBNLacaceYgcHI3cq1eNPfJF+m57Ptw+n85v3ikq
NH2O16+T1M7Zo98gXLpW4PxGP8u/eg0ffV0LJy5cCDrX89tt0Zz7RHOOn4yE
5OQKtnPextzVaue05uu1r9F9jpJOnAzYju3+5XvSNvb5NC9PnDuPsQsWYXfi
Eedzex9Iq8+rPH39k9ByVXDrNvrKve8dM94fO8nKnzuFRTJGKLXs7Ixn872i
98Ueh1oarfKss9F6r+UqIT0TvUbHoOeIMegh4/WBYyeYsqZ+S3abxjJHCKmq
2PpD4xnevXcPH39VHefOX0Cztp3QMXIABki/nXbylF8f+rB09Tp0iOyPbQcP
mzb2+cf3+e0ZgXZ25tLl2B570MxJW1rWi9UbNiGsfxRyrwX2qDTrc0TLfVq9
LjJFR71M/6TH1VhJo6fMQHxSMjp0D3/xTHkON+7cNf6c7cN62ZHqzVz2qt17
UOIpCUrD96XvvP4+XO1I8Slp6DZoKNbv2Res06tAV2fs96Jrbso9Gjp9FiLH
TZC88ZjPHhY/wvFz2U6s2cDaDxJqtO0ouvcAl/Ovmj3NvPb+pN4f/vjHLkfa
zsVJ3YsYGYOpy1ZiyMQpqNOoqX+uwbpObxUY8xFCyNOw28CSEg/W7TuAz2rW
w4WLuWgqmvOP73+ClZu2oPD+A8cmFJ+egb5jJ2Lhmg0vdZ7APuk+tGrVGhOn
TjMa16heScPKtRuNnfOi9EluVHNWq1kfR8+cdfTB89ttS3+lHD+J1Tt243DC
EXTuWXF2Tism/Ca07hJm7IeaKr2Wlr0i5e/9792Kof257augemrVxi340wef
omXHrnLv7pvvWFrM67K1VF40/wtu38aQaTNNzC+f/x5pHkRNnIqLeVdedxKr
HDq+PJB0BC1l7Bebmva6kxMCfGbfq4XLV6B52w64JGPnlKPpqFGvAR76Y35U
9npHCCHPI7COCJi2cjU69B+Mi1fy0axdR3zwdQ3s2B8rOuaRMyeUcuIkBk+Z
joVr15s55Wdh1pqX0YaqgVq1aYexk6cae6GNrlvvHtkflwoKgn5/SdLy4Vc1
kC6a07ZXvWjbrT595y5fRmJKGrr26f9Cv3kRrt64gZnLV6J7/0HOe0VF9/D7
t9+VvLvi2G+MzitjS1Pd5wlB36O+r7pmqPDBAxNP9Y/vfYx6LdrgyIlTRm9V
LfuK+rTewoAJU9BnzHhnHld9WvvHTEB27iWTFx7GUPzeuCRjyW5RQ/Efv/w1
OkQOfGLb8EPFXrOounrl+o2IGDDY+BDrNU9bvsqJt1FZrpcQ8mJ4/WtLtP/V
NsHer6yqonNB9rqcR49KMVU0Z7foEbh6/QYmL1mGzoOGIvX4CeOL5O6fFy1d
gV4DopBv4mu/hD+n/H7zocOIGD0OnQcPw/7EZGcN0qp16xExMAo37xb6743F
FWm33//8K5y6cNG/Jtv7gnPEojvu3BbNmYf45FT0kmux2/1XveeHE5JQt2U7
Yxf2+Nfm3BetV6N5a/Ne8SPLrmHnmcc1730i+wLOXbpcoVrHHadF7axL123E
57Ubor307eMXLHY0blWxs1hjlTxUq10fczZsMuXXfr9G/cY4fCTZrJer6tj2
cfvxJMpbV6w21v6tD1nnz6O5xl+bOAWffls7aC3RDx27/sUdPWraz6mLl5k6
r/GSVu/eiyL/3Idd5p6Vp/b6Saev4pjoidhlK9CeB9rZF11nQMj3R2B/cVsz
VGWMjpN6O2vtemPnvHTlGhKPncCoOfNx4tw5Z8269kvFxSVYtHw1oseMd/Ym
ehFsvbM/JQ3Ld+5GH9GdO/YfNO/psXceOIhpi5b6v+0LrCG6dtXMrSefOu3Y
C9Re9Sz9ZPtXXb1x02jV87mXsGTTlvJmz2MkpR5Fh979EX/suNG/mn+FRUX4
tE4DHJDru3f/YbAfgN+fVe2uEf0HonfUEFy4cqVC1696/GsYbhUWYdHqdWjc
pgNmr1iFxi3bmvPb97iqaK1c0fUffVXdxEFQ7D6qQfM2ojlTcO/hQ7+dvmr2
TVoO1Dbuc7WF7rhaTkyLcmlO264XiIN69sIFdB04FKtEgw2fNQf3i4stXVoJ
tKedhwlHM9B/4lSs3mmtVdf8vS1jaN3bwqxb8+dlQIs/G2rOZ+Mum2XXAzLv
yJuAvc6ibIy4qmzrdNMzeiS6y0PnjovuP8C4eQuRmXUagVbVyrclomU6RfTF
sfPZzz2mt0zfNX/dBsyWR59RY7Ft3wHne3sOxWPWkhWP/d5aQ1QHx15yDZGe
8erNmzidk2t8+xJEH1YUOlffJjzSaE5Fr/He/fuoVr8Jxi9ZZnwqLRtnID6U
9vE5+VfRs98AhPUfhJPZOc+MM1UezN5Non2XrN2ADmER2L7/ABq1aBP8nSpQ
1lVjX8i5hE+/qYW7Uo7Vhu/zx+VRO2d8corxsaMtpGzf7BqLv7IWDNadx06e
Qq0mLRGblm7qgWrOyoTm4cGUVETIWHzFth3Q6y/1lOJu0T1T/myeV//sfXtZ
Np+Os+7V+Av537NjE4vO93hdY6kqOqYkbw5aJo+IVli9c5fpd/R1VcReU6LY
fz/5pqZ/Lt2KJX7nbpGJPelz+g8rVnuq9B/R02diwdr1z6zTZW2R+t2wyP6I
njwV4cNHY+ue/fDvVIldBw9jumPnDJB/zVq3rvYR9zpXe+3Ok9C2SB+qNc9e
umTsixrHqKJIUM3ZK1KOecJ5T31N8/IL8OGX32KT8YG11uTb8+v6WLByNSLH
jMUY0fIHU0KzjkLXMi1ctQYtOnTB5j170bB5Kyt9/nyrDHal52Hm1i/n4fOa
9ZF37brTf2uZ6DV0JPqNm4jsy5fMHGZV79u1fGZfvoLMs+etOBJ+X5BXwa1j
7bJ/TOpfo5btzL4TdwoL0bxrz0rT9trXeyg5FeEyll62ZbuJnaBjyty8fIyc
Nsu0qTrufFH/FjueB/Xn4zj2Ylfsg+QTp9CoeXP87g9/wJq1a5097yt6XE/I
y6BlU+13cxcvRtceYc561qqKXr/6HsZnHkPa6TP4rFYDnDh7DiWewLhc2057
jw07t1Rz9h4Vg3Ez5jz/HC5fTv3Xo09/9B09zqztUJ3p8bcLOrc+dcEi5xy2
jeTWnTvoOni4mZfzSB+l9/BF1n5of3a54DqyLubi2q1bOJyR+UR/zvLY/dRO
1rJHuLFzWvOT1jG1Pw2LHokO/Qah4MbNxzRNzORpGC1afej4SZi7ZHkFzv0E
5pU0Nmf/sRPRX+7P3kOHUfe7ZkHrliq7ndMeS13MzcVfP/zU+Bx7/WMQzaGZ
K9egY//BOCX5VJXRPNI5Xq17m3fuRv8x48w+Aoodz7S8BNqKgK0zUzRnwxZt
zevbd27jD395X3TuuReKt/ZDYf2WbWjbsw8OHU139PQZucZPvvzaHxP2+Xlq
z8V5fbTTPQ/NGd1nVPO1Z9+B6DtiFCbMX4j56zfidM5F5hx57WiV172Xh46J
QZt27f3z7FV7X4h7osGHig7qKHX2L598geNnzgbZH4L31bFi0J25eBG9h0Qj
LLz3c9tROz6PWScsv+0W0Q9R4yej++Bh2LRzj3P8XbGHMG3hkjJ9lReF9+5j
zroNqN+uk/SRlk/U89YRaZouXytAysnTyL9xwzz2Jada2sv36pozQY7VOqw3
joj2Dt5XxYdE0aGffFvL2Nl8sLW2Nb8+eNhIzJQ2cdLsuZgxf1GFjcHdfVNs
QhK6DBpqfMqOnTqNHgOHWP64VciHRMvGRRlr/OW9j3D73j2njuu/xaIL1BZ1
5kLO607ma0PLnT3WuyP5M3n2PBlv1jf1T2OYOvHaURFto9pNPTgr92OijCm1
/t0tLMSXDb4zMSwfVKI59hWr16J7775mPwKvf63ACdHa//nb/8beIynmO89b
wxjY28Fr9mh1j/9JALtcev1jyY49wrF1915ck7yfOHcBtvjnxbhe403D37/7
7L0Idf6p8o6ttC09nJqGrtInT5B21t6HrKr0xWUp9ZbidHa2mQ8+lJyC5Zu2
mD12nmZ/M32V5Jn6K+6Ji8eyDZsCn5Xx2XbaBCcevM/M+7bp3A0rZBw6cOQY
Ewfe/mzngVhMFT0G1xH0ce/BAyzYuAUNO3R11rOXeu15/uCS6nWtg9C14cmi
CUtKSyS9D3A295I8LgeV7fLuQxOXlIwufQb4Y3EG6oumSfvQ6o2bGc3pvhbN
u2Ex47Fs9TrMWbICg8dPctav23HMje2p3HPf1rXrHvNdo6KxKzERWecvYEDM
BOcbnjJ7DVra3YebogEuXMk398e9juRVY6bbv98h9/ZQ0hF/zIinH8+e07XH
PM/yn3j6Oa1yerXgOjpFDjA+dY7/l1z/XLNOLgoZp7Ne6zp+556XyV/3NYeq
HXbvD74z9iBmiNZUG3y3vgNMbLGydspnHcdOafBetna9suuFz4z71u3db9mm
ZOy4PyERn1WvbfSnz/W9MmcIHKPMfH2oKXtffE85t9d1zUuWrUBY70i/X43l
h3T7zl3MXrQE9Zo0N22Zx7UPUdnrtY5j1ckt23fiu2Yt0WfgIKSfORP4jqu9
eVUfiFfDV+Zhv1umPHuCPwtuL8vX/jo+S64x0TZpYy5cyjP5O1vGMr2GjJA2
J9kpi7afcijm2p01eO58eEI5sffgLc/x7WNWJm1m6wkzPqtE++C60bul87ka
A2jmqrWmz7fGQZXnPr4oesV37hWZPvir+t+h+NEj3Lx795k+Vs5+G161deYi
Nu2oWbvu7musOTuP01e5/b11Dr9Nzwjsj4tD9OixWLF2ndNuqJ1zyvzFQeNS
PV7R/fuYv3Ez6rXtbPSju0/zufo6u2ba+z+eyc1F0vGT1ny8lGe9ttTTp4M0
XXnHGqo5u/cd9NhxzN5+kpaug4bg6vXrePSoxBX/1IeVW7bioPx2qeR5f9Gf
aZIeuw12YgO8Qj+ix9gXl4CwoSOxPT4Bp86dQ58RY4L66mLjn2vHTrLeX7B6
DVq074iDhw+78tOOpVPe+mFdl9pphgwfiX7Rw8x+qc+zT1vXEegjyoPZV/3W
TROfE/7+qdSUA5+ZP671XTMckDGTlRevD7sulX1PceqRa661otHjJ2VkIuFo
uvFt0f3BF63bUGYN0bPP69aa9jyIrSU8xk7nMa/Ut3qH6Ew9ru4/cbfwHuq0
bGfistlxd1WXPnj40N8X+Zy9cZ2Y/vj++tyy/kT2ayc9jm639bAXW3btwbhp
swLrWOR9jdN1+nw23vm4molp4dg5HF3u0rN2nRFNvkmO1bJHL9Rt1UbGA1Od
z+HKide5X73bxmDbzeFPU9k2PKCNfa65Ra+jr1+e4D7gipSbkxdyzJhZz6/7
j4YNjsaSNWuddtXdX3gr3K4W0JxatrPzrgTpw0CMRl9Q+/riR7f7EG/QuWzK
c8zvD5+r3AZe2/YiO27y6yzLoUR9OecvlzFQ1FDsTkzCQdFMVdnHOC//Khq0
aoste/f724YX8+nXcnK7sAhJmcexW7SNXebt+TrTBvnc9cTyu1m0aYvxdUw8
ehSrtm7DoSMpTjubJW1GXOrRx+xses/mrN+A+m7N6eoLtH3XdUKncnIcO52e
/1zuZdF0WY4dQmMIpYjG87ra9/KONZ6mOa11k15sO3QYSzduQcHNW8715N+4
ifSsMyYmwPL1G0UXDsd+uX6vqw96tbJotfd7D8ehW1Q0th2Oxw3p5w8kHvH7
01v3tti/JsxGzxnWdyDCB0Zh58FDJk6/leRXs3Pa+XtQrlF9S5t37ipjjPVP
PZ47TZ4K0Jw6VknMOGZ0le23qDrmQfFD1G7QGDv37Zfnj157W+3WGzoecmy9
pV4zXvL5YzVWZDq9fg2rscTOXcrDnaJ7uHKtAFPmLkSXSMvW+SJ9gD0m8bh0
oVt3mvi/Rn95zXzzFqkXdt+r15Yg7W+Xbt1x4VIuZi5aYvZqHRYzDntk/Kl7
R9h6QS89VDaqZxNsf3Gv57HHC47mhrWGaMmGzYE+1Wfdx5t37iByxGh8W6ee
f02m1/mNx4n75h9ryPNjZ88hNiUV6dJ+Ld+0GbOWLg+yjVj5UP72qyKw7on1
/OSZs5gj/WpiZqa5Z6UuzWmvB7BRv1b3WKK8BMqCz9gyLkn5NeNKr8+0tZMX
LsFiGT+54/mVHRtVFPZ6eb22KzKGmijnjo4Zj/sP7rvsNP5yjJe/a6Zt8Mc1
s88X0HIB+/ibaDvzK0wEz1c8Xo8q61zzjbt3MWn2PERJ/c+6eBG7RHeWhmhf
mDcdvdfnRed98k0tox/Ne8+97/6y7i8nu/btQ8deEThz8ZJ/TjMw12HXaXu9
j342cMx4DJowBacvXECCtBPWGoISMx+t7cTVW7ceGwtqmzFbtErjzmF+f06r
DDvnkePOXb4CA8dOQMqxY04fqO32AWm37bp66epVLN2y1aVtgrXry/BUO6c/
7beLCtG0Q2fR1ulG4ym6lknXNGna9osO7DFkmFnH7h6zuvXHy2C3a8Ulj7Bm
8xa0D++DpOMnzLn1nNl5eY6tLOge+dPbvltPbNy+EzOXLEPckWT/d91loXzz
QXq+FVu3Y/66jegW0QdR0cOfEdPV5+gu2xZdrnkon+XDkXHmnPFVdOsC/avl
oUnr9pi8YBHypX94E8wDtj63taBit0uhsOvZGvZM7iWcV79jn2WT3LF3v9nr
YImMlzweO47+08/v2P5cmtjn+o091tFyqPGRdB2f1+cLqoN/fPsddOwehnc/
/Rzb9x1A+x7hGDRuIs7mXjTfU/uoxp0I2NLss4Qe+9rs87r1g+0raD9Xe2ba
qdPYFZ8YtAZIP9c2LvX4SXz0dQ2UuOcZ1Cbo9QSNO/W3Ww/EYrvobv2t+qWn
ncoycZFtnWXXzdcZf9I957V5x058/E0NDBo52sS9ddvu3W25Vb89Ljtx+c9v
61q9BzNXrMZ59ZvyWa8fPnqEzKyzZux/MvvCY3YM275WUVj2Fo/xqdD40zvk
3v3+L+9hf9IRM3/otsWU95ote6BVJ/dIGbt87Zozd/Mq9pNQE+ivrTKefekS
0k+dDhqX2t+sjJw4n42IIcMxZMQY0w+r5gzVXoRvOlpPLuXlo03P3qZN9L/7
vF8F2b72SNv4ZZ36GDBshOlTrG/Y7a3XaXPNHJPUjxbtO2HRmnW4VXgXF0UD
nhLNq3uX65yrxqt84I8T7W6j1F6la4gatOtsNCeccRMc+8pAGUN8UrMeVqzf
ZI6h7+uenbOXLHfGvifPnEGEaB73fp3u8dfL8DTNacVdt+p/G+k7e0dFI0f6
dUXjhKqu1rSo7+TQcZMwdvI085llG/A49+Vlx3z2PVH/0jm6f5RoTtXv6st4
5cZ17ExItNo8n89po9z3ZsDIMUhKO4rwyP5YumKVGa/b7aR9hS+PFZN08tyF
WCe6c9TYcaIneiHzzNmnfNvnxLh6lb5Ur0fjsi7btsP0PfaxbXu7lq/oCZMR
MWosTr1AfNlQErC5B+63+vzFH80w9aLUFWerQmcC/eVgv5TjOJ3r8dtJ0k+e
QrvwSHTqGf5C9z64D/X50//Q2HrUL1zbFb2fug7wVM5Fox+9ZWw0IyZMwnuf
f422PXrifE4OVklZaS3lZP/hw1J+SrB6w0ZMmjMXR0V36R5ldhn5PvD590fV
+VJNdqGMYUr88Y5se42dHo3/cfnadVy8ctWpa7Y9U23t9yVfYubMt2LF2vWv
jD1ff5eQmib5H4EZc+eb12qLVxux5mFgDGb//nX6I/scHaRtR4tOXfFt/e+w
eOUaJ0ZEie2X7W9L7GtWXsXO6W7HNG/DpU/PPHnapKXUb1fXcc6GnbuwZtv2
YN8F+/wVqNd9/vHites3jf+8rsvtL31is/Yd5b3rJo127Kzy7Ldrp1XbZdWb
dZq2wJCY8bgo48XSMsd7lbmp0BAoq5pHW/fsxYDRY5Hu9ytz+2dURnT80bHf
ICxatQaZp7Os+JK+QH9UldA6efLCBew+nFCmjD5l7rPMWFHR/YQXS15GDRuO
/sNHYdrM2UZfeH2BcY2i5WnuvPnoGzUEGSdOGt2n/YnOiV8uKDD2gYOpaUF6
w8zTmbbjkemDP6/TyK857U8t24zGIejRL0o0Z30MFh136vwF3BWdOn3+IgwV
LWWPxdMyMtCgRWszx26X7/L25C+iOfdK29AmrDdGjpuIM6JtloseTs04Ztqc
gtt3MHbaTAxR3ZN9AUlyfdY+JT6nL3s5rHqtcYHGyT3o1XeA8aPUdF3Oz0fU
2AlG7yp2/CY7nTqHeeBICvIlHxervXjIUOzcu8/Yvl9Fc+o5rt+5i179BmLJ
ipVy/RvQsF0nLFy5+qlXoLYizY+xok8nT52GwsLClz6vlqETomu7RvYL8qNw
67q4o+lo0bkb4pOOvPTxKxKn73Td76NZZzBi1lxMmjnH7KUUKs1ZKNpW4ycs
kvth21N1P4E9hw5h9rx5Zs2drZ2emv4g3eAzNq6t6tMoZXDqvAVYJe2r+mro
3L3a+c14tIytTseeuqYwVdoF1duqVyeL3tq0e6/x9x4dM1bSuAqL1m4wa5GN
xvue2mvbN/GCjM21DZowbbrU1XTj7xOw8Vq661BcHLZu3+7XpMEaR4+h9fuk
tE2jR8cgQ+6x+gnZqO1/687dWCjjvWXrNmLarNmIjY2F7f94XPqqNZu2mDbb
rdlfZ79lt6t3pMxoXKJ9CUmYu3gZZi1YjPWi81RvlvjnmDQ/tG6rz75+R32I
1b6ua1HLg8eOlyf/cq9eQ9MOXZAq98fWnGpL1fuyestWdOvTD2ul7dF9SG1/
h4rVN1bbovbMQ8lp+LpBEzm+BznS7k6eMhWTpkxDnjy39wgpj++lPcbaEXsY
7SIHYHD0cNRr2Q5zRd9f9dsx7EO+nOYMto+6/ZODvuHu+x3dHjw35z5G4JeB
91Rza6zkcdNn40sZm0xdtNR1XDj309mnuYyOfuoV+J70ecCmErhG19xe0FyL
+0qfepagv+65j7JlqWxalq5ei56Do83ajdi4ePQdOsLxJfAG5dXjeVp2LsD5
lnPNT8qjp/XZ7rkF9/189jV7n3rcwOdl0xJIUyBdes3ZubkYNXlqkO/Ns3yr
n1aWNe+Pn8pCSxnn/uxXv8En39QwNuTAfKHPjO3rNGqKzdJn2PuP6LE2yzh0
vrSzk6SPWSB/y/ps2em5c/cuPvqmpmnP3Xmi/1Zt24G24ZHoMXgYOooOXLdt
p/HhHjF5GoaL1rLTrZqzlqThjOlLA2vpy9pMAvehTFly5UFyeiYGjRkfWB/k
/64zB+d/vTsuAZ/XqI2wiEg0aN4am3fsMr9RnTdL6lyvqGhMlL65Y6/eSM44
BjvuhztNj/vxPHZnnLxIOX4c4dEjMGbqdGfuIlv6+oZtOyFa+rrTOTnW8Zyx
vtf47hX619OqHSpy8BA0adsBG+XeqBbec+iw8Ut4XH9a53yyPdSq1/GST03a
dzZaNu3UKbN31bBRYx6/An96dM/6viPGoEbDxvjDO+/jirGd2/6BZa/5STnh
M33gkg2b8PHnXwX57rs1592i+2jYpAX27j/w1Hx9Uvvrzu+y6Qhul8seyyob
Vrvqsm/602fHY9B0TpSx0vLNW/FlrXqIT0wKXP9T733g2p353Ce0+2XTrjqh
R/9BmDFnnsufyirfJ0UTDRg+UvrzAmcu4aZoxw1S19Zs2mz2eQ1ca+BcR2Xs
GDZwMMIGRKGPtLMtO3ZB5rnzpl/cK/o+0A8geDzg6Grrc62/E0R3fSZtyWyp
HzruXLlhMyb44wG72yL3Ma08DF6/4s4Hdxvuc+VF2XbHft+uh6MmTTX+1991
6Ize8jfrXLZrPkL60oLrZn15ZGRfZ849KNflcGor1fbro6++Qafekbh567bz
eeyRVNRr1gq/e/tdLJc+KrBXnpXK7aLjm8t4TcfXXl+gLAfPSwb3q49pgTJl
NbC28Wka7Ol1InBGn2jHy4gTDVn0wNKPmSdOoL6M7dUfwvqNdZ6rovkaSzvU
T/Kvu4wHwwcMkn7j1HP1UXB/FrhftkZZKnXluw5dkX7sBGwfEV2Tpnl08tw5
9B48FN/UrY8Y0X5J0h7Z/jbPo6zvbnBZR9D7mi7duyRMrqmnPzadnd73P/oU
46fPwjXjxxPQbE+rz3ab4H/l+G7oq8airXtL+3hd8nLeitWmPCalppZpgwM5
5U4/ytw591yk3cbYfvSOv4c/nz1eVz7Ya7+ctAb7YFm/s58HrlXbuK1796Nn
1FC0DYvA0HETg9orO29KnTkEX1A7GWTjd33frrvB7W9Av5pjekqde2evNXm8
JD9ZN7k/C1yzz7Evle373LZsPb+OFSfMnGPq7s49e9C+Sw8zPvEh4L/mjuVn
axK7XrrXSLtjZHiDruHxMvrYZ/7xvm3jKNvulr1eu88pcflY2XrM/RvbDy84
/4Lvje7/q2ubp0tfEzVsRJBt+3l2jSehX9f5tPjUNET0iUSffv3Mmunte/Zj
y67dWLR4KfYcTsDcZatwUfqSQD77sHLtOoyU9nzSrLnYJGPSp1F0rwiteoZL
ux2sOfV6B40Zhxj5vdpJ+0aPxKCRMZi3fBWGjJ2ILbv3Ofmadf48OsqYd87S
5UH32O7v7TJrl3mfK9/M/ffZcfN8Jtbgqh07zXja/dvgPs66X9NnzkJ47z4Y
MnIUjh47Dnv/9cS0NAwTXdxX+vYuPSMQMWwUUtKPPdZf6Pz05esFSEzPMPtr
uvVnQAdbmmHt5i1oJfV5h4yn7PRrTP35q9agZ3gEZqxa65/7s+7BzTuFmLlw
CS7I+MP2MTkQn4iR4ydh2oJFmLd6HQZKfuqY4OKV/EBZNGXNatfNvJE3UHc0
n24VFZo4/KOmTEdY/ygkJKfglowbYuReDx0xuky8mID+0Lg51Zu0xL4jKUbT
q4ZRveHWydZvfKa/2iQaaPueffJ3O5YsWYJ1Gzdil5TtEVLHY8ZPtNodn7Wu
y12v9FoXSxmZJ9d4+uxZZw7Y+4S6WCB9xQbp19auW2988tztlw/uvjsw3+pu
G9xtbol/HbrtR6HHUtu07U99/lIemnTqhgsXL2GsjAd1nlXbpxLjK/YQN+Re
mrW5rnUrdjrscXPAJ9R6b+3atVi8eAkuy/3Te3YsKwubJd+WbtyMKQsX45Dx
uwjUBz32KRlDauzdSaL31E9BY1RMnDEL46TvHCBjhkzRpIFY7oG0zFu2Ar1k
7BeXnIqDopd1reaMRUuMf+KwSVOfWr/tPLTz7uGjYixYuAiDZPyUmJJqjn9c
zrltX6xZ265z3HqOFatWYVfsQaxcvcb46Sgmj/3HLXXmdL0B/0vnngTKhOZp
vJxn7YYNxtf8waNipy1IkXveT/Szzu/vOByH1t3DETNxitlzwG6X1T97wIhR
WL9+Q5AOcV+frR1Wbd+JPv0HYtW6DVi5ajW2yTh8QMxERIhW6RXRG/tjY/3z
pQEVmSRp6yjt3xKpx3ZeP5Dx2fIVK7BGjmP2Kn5w3ymb7nXAdt/nHrfYPu/2
c/ULMPXC6/bxebwfccem02Pp2Hnz3n3GX8rOW/UlGjp6LDZK26u+EHZeTJH+
puZ3zXFK6tu48RPQvXuYsQPuPXgI1/y2urK2LX3ofJiuMVuydCmWL1+OZcuW
m7kxPd/d+/fQS9r8STJOuyKaz/ZlcP7KI0PaiZETJqH/0GjMkjq/WdqLu0F+
Cq79mW2t47XjXNhrEVz9vKutt++rjiXSjp9Ai05dnHWrJj9F+44YPRqR0rbP
XbgUR49btnzbr9y2Mbjz1FPm3qh9UNuAI8eOyTUMR9rJ0+Z+afs6buIkTJ8x
A9lSZsuug7CvJdCWBewhlraz2m/1cyuUfNQ20G4HtPw/9PuhOr6oTptitxNe
13FdeuSx9XHW+bXeRo0cjd4Do8w6hr7Rw805fC4tVfZ+lHqCtZfj0+IN1lzO
e2ViEth1oLiM76AdU8J+z633As8RuOfwBdUnnysvPM49DKTNXheobba2SzrH
o9/bvnMXGst4TOMlaX3V8mvS47KZWnuPBa5Ff6d1Ji45GXlq+/E9fi9sLeDx
PZ6XTpqdPAnko3P1vkB9cfSOyyfSxo579ties7a9IihNgXOkyFivbsvW6C/3
vMAZi/qc9YXl9XOxj6/1L+PMGQwfPxmDR49D3UbfYbL0bTfkXEHXLtek8263
7hY58w5PQ+vD+r37sXPvARm7njf6Re+Zzv/NWLzM3BM97iLpe+q2bIvPatY1
49p7Zu7GOqeuHZ23ei0+q14Le/bHOvXarhfG38Zpn+32xe7HA+Oughu3ZLx8
zPgF2H10WRu+xz/ODqznte6LznfbekvrgWqKrdIGan/arf9g9Bow2B8jJnh8
uljGSnVbtTP+bo5fotM+BurAcrn+7n0HmHkdpzz5y4jW75XS342fM9/Uf329
SPq8Gg2/Q6roWfta7PSq/SIr56L0gYfQvlsPjJ81W8ZqBU6ZDuy/5HN8ZDUv
VY/PXbIMY6fNQDMZh2+VcYfqLW0n1c6r84dq6y6Qcd8h6atPq0+vaE0tN6ek
7Rw5e545dp6kcdikKaKRzkg+HcUB0ZKpx06YNU77Dh1CWGQ/1GvaUsrZRPSO
Gowadevh85p10HVAFLbFHg4ak3lsHQhXnZHXEf0HITJqCBLlPqhfu+6HoPtw
pcrYIEc0mu59oPfn7Q8/Q/X6DdE6LNz4bbg1hcfRB64y41rP7b4/1j0N1Oeb
d25jnIxJZs9faMr4Mrk/tVq0lfuca+aY1QdI51W1rByMi5Ox2RwsWin6Kuus
q93wOffB66/HAQ3pxfufVMNX1Wtiydr1Zk63v4wh6jZrjdky9tIYM3a/6bQD
/n7u9NnzqNO8NUZJvxYxeCjqN28p97DYjNfHif5Uu46NXWZniYZXXaTXcl3q
2/INm9C8YxcZB4Wjp5Ttp2GXKav+udr0Mro97cRJrJE80r0OmkjZ+qp2XQwX
Lft+tS8RNiQ6+F77rLZf9UVq5jEzlsq7es3VhwQ0wzHJY7231WrURPiQoWZt
o7k/0s406dQV56SdUe2jx1uzdSeqN2yCCVK+9x48jL1S1uaKltl1KM7pc/wt
or+dC8S8svtqHUfGTJqGJq3a4MOvvkXk8NHIys4J0jjuPNH6MW/5SjRq1tKk
QctDimqc1m1RvVFTjJ40GQtFix2XdB8+cgQnzp2Ttu+Bkwf2nHOwncTntHPa
N6qOi087auJcaLvs8XicMmTrr+B5NCse3aCx4zFYxpHutXq6Nm/q/MWYPHsO
9hw4aHTlb373B4ybu8C03UZLyphl8PARqCd90RwZq1zyj4UdranrH+V+aRyO
8dNnor70I/UbN8GXUpaHjInB1p17MEvqzaipM5BzOc+x1bs1lv1a80D7Am0/
dG53zZbtpn6rj4Rij5uN/cq5X8HrEcpqOG0/tWzlXyvAhi3bjJ+K2nvd9mZ7
LaSudeg/dJjUo2gpu1nOGNQeSwf6HF9QLD87ZrP6dtdv0x551wqceV37d+06
dsICqcvq7+usO3Sl1bYHB8el8hnNelH6iRWS9uXrNpr2Vf25MyV9u/YfwM59
B5Ak7W5iSprxlc2Vazh1/rype9oGav1WP+NbJr6uF3cK7xnbdqZofLXDqr+I
zjlpWdL3V2/bjmYdO2PS9BlYIeOktt17mbmW4Nhh9nV7nbprxkH+uCPucYBT
n5w+8HH7fiBmQsCWa/REaeljdsJAf+m24QbadNsf1xzXf25dM3bszDljcwvq
7/3l+3T2BfPQvk+/v1fGxw1at8dcGaMtkX5wifTXupbF1nJaJuw6YMUtscaD
USPH4FPRNGozteuybavx+rzO9et7xp/ZE9CldrvuXKMv0A+589Fuh229bP8k
0KYF8tZt23br/LJlTHWBloPte/aicavWuHDliqO7Sv1j1PLu2WCXf6duunzs
dU17kRnbBdaHBMYD7udPP7f+7m5hERq164zO/Qdi+oIFWCRtsNoIE49mWHun
AGbuOHrsONFug3BY7SOuf3r9Z+T+t5W+pVGbDiYOic6zmDmvEv+emq5y7PEG
57F+rmVL5+4HjYoxbZgpG0Zv+fMbti0/YGtxj5nK2tDtcq3H2ih6rGGzVqaO
FvrbQs2T+8UP0bxrmNk/b9WGjSamjeozdx1TLXvz7h1pS7dhgeSLe+xg2Qqs
ffc09uHv334PE2fOxhYpB++JHomeOMW0ZWXHQba97KGU+TUbN0l/XAvTFi4y
bcwNOZf6R+kYWduTgpu3TRtWcOsOBo0Zixr1GqB6nfoYK9rkfO4lJx/VnpSc
mWnKoNrEqjdthfBhI+X5chyV9m6YjBPiM4/7210fvpFjRIumaNqtF+q26YQm
nbujheSFxnht1bmbsfFoGtXeonGzZ0rbq3P3Qe2OP99tjWzfK/27ZV8sGkm/
rbHQuw0cirBBQ9G170A5fh+MEe3bd/RY9Bo0GF0jIrFS8vat9z5EvOhzb5l2
0hlXuF7rvcnLv4bko5lISE4zMSLcff3dokJs2bFbdEdb/Pcf3zL7lPYU/ftd
5x7IzbtiYrs2l7SNFE19MCEJ3XpF4PNvaqBGg+8wSe5fYKxj2aTU9pci2kq1
g23Hyb9xHSOmTEdCxjF0E83XNrwPWnbtgYVr1htNW3Zsa5d9ReNsTVu8FF9+
Ux215X7q/goeb6lpC6vXbYClK1ea/ST0/qs9S4+3LzlFxptnnfZAP1shZUfv
1bL1m5/ThpQZa8O1psyvgzdu3YEOUn9nzV8k5bE2tsp4SPdunyRat7ZoEms/
C6+/r/aZ+rp93370FU3UokcE1m7fZWw6tn7S+pV/tQDTZs9HbRm/TFu0xOjX
oZOnIunoUePj8Md33sONmzcdu5Qec8n6TWgkmlf9k9uERWCWlGXNd+feu8qB
ZU8Knquyy4pqto7duhtb833/2scn+Zvp4ZLTMqQsDjXxTHeJhuszbITxWdgi
mkzvzx/f+cDE7mjWLQw9RX9rHOrrUi/tPkp1qnudor3/hJ7zmpSTkZOnGF/B
9lL+NW6V7u+rY1PV3fHJqTgr+sC613eNfUb9UQ+npqLnsFGYLuP+EscHyEq7
+sV8XbM2WnYJQ7W6jVCnYSPT/tprOvWadE15hNSvOi3aYPrCpTh74aLRMTmX
ryBW8mT8zDlo0T1cvjPE+FscP5+NPaKJP/niK7z/VQ3895/eRkpGhtF/gTUE
wdrT7pPtPkY1k7ano2X8tlbq9E1jv3jgxOrV3+g91nZO7Yt2f2r3XdqWqj7e
LWVvpZRtneP+4Itv0aVHGIpLS5x77e4b9Z/GcmrTtTsmTpuJ3Mt5zjyRPX53
6wi7+TJryB4+wmFpP378zz/F7dt3neuyGSJtlPoLan+n69SC1ora/bJ/Htf2
gzYxTGVcvfFALPrK/WsmOqhzr0iMnD4LY2bORXtJZ5vOXUUjDzNrJcbJfdgt
+T5TdNKoKTOQIWMa1Yt6jBTpR9UP/PTFXCSL3hwj44MkuSe6ZlB909OlPdC/
2ufomFnXzx6ISzRxo3fIOFDLcE5eHk7Id7T+ar6fOpst43/Rt3K/dS2s9i3H
RPdm517GhbzLSJM2OC4uHolHkuSRjISkZPNesmjkw1IfEhISkCz5kSTjr8Sk
JONXp99Nke/oepKj0k6myyNBPktOTbNey3gk44Q+jpu/ulev9fqkee+o9EuH
pI1OkHKpadHzaWyJGctWmfjGiXKuuPg4JCUfQWp6poz9UrFg9XrsT0hyxgi6
zmDQ+MnoJP3NN998i4YyhloiZVDTq+Uy47ie95Sk64iVHnmtc319Bw5CjZq1
MEnapXg5v16TXnei1NGj5nsnkSbpyzh+HKmSFr3uuMQkpEu69bhpMhbS69Dx
QOZJ66HHT8s4buZe9TunzmWbNbWaRp3XOpeTa/JF06DXk5yaIteXaI6lvzPH
04ceS86fLsdJl/Nr3LQsqdf6WfyRFByWceweuT8b9uw3ZdK2OZf6/b2tWO7l
s3O6/Zjs9rmsjnTWeTpzXpYSf9ZaVP3cXiu6ds8+qR9tUaNWLXz99bfmvqVK
mbHH8IpqNivGpFvPW8d6ZNZN5WCd9EPjFyw28Tq1TOs+PBeljUxJS0NCYoLc
1wQkJVnlVctksrStWWfPmno0QepNdPQwpz1x2jqf7RP3ZB4bO9njKX9+aVkb
EjMBR+ReHZL7pHVG72us3Le20mfvOBRn1mntkfFoXsENnBctb+qElIkMXYMl
v9kvv8kxc6he13xCYB7ooWjOWrXrSr5VR0fpuzv0CMfJLGtuOWCntuaATexu
swbUip06UHR2V2lXU7QMSzujcW+OSJr19bFz582en5lnz6Ndh07Ytnef6R90
nFt2nnnnrt1o0a4jwqOiESF9Y/vuYWjUpJlpzzpKf2mtNbdyRteihA8ZhkGS
L5MXLUXbTl0wa9FiE+tfr1PHGnbZ8fjtR7eL7jnl0R7LBfn4IXhsoOuJosdP
krZ1ENp26W7S1l3a2Z7Sv7eT9HQL62l8Xq+INukpfd+oWXOlnKQjPj7B1Pl0
bRcyT5j266jWbUmbtgNap5eu24je0aPQo/9gTJ4zX9qFTGmT0sxaMl2P3apb
T+MLGCNtevd+A1C9Rk2Mn7vA2D81fdNFS3Xp3RfdRQfo2EDXeq0T3TVFjqVt
TpI8jqSkmPZu76F4DBk30cTiUJ9l7Uu3Sxuhtkyt14Ol7NSUe79YxtZaP3Qc
XuLSIIF1xV4nz4r99UX7e/t7qjnnrlpr9hObvXI14jTmmdz/g5InWnZVl9hj
dOW21K0s0VbP2mvCuS++gMa0+urg2a59+/ejedv2CJPxgfpIaR9r2f0eIVHu
wwIZgyTJPUlLt9rYOOkXdC5vtWjHRRs2Y4powx2ixVKkrqRIvdZ2cc3GLVIG
e0mezjXxdCeIntVy0Ffyq8eAKIyZNU80SMCnRdeRq31swYo1WLppizmv5rF7
ri3Y7zxgj7Bjr5o5D38d09/eM9cRmO9zX7eNjgvX7d6HvdL3dxVt2KRJU3+e
ATlXryJqzHiEDRiCKaL/OvboacZ+iVIez8r9U1uL9jdHpH3QvlKvPz4h3pSb
ZO07ZQxYr0FDuda5WLJ5CxrKsXtLvTskfbje20EjRmHh2g1mPJh2+ozU92yj
oTbu3IMoqTtaLkv9GtauX6rXtJ3QMhEVM160Rl6QXcJGtctkyXOdf1Y/7CRp
09bu2oMIaR/adO4iZW2NiWtoU/yoFAmSjgHSHo2VeqC+Q7ZJ54l2Trvd9bcR
6rO+RtqgbpH90Tmslxmr6j3UuP3ax2q/qvaIeGnPErSeS35rPXP6gmNSd2Xs
ojGNtSyqX8QIqZvq/2TfL8tu5baJWetLV2/fie5y3gXLVsr4MNP009qHa79v
tIC0pzrnFC9pUG2jaUmRtiJqooy7ZWyq/hT2/KmN5r3OU2sMV12bpff4iPRX
ejw9brLca017anq6vGfprSS5DnebXDaGatmaWWrW/Fp2Cx3fH5fyZOtZXQOY
lpVlbLnq26H18ZKMv1SX6nybrYMd+43XZ3y6dL5Z772WqZnSjpiY6dLnqo4d
OmkaYqQdPCRts+4vrb564dL2TpUx8PTlq/Bd63b4y1/fw2dffo0a9Rrh6zr1
UadJC9Ru2AR/evsdvPPeB6j2bS18+NnnMk6vjlrftcAH8vyzOg1Rq2U71GrS
EnWbt8HHMr78smZd1GnWGg1ad0Cj9p3RuIP/0bGL/O1knjdq3wn1W7XDW3/9
qzl2UxlH1WzUDK2l3bghbca0hctQ7evq5twfff4V6ouGb92zj9nb24xb/Pms
Nkv1wZjhXz+l/e5hqWNvvfMumnfrhQZtOqBJx25yjC/RSs7RrkcvTJf7mns1
37Qf00V7fPDxp/jwk2r49Mtv8EXNOv40dzFrNhpIeawn+fC5aKNPvqpurqGZ
HPejb2qjepNWxp7RpJM+ulvXJWNm/X09+W1jOV/bPv3Rvnc/E9Ol68Ah+OCr
mqjRrIU5rubnp9W+kLyT1206olaLdmgov23SpQeaynH1/A3bdjTna927v3Xs
lm0wQ+6Z1Sd4AmUNgTn7EscW9PLY9dzYxoyGgXMsuzgb27Gr7Fn2hheLjWPZ
6R45OuJp+4jZayTt9s22HThp9I/xr4huO37+vNFMuj/Rqp27ULN+Q7z7wUd4
W8rAJ3LfP/jkU1SrXgv/t71zf9GqCOP4XxaZ4N1td9u8kGspVqyY3cQ2CMKS
NARjEUXyQgmmhhUkmNEvpeblh8zE1QzJfsgiMIqKSFffMz3fOec5M3P2IvRj
fD6w7PvuznveOXN55rmdmQUDj4ZX39ga5a9sLr9WHjcr6hqSzPH3sXU8D6X5
8RwpzxlWveQ/3Gbraf/Q0rB248u2dozFZ2sc5UNoX6md7x4MIy+OhqdfeCmW
v6BzPpscO89Hcn93vr9gnovhsZvbTT5j2y+9ZCPntoDK6VkA5STJt1rv7Rja
vm7z5TL92tvGbY1ivDQ+iPzcKrfLU9ulGEg7ZjK9pL3XzK5XuXhPWawp3X/m
B7iPfVX3Wa+dH/oe7fuq58Ek8xYODNl8XBvn3aw586NsW7h8ZZgztDz02+s9
Bw+FW6Y/Ki570uzdVSZP5KeUn33Bw/3h8CefFucX5n4avz/J+rwP9Prj4yfC
4keWRH/PXJOpC/oHwvbde+P/pe9ctnGt/VnVP3FvniqP3dT3Lp3Tc5kdfwY7
6k5NG+n7k26aco983Ot8a8Vmu3lC3t767J27M58Z3syOTl0y/bfjO0zPWPRa
m+226YKrTfYNLnvM1qSRGM+QHfOL79dgdTtl6/Gmt3aEJcNPxHIjti7sf+9I
m884qV5V2u/HfVfSHfI9rHxvnlTnjiyo6jhErnNHnax5Br1q/Mt3Gj+kj+l2
HmU6019//xO+N/3/9oSfjdFr/ZVJd0hyTntV7D38fth75GjcO3O+ybIhWzMW
DS2z8ftAHIMjG0bD1h27svhcKbO9b5RToX1OtN+vbBrpktI9fmv2luhVVceP
Wtch+iDbOZ3pYZ12clnzZ4zb/pFi5Z0xMdH4M/KxVscSZ/BzVr1mr5S7k2a8
/nbs5Knw+tiusGpkvekpc8PnZ8/a2vBD2LJjZ+gzO036xKw58+z10rB5bEeU
tUK2h9qjni+eL5n62NtC1dT31DHdKhyw/lhn6/JTz26Iz1gOr3surLSxu8Lk
w+CKx6NeMdt+5i3qC6Ob34w2m/eJfrprjr5f/bP7wEHTu4ZD39LlYdB0qof6
BsOD8xeH2aZvaU48YzrFatNPBmzs5/6hFF9Nv/OcsaqRuf7sjc/rrqxu+/Je
8tXW73tN/lUpG/L8Ye+/meKd3qdq80smh3XPivFL3ikXTHnxF779LnxzXb7V
2r+qsXTBbIjz41fDa6a77/ngo3Dq4kXTZa/G8zAuXTdZaWNZ78+Pj8fzBaT3
qvw55XKZHn9adoD9XX5c+VL0Xt9T+1Tq+msvxK+uXot/l70iO91zZD2fLsUS
032rL+Nn7Pr6Tv2WTuJ7OrT9Yfct3U2+MflA5D9WOdlo5y5fjnU/b/XVs3zy
N+hauifVVTn2sqV1DtwX8gU396M14ozZNNpDYM3zG2Oe0qFjx+PrNaZXrH9l
U9hn7VXX7Ur0H0hX0nftOfph+MyuV7fXlfBlbJ9rMeYxumVbOHH6TIzR+j1H
32Imt9PY/S/6ZtXGs+JYbNaXfOz4GHSbL+lkpW42E/m6O1HMkzQWRTFXCr0v
FGe8KJ5el/dzQEKMdY3fuBHHs8b19ebMdpetKYeg1GPadanwpyVbu1vHaVuy
SjkoUb/O9LAubV57J5+01fWCy/bmmiG0a/9U5z7kerKfu5jnpqU+TrnELiPy
vk7rZlW0UV7XaBdM3Gs+6/3WrU8WE+r1OuMmlarzRnrFveX1E547Ue+zWE2S
s21+erFfa1XIhtaHYeUUS5L/TzJL81dySfJGPj/tSzVsdvHY/ndirniuCyvn
SvEizV+tI90+KHTLe1PnqwjFYX+69atd48foc/rZdIt6HQrtuC7GXqbTxfhG
o8eWY7Jcd/L5kuo09TjsVWW7TTWn76ff5+VSP9R7bbfnSkxp29VoTiu+/3vm
W/d27I5D5aMpr8b7OH9OeLr77f6vHItVa0fmNlIqm+c/ldfMc9kn98fka9Xl
Uj/HemYyLJVJ9ph+S//82tZgxSakL+rcNj9zrH02oJDZU+znMaX86sjZavo5
3d1ToDjLsZBl3mq5bzgUzzOEkNaBVItebJzcz1l4jSt/Zjn50ctnJHrRN1fb
q/XYkF9U8l9rvHx6vuev+wq8prl8yOWry57p0DojHUdxI8mPuN4opmy2vXKW
ctq9LzJ7oCsPlceruJPOYXrS9Ibtb+8LN0038/Kq380sFxsAAAAAAAAAAAAA
AAAAAAAAAAAAAAAAAAAAAAAAAAAAAAAAAAAAAAAAAAAAAAAAAAAAAAAAAAAA
AAAAAAAAAAAAAAAAAAAAAAAAAAAAAAAAAAAAAAAAAAAAAAAAAAAAAAAAAAAA
AAAAAAAAAAD+P/wLLW3Okw==
"], {{0, 260.}, {669., 0}}, {0, 255},
ColorFunction->RGBColor],
BoxForm`ImageTag["Byte", ColorSpace -> "RGB", Interleaving -> True],
Selectable->False],
DefaultBaseStyle->"ImageGraphics",
ImageSize->{316., Automatic},
ImageSizeRaw->{669., 260.},
PlotRange->{{0, 669.}, {0, 260.}}]\)], PlotRange -> All]](https://www.wolframcloud.com/obj/resourcesystem/images/91f/91f1e9af-7d3b-430a-a095-6ac18b5a77cb/4d49704654769ebd.png) |
| Out[11]= | 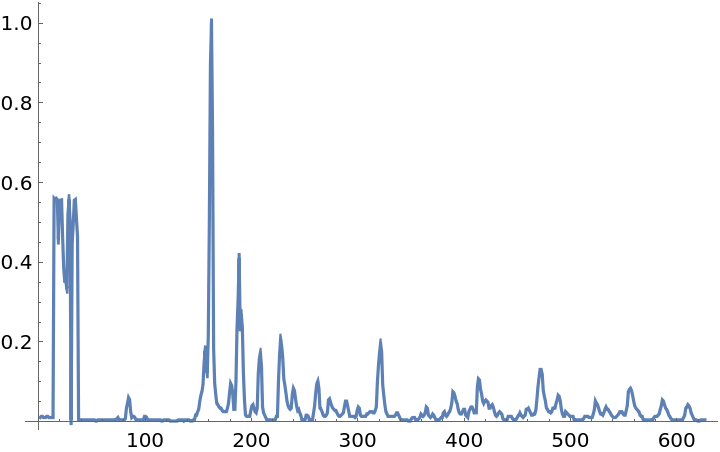 |
This work is licensed under a Creative Commons Attribution 4.0 International License
![(* Evaluate this cell to get the example input *) CloudGet["https://www.wolframcloud.com/obj/fa0ca0c3-8a85-4071-a73a-4b5f7e7850b8"]](https://www.wolframcloud.com/obj/resourcesystem/images/91f/91f1e9af-7d3b-430a-a095-6ac18b5a77cb/65946739251b6411.png)