Wolfram Function Repository
Instant-use add-on functions for the Wolfram Language
Function Repository Resource:
Visualize the principal components of tabular data
ResourceFunction["BiPlot"][data] generates a ListPlot of the first two principal components of data together with an arrow for each column to indicate the relationship with the principal components. | |
ResourceFunction["BiPlot"][data, {a,b}] generates a ListPlot of the a and b principal components of data together with an arrow for each column to indicate the relationship with the principal components a and b. | |
ResourceFunction["BiPlot"][data, {a,b,c}] generates a ListPointPlot3D of the a,b and c principal components of data together with a 3D arrow for each column to indicate the relationship with the principal components. |
| "ColumnNames" | names of data columns, used to label arrows in the plot |
| "LabelPosition" | positioning of arrow labels as a proportion of arrow length |
| "ArrowStyle" | graphics primatives to be applied to the arrows in the plot |
In this data set we can see from the arrows that "Petal width" and "Petal length" are highly correlated, but "Sepel width" is largely independent from both:
| In[1]:= |
| Out[1]= |
| In[2]:= | ![ResourceFunction["BiPlot"][data, "ColumnNames" -> {"Sepal length", "Sepal\nwidth", "Petal\nlength", "Petal\nwidth"}]](https://www.wolframcloud.com/obj/resourcesystem/images/342/342033c0-fd62-4c03-a70e-4e0c1efaba26/4aaa3909f1375466.png) |
| Out[2]= | 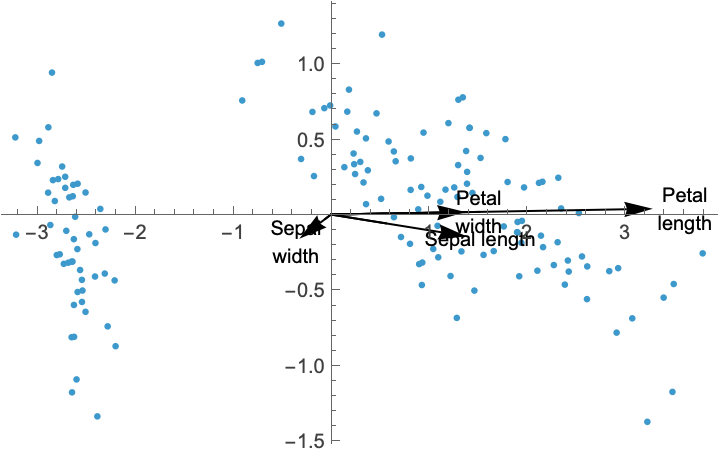 |
By default the first and second principal values are used, but you can specify different choices:
| In[3]:= |
| Out[3]= | 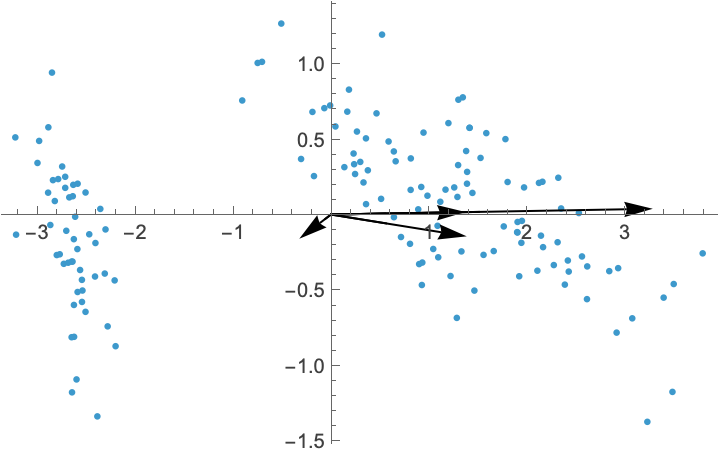 |
If you specify three principal values, then the data and arrows are shown in three dimensions:
| In[4]:= |
| Out[4]= | 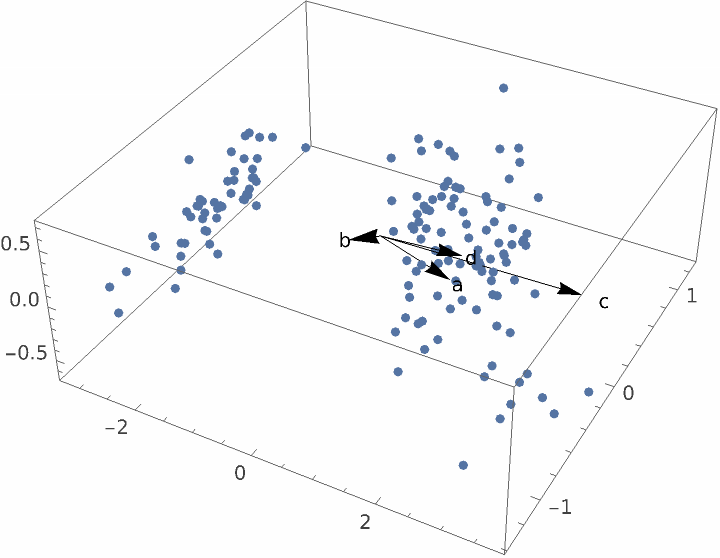 |
If your data is a list of associations or a Dataset or Tabular of a list of associations, then "ColumnNames" are chosen automatically and the arrows are labeled:
| In[5]:= | ![data = First /@ ExampleData[{"MachineLearning", "FisherIris"}, "Data"]
data2 = Dataset[
AssociationThread[{"Sepal length", "Sepal\nwidth", "Petal length", "Petal width"}, #] & /@ data]](https://www.wolframcloud.com/obj/resourcesystem/images/342/342033c0-fd62-4c03-a70e-4e0c1efaba26/4beec3aca61e0352.png) |
| Out[5]= | 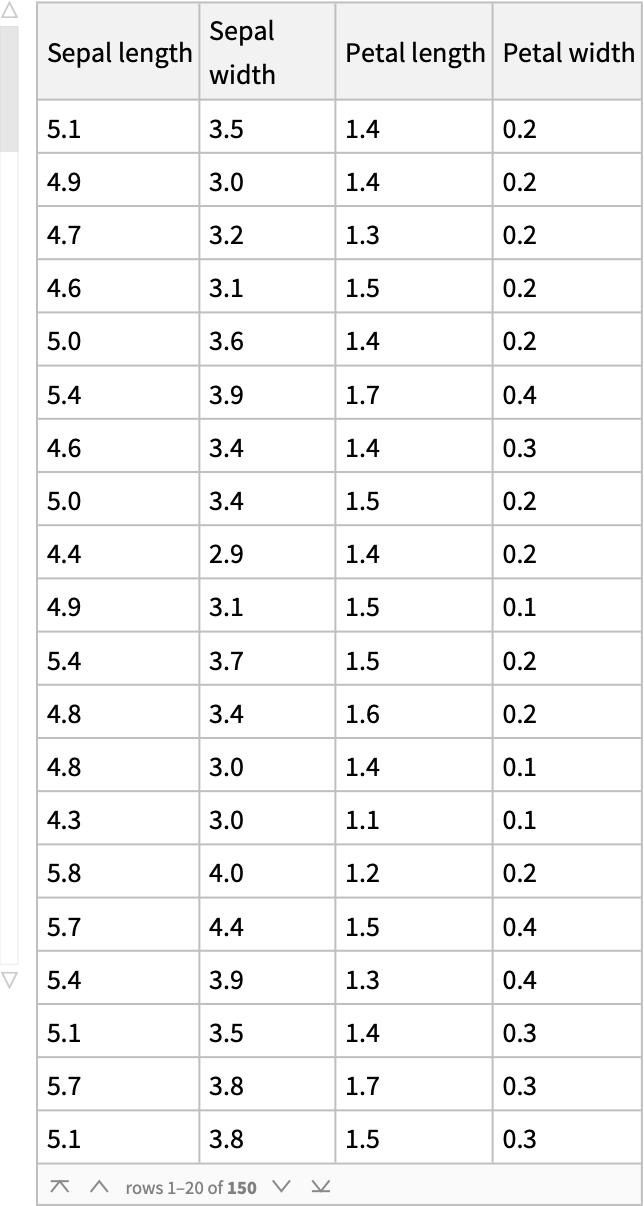 |
| In[6]:= |
| Out[6]= |  |
| In[7]:= |
| Out[7]= | 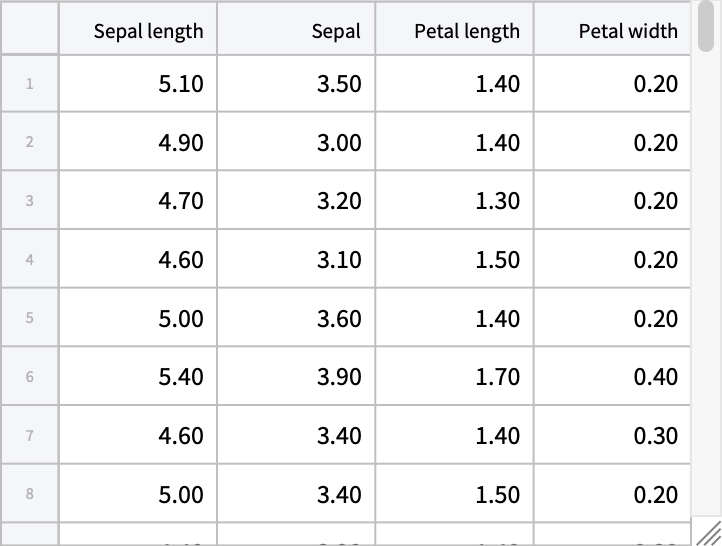 |
| In[8]:= |
| Out[8]= | 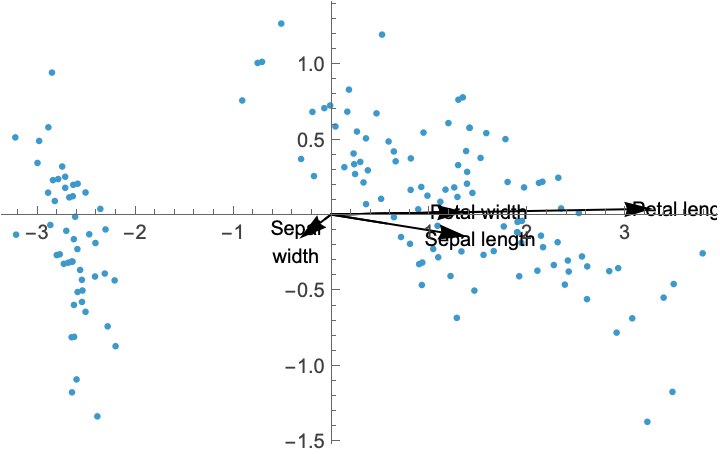 |
"ColumnNames" can be used to place labels on the arrows:
| In[9]:= | ![data = First /@ ExampleData[{"MachineLearning", "FisherIris"}, "Data"]
ResourceFunction["BiPlot"][data, "ColumnNames" -> {"Sepal length", "Sepal\nwidth", "Petal\nlength", "Petal\nwidth"}]](https://www.wolframcloud.com/obj/resourcesystem/images/342/342033c0-fd62-4c03-a70e-4e0c1efaba26/54e6ddd3f1c2f9c5.png) |
| Out[9]= | 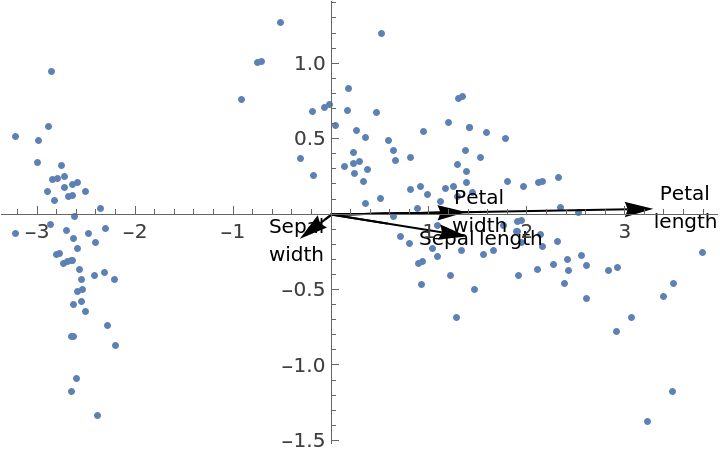 |
"LabelPosition" can be used to position labels along or beyond the arrows:
| In[10]:= | ![data = First /@ ExampleData[{"MachineLearning", "FisherIris"}, "Data"]
ResourceFunction["BiPlot"][data, "ColumnNames" -> {"Sepal length", "Sepal\nwidth", "Petal\nlength", "Petal\nwidth"}, "LabelPosition" -> 0.8]](https://www.wolframcloud.com/obj/resourcesystem/images/342/342033c0-fd62-4c03-a70e-4e0c1efaba26/2347a45d8849e91d.png) |
| Out[10]= | 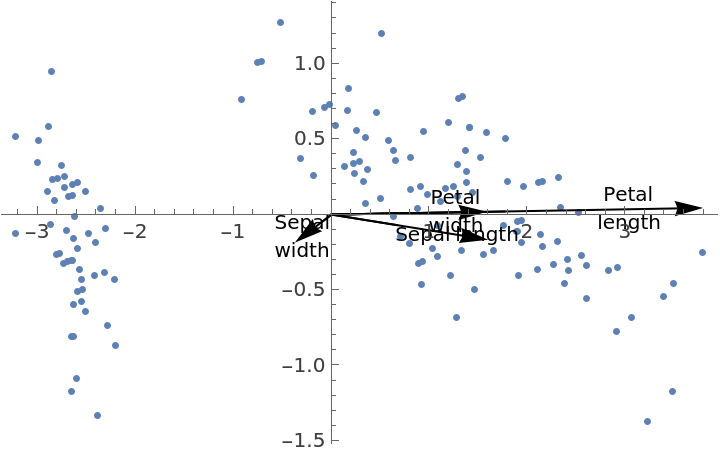 |
"ArrowStyle" can be used to style the arrows:
| In[11]:= | ![data = First /@ ExampleData[{"MachineLearning", "FisherIris"}, "Data"]
ResourceFunction["BiPlot"][data, "ColumnNames" -> {"Sepal length", "Sepal\nwidth", "Petal\nlength", "Petal\nwidth"}, BaseStyle -> "Text", "ArrowStyle" -> {GrayLevel[0.6], Arrowheads[0.02]}]](https://www.wolframcloud.com/obj/resourcesystem/images/342/342033c0-fd62-4c03-a70e-4e0c1efaba26/7a434a34d66ed94d.png) |
| Out[11]= | 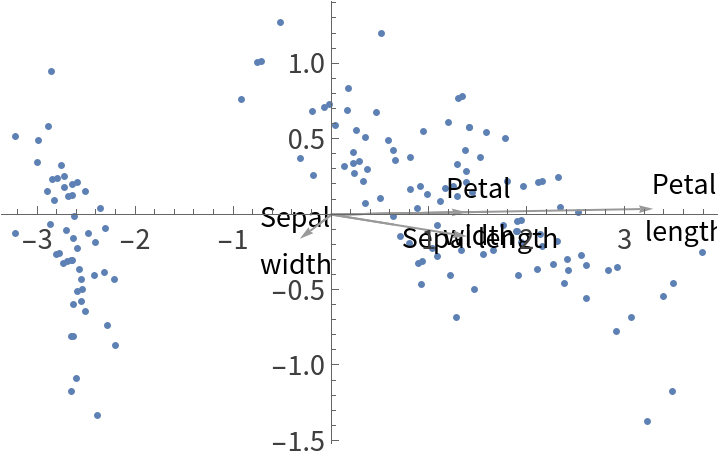 |
Wolfram Language 11.3 (March 2018) or above
This work is licensed under a Creative Commons Attribution 4.0 International License