Wolfram Function Repository
Instant-use add-on functions for the Wolfram Language
Function Repository Resource:
Plot the occurrences of labels in a list
ResourceFunction["LabelListPlot"][list] plots the occurrences of labels in a list. |
Make a simple LabelListPlot:
| In[1]:= |
| Out[1]= | 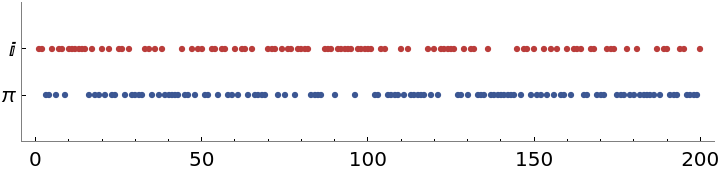 |
Plot a sequence from a categorical distribution:
| In[2]:= |
| Out[3]= | 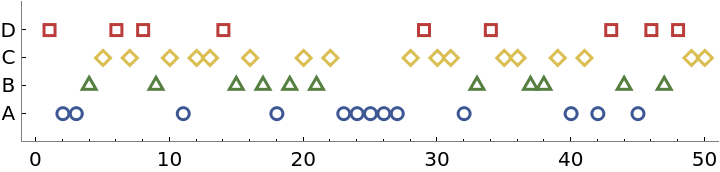 |
Sublists can be of different lengths:
| In[4]:= |
| In[5]:= |
| Out[5]= | 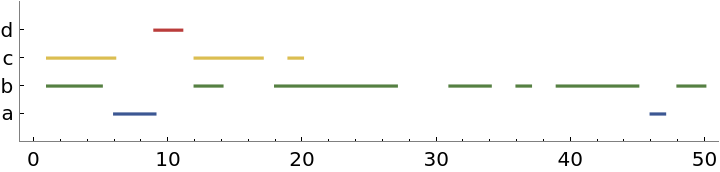 |
This work is licensed under a Creative Commons Attribution 4.0 International License