Details and Options
EnsemblGeneTree is based on
Ensembl, which provides genomics information including phylogenetic relations.
Nodes and branches of trees illustrate homologous genes of various species and their evolutionary relationships, respectively.
Selected "
Gene" entities, gene symbols or Ensembl gene/tree IDs can be used for the argument
gene.
The following options can be given:
| "TreeType" | "GeneTree" | specified type of trees to illustrate "TreeGraphic" result; allowed values include:
"GeneTree", "GeneGainLossTree" |
| "SequenceType" | "Protein" | specified type of sequences included in the "Dataset"; allowed values include: "Protein", "cDNA" |
| "Species" | "human" | specified species to query result; selected TaxonomicSpecies entities or names of species are used |
| "Highlight" | {} | specified "TreeGraphic" elements to highlight |
The "GeneTree" illustrates evolutionary relationships between a group of homologous genes. Branch lengths are estimated based on the DNA alignment. The tree may include ambiguous nodes due to the phylogenetic interpretation of duplication nodes with a low consistency score.
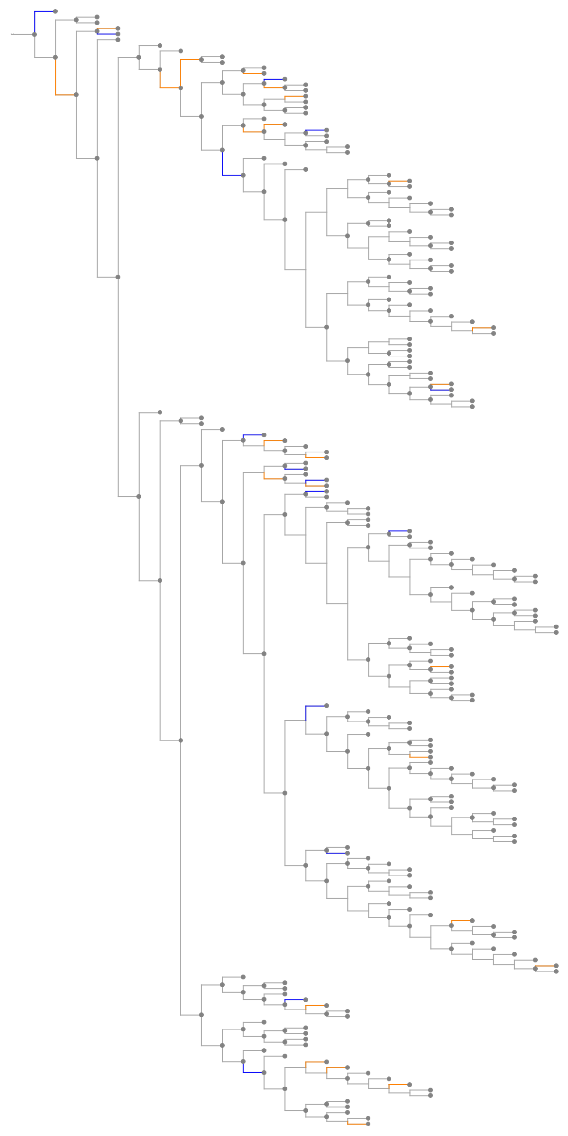
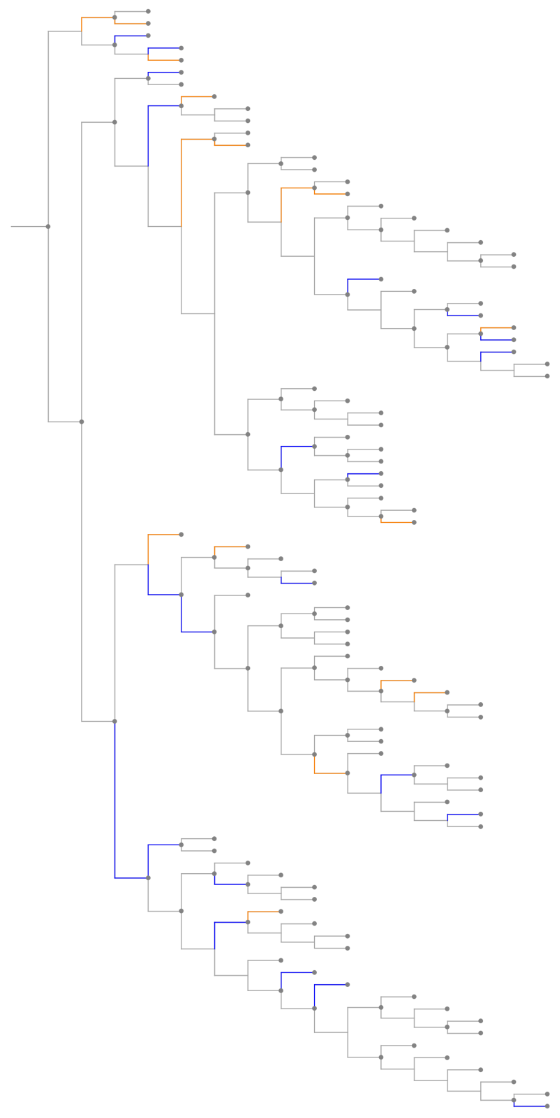
The "GeneGainLossTree" analyzes the evolution of the size of gene families over time. Significant gene gain events (expansions) are shown with orange branches and gene loss events (contractions) are shown with blue branches.
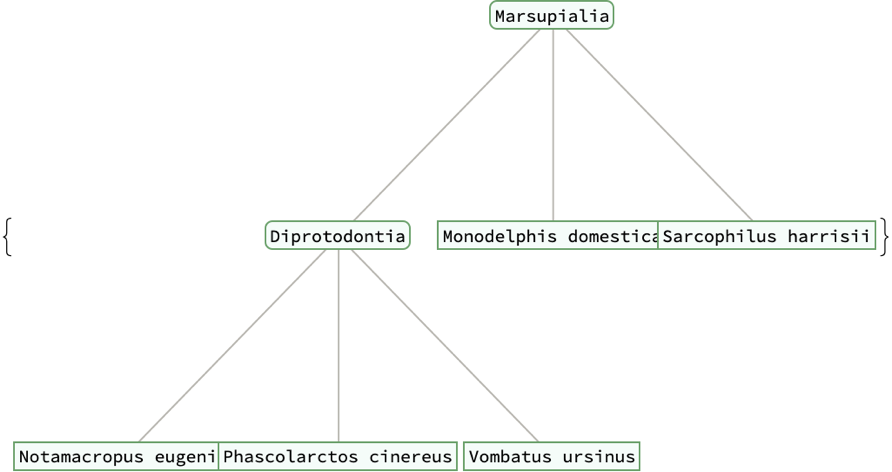
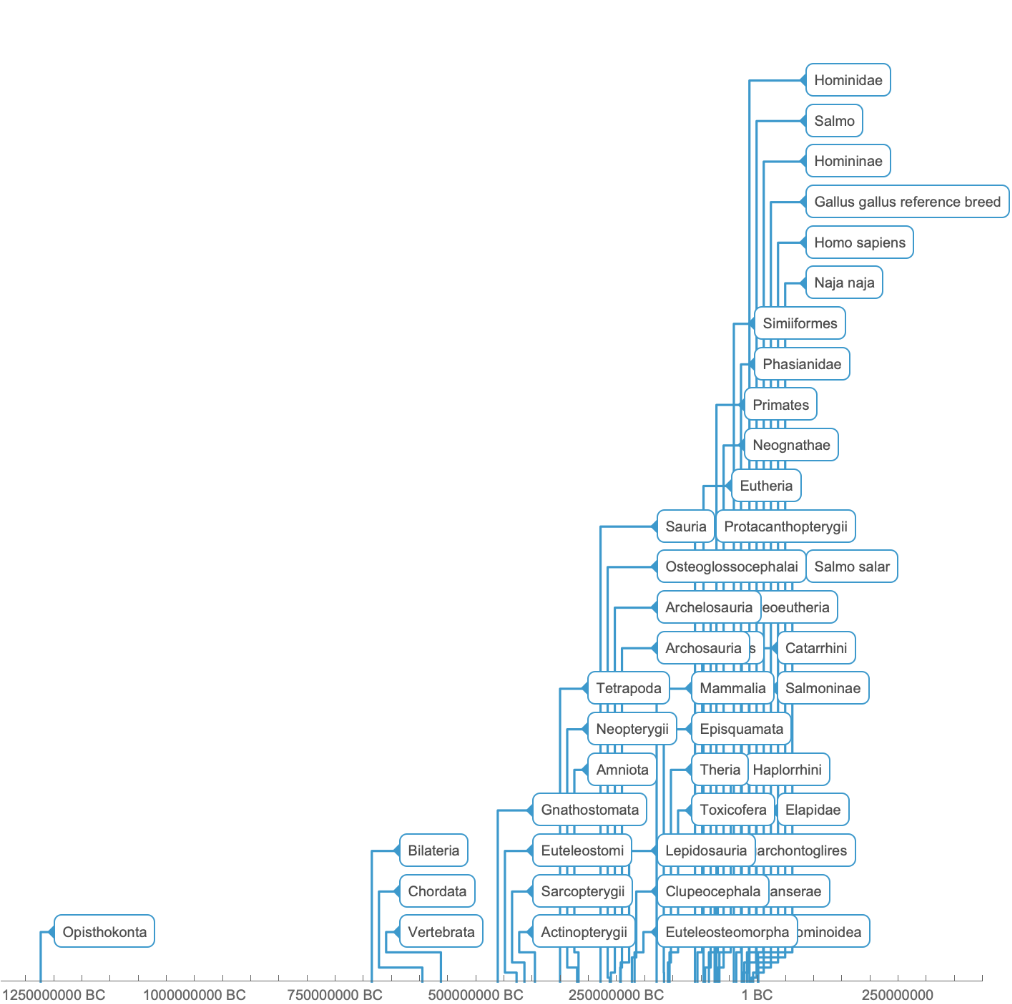
ResourceFunction["EnsemblGeneTree"][gene,"Tree"] returns the Tree object illustrating the relations among organisms. It does not account for branch lengths (genetic distances) or gene gain/loss events.
ResourceFunction["EnsemblGeneTree"][gene] is equivalent to ResourceFunction["EnsemblGeneTree"][gene,"TreeGraphic"].

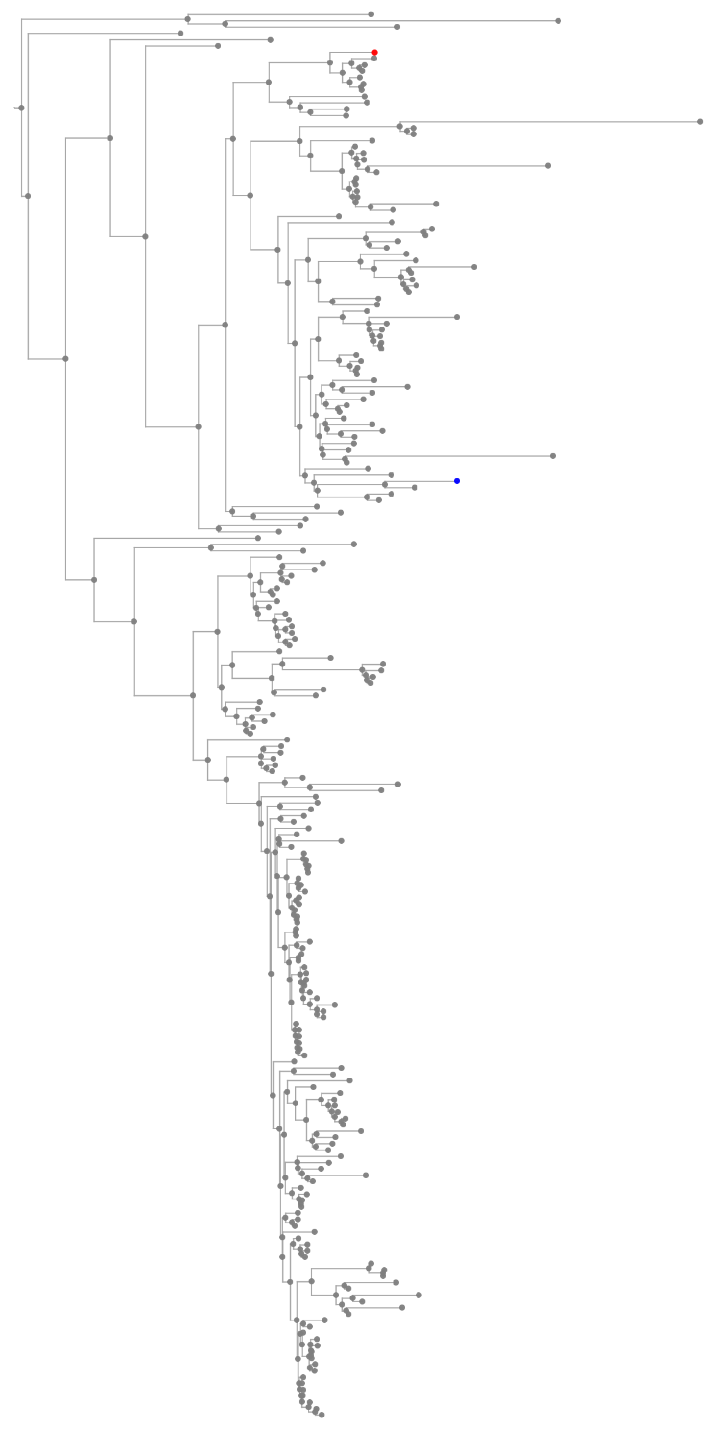
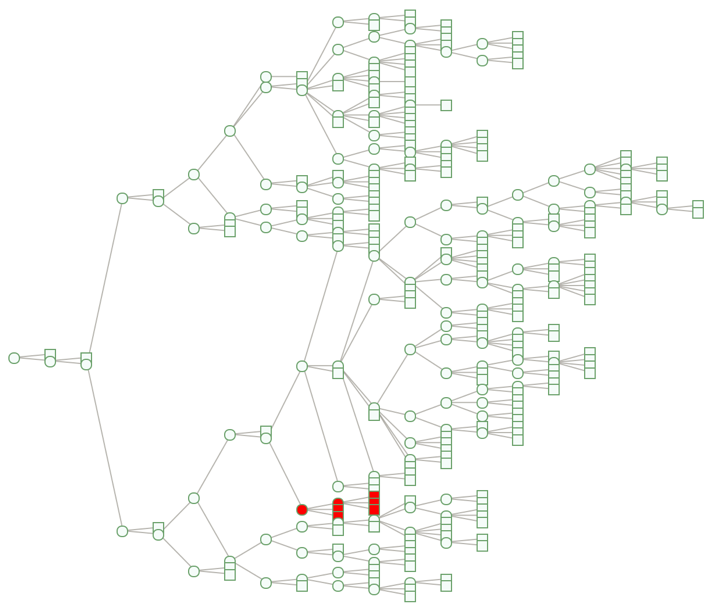
![Tree[clocktree, TreeElementStyle -> (TreeCases[
Alternatives @@ Join[{TreeData[marsupialiatree[[1]]], TreeData[TreeChildren[marsupialiatree[[1]]][[1]]]}, TreeData /@ TreeLeaves[marsupialiatree[[1]]]]] -> Red)]](https://www.wolframcloud.com/obj/resourcesystem/images/16a/16aa0755-4c32-4eeb-8d3e-649bf8d3058b/1-0-0/37300394cb65db8a.png)
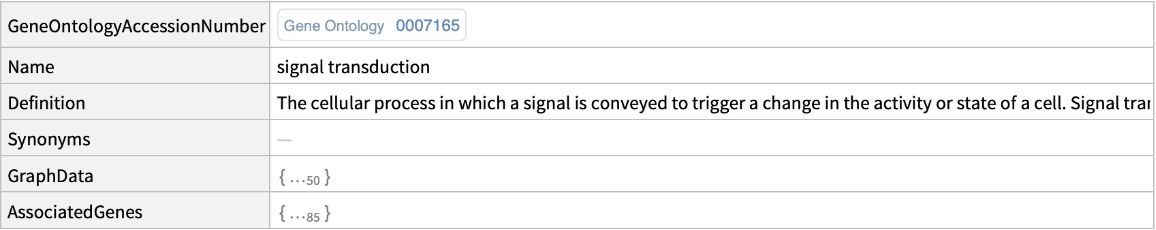
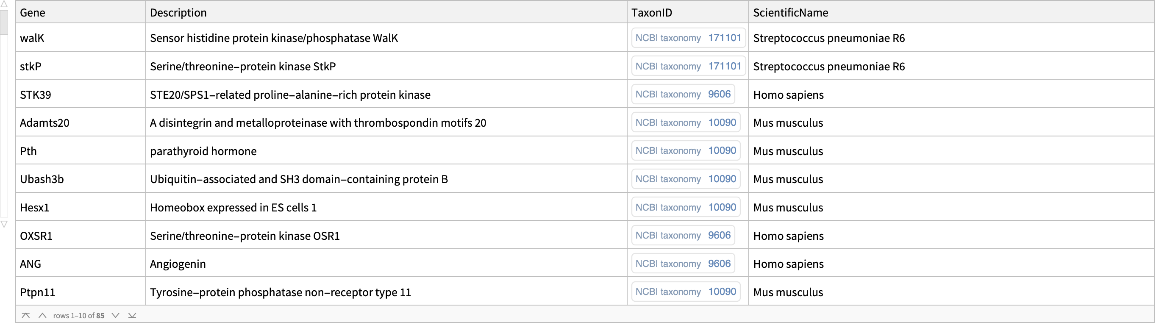
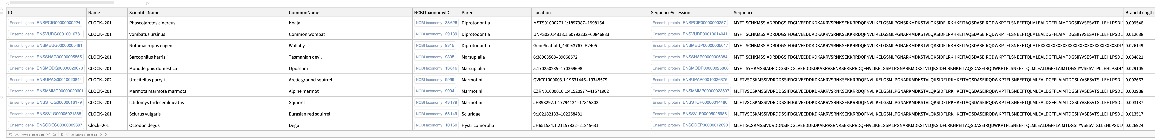
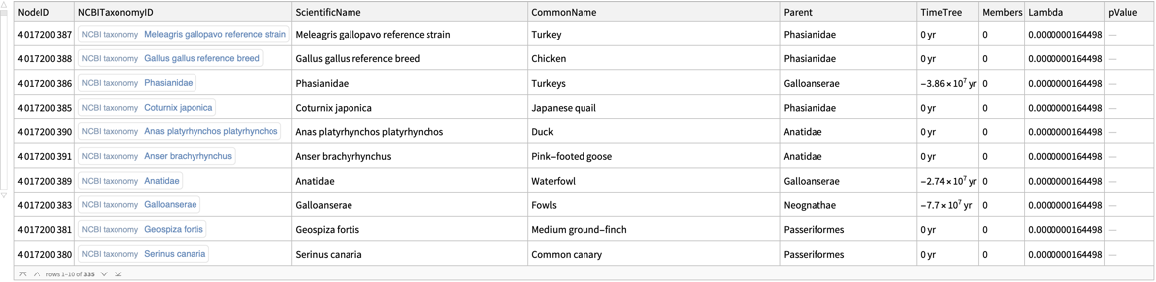
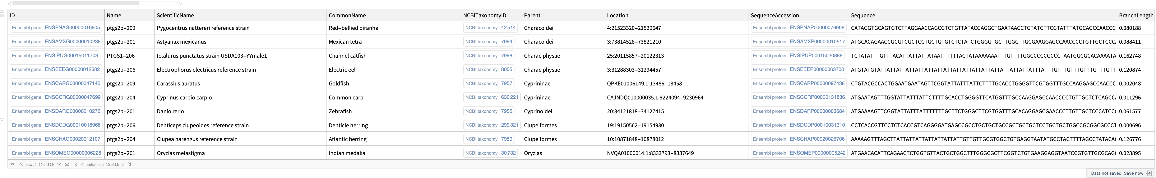
![signalTransductionGeneTreeData = ResourceFunction["EnsemblGeneTree"][#[[1]], "Dataset", {"TreeType" -> "GeneGainLossTree", "Species" -> #[[2]]}] & /@ Normal@Values@
signalTransductionGenes[All, {"Gene", "ScientificName"}] // DeleteMissing;](https://www.wolframcloud.com/obj/resourcesystem/images/16a/16aa0755-4c32-4eeb-8d3e-649bf8d3058b/1-0-0/507739cc6f4a3f68.png)
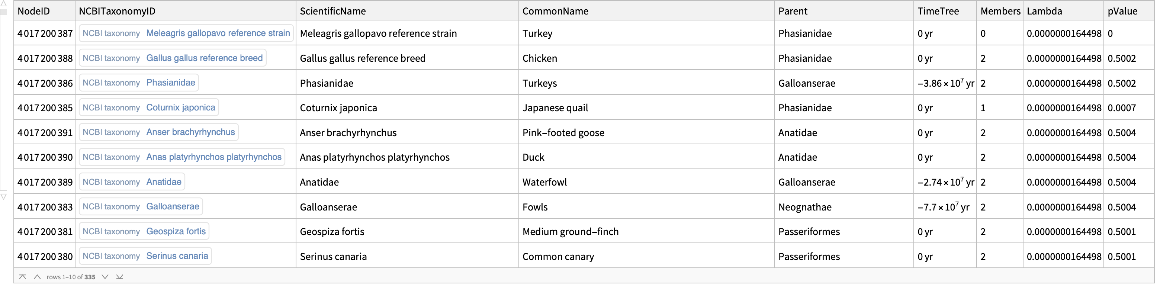
![signalTransductionGeneFamilyTotal = Normal@GroupBy[
Flatten[Cases[signalTransductionGeneTreeData, d_Dataset :> Normal@d[All, {"ScientificName", "Parent", "Members"}]]], First, {#[[1, 2]], Total@#[[All, -1]]} &];
signalTransductionGeneFamilyTotal // Short](https://www.wolframcloud.com/obj/resourcesystem/images/16a/16aa0755-4c32-4eeb-8d3e-649bf8d3058b/1-0-0/40237aa2fd7cf0ae.png)
![signalTransductionGeneFamilyLineage = # -> (MapThread[
Rule, {#, # /. signalTransductionGeneFamilyTotal /. {_, i_Integer} :> i}] &@Reverse@
DeleteMissing@
NestWhileList[
Cases[signalTransductionGeneFamilyTotal, Rule[#, {par_, _}] :> par] /. {s_} :> s &, #, ! MatchQ[#, {} | _Missing] &]) & /@ {"Homo sapiens", "Salmo salar", "Gallus gallus reference breed", "Naja naja"}](https://www.wolframcloud.com/obj/resourcesystem/images/16a/16aa0755-4c32-4eeb-8d3e-649bf8d3058b/1-0-0/1af4907082dd8886.png)

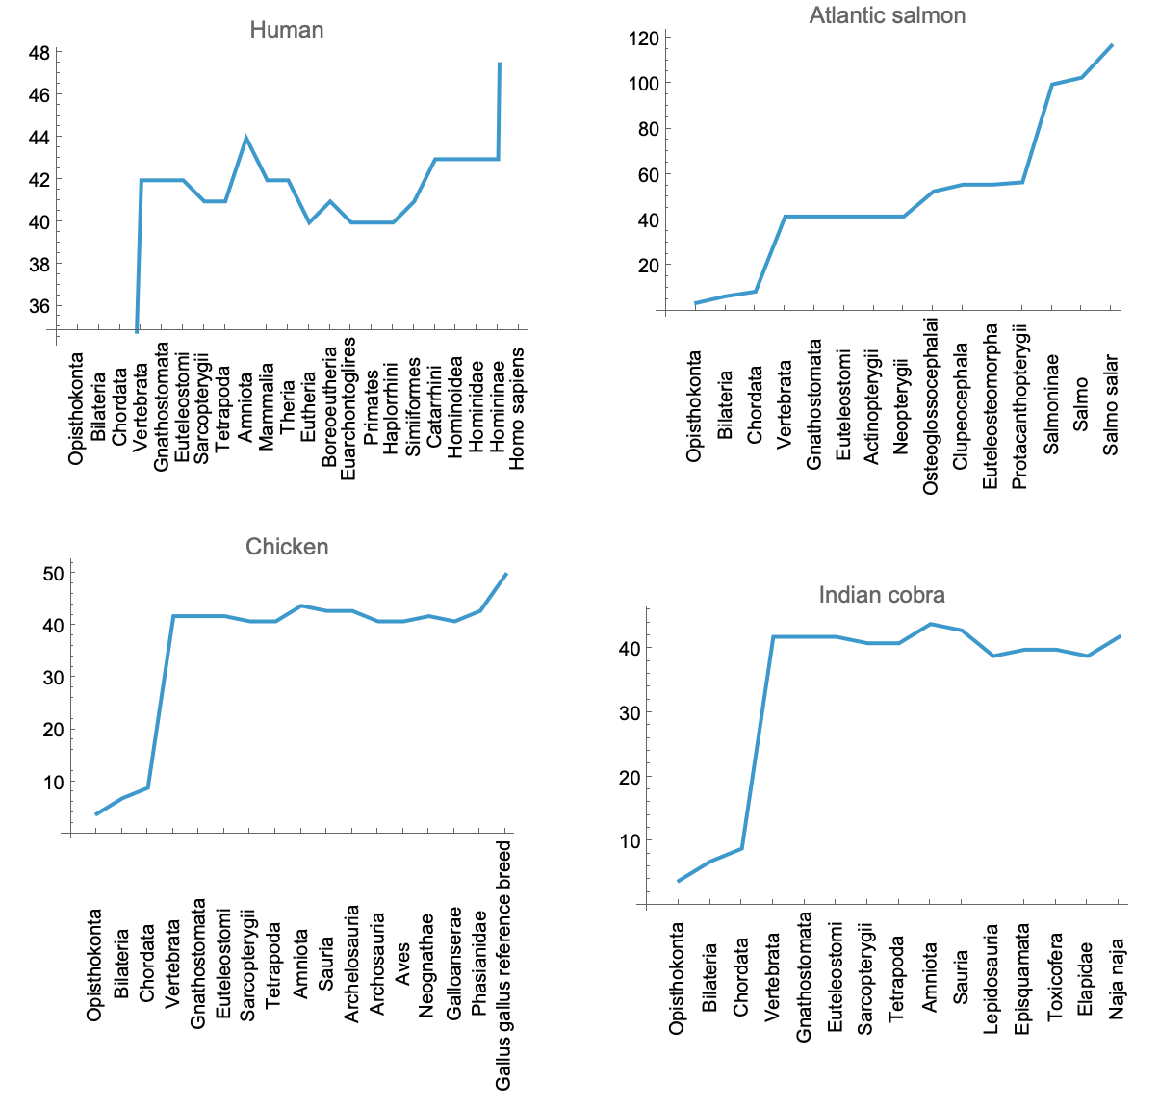
![GraphicsGrid[
Partition[
ListLinePlot[#[[2]][[All, 2]], Ticks -> {MapIndexed[
List[#2[[1]], Style[Rotate[#1, Pi/2]]] &, #[[2]][[All, 1]]], Automatic}, PlotLabel -> (#[[1]] /. Normal@signalTransductionGeneTreeData[[1]][
All, #"ScientificName" -> #"CommonName" &])] & /@ signalTransductionGeneFamilyLineage, 2]]](https://www.wolframcloud.com/obj/resourcesystem/images/16a/16aa0755-4c32-4eeb-8d3e-649bf8d3058b/1-0-0/7aac1267a2699279.png)
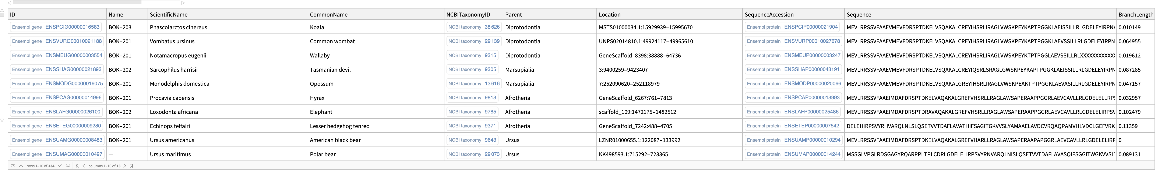
![TimelinePlot[
Tooltip[Labeled["TimeTree", "ScientificName"], "ScientificName"] /. Select[Union@
Flatten[Normal@
Cases[signalTransductionGeneTreeData, d_Dataset :> Normal@d[All, {"ScientificName", "TimeTree"}]], 1] /. q_Quantity :> Now + q, MemberQ[Union[
Flatten[signalTransductionGeneFamilyLineage[[All, 2]]][[All, 1]]],
"ScientificName" /. #[[1]]] &]]](https://www.wolframcloud.com/obj/resourcesystem/images/16a/16aa0755-4c32-4eeb-8d3e-649bf8d3058b/1-0-0/54a13f23f945f056.png)
![ResourceFunction["EnsemblGeneTree"][
Entity["Gene", {"TP53", {"Species" -> "HomoSapiens"}}], "TreeGraphic",
"TreeType" -> "GeneGainLossTree"]](https://www.wolframcloud.com/obj/resourcesystem/images/16a/16aa0755-4c32-4eeb-8d3e-649bf8d3058b/1-0-0/5dcf9f0910777feb.png)