Wolfram Function Repository
Instant-use add-on functions for the Wolfram Language
Function Repository Resource:
Plot with several enhancements added for singularities, asymptotes, surd values and non-interval domains
|
ResourceFunction["EnhancedPlot"][f,{x,xmin,xmax}] returns a plot with several enhancements given by options. |
| "Asymptote" | { } | list of points where the function has vertical asymptotes |
| "AsymptoteStyle" | {{Red,Dashed}} | graphics directive to specify the style for each asymptote |
| "DrawPoint" | { } | list of points to add to the plot |
| "DrawPointStyle" | AbsolutePointSize[7] | graphics directives to specify style(s) for the points given with "DrawPoint" |
| "Exception" | { } | list of points where the function has discontinuities |
| "FindExceptions" | Automatic | whether to use ResourceFunction["FunctionDiscontinuities"] to find the discontinuities |
| "HorizontalAsymptote" | { } | list of points where horizontal asymptotes should be drawn |
| "HorizontalAsymptoteStyle" | {{Red,Dashed}} | graphics directive to specify the style for each horizontal asymptote |
| "PointStyle" | AbsolutePointSize[7] | graphics directive to specify the style for the point(s) where the function has a discontinuity; color directives are not allowed |
| "PowerBehavior" | Real | odd roots of negative real numbers are returned as negative real numbers |
| "ZeroToNull" | True | whether to change the default value of a piecewise function from zero to Null |
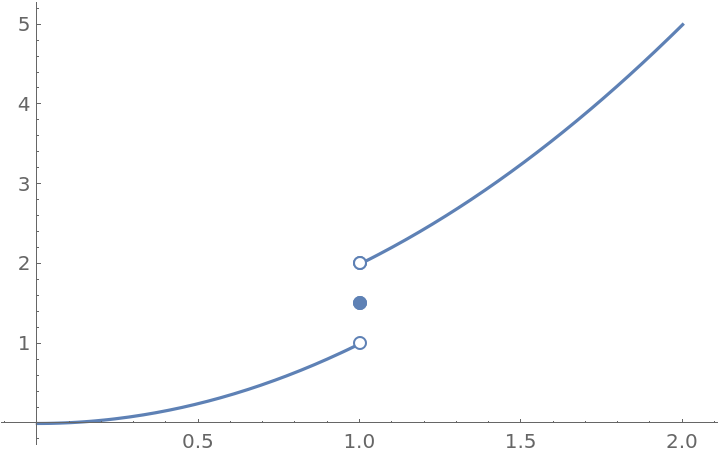
Find the discontinuities and plot a function:
| In[1]:= |
![f[x_] := \[Piecewise] {
{x^2, x < 1},
{x^2 + 1, x > 1},
{1.5, x == 1}
}
ResourceFunction["EnhancedPlot"][f[x], {x, 0, 2}, "FindExceptions" -> True]](https://www.wolframcloud.com/obj/resourcesystem/images/ad8/ad846957-ea4b-4872-be92-fa22a1355ebe/2-0-0/53eddbd52188d095.png)
|
| Out[2]= |
|
Explicitly give the discontinuity:
| In[3]:= |
![f[x_] := \[Piecewise] {
{x^2, x < 1},
{x^2 + 1, x > 1},
{1.5, x == 1}
}
ResourceFunction["EnhancedPlot"][f[x], {x, 0, 2}, "Exception" -> 1]](https://www.wolframcloud.com/obj/resourcesystem/images/ad8/ad846957-ea4b-4872-be92-fa22a1355ebe/2-0-0/25335b03a4cc0691.png)
|
| Out[4]= |

|
Plot a function with a removable discontinuity:
| In[5]:= |
|
| Out[5]= |

|
Explicitly give the discontinuity:
| In[6]:= |
|
| Out[6]= |
|
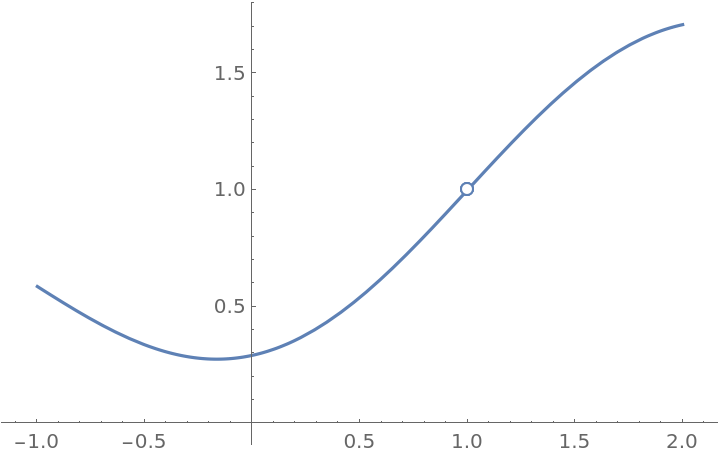
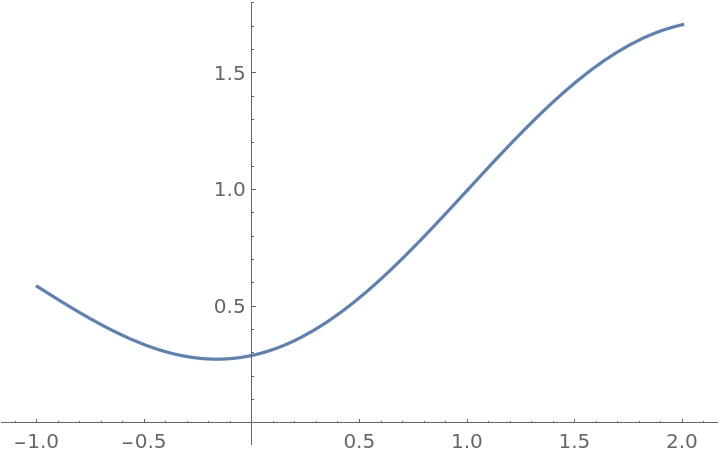
Remove the discontinuity:
| In[7]:= |
|
| Out[7]= |
|
| In[8]:= |
![f[x_] := \!\(\*
TagBox[GridBox[{
{"\[Piecewise]", GridBox[{
{
RowBox[{
FractionBox[
SuperscriptBox[
RowBox[{"Sin", "[",
RowBox[{"x", "-", "1"}], "]"}], "2"],
RowBox[{"x", "-", "1"}]], "+", "1"}],
RowBox[{"x", "!=", "1"}]},
{"1",
RowBox[{"x", "==", "1"}]}
},
AllowedDimensions->{2, Automatic},
Editable->True,
GridBoxAlignment->{
"Columns" -> {{Left}}, "ColumnsIndexed" -> {}, "Rows" -> {{Baseline}}, "RowsIndexed" -> {}},
GridBoxItemSize->{
"Columns" -> {{Automatic}}, "ColumnsIndexed" -> {}, "Rows" -> {{1.}}, "RowsIndexed" -> {}},
GridBoxSpacings->{"Columns" -> {
Offset[0.27999999999999997`], {
Offset[0.84]},
Offset[0.27999999999999997`]}, "ColumnsIndexed" -> {}, "Rows" -> {
Offset[0.2], {
Offset[0.4]},
Offset[0.2]}, "RowsIndexed" -> {}},
Selectable->True]}
},
GridBoxAlignment->{
"Columns" -> {{Left}}, "ColumnsIndexed" -> {}, "Rows" -> {{Baseline}}, "RowsIndexed" -> {}},
GridBoxItemSize->{
"Columns" -> {{Automatic}}, "ColumnsIndexed" -> {}, "Rows" -> {{1.}}, "RowsIndexed" -> {}},
GridBoxSpacings->{"Columns" -> {
Offset[0.27999999999999997`], {
Offset[0.35]},
Offset[0.27999999999999997`]}, "ColumnsIndexed" -> {}, "Rows" -> {
Offset[0.2], {
Offset[0.4]},
Offset[0.2]}, "RowsIndexed" -> {}}],
"Piecewise",
DeleteWithContents->True,
Editable->False,
SelectWithContents->True,
Selectable->False,
StripWrapperBoxes->True]\)
ResourceFunction["EnhancedPlot"][f[x], {x, -1, 2}, "FindExceptions" -> True, AxesOrigin -> {0, 0}]](https://www.wolframcloud.com/obj/resourcesystem/images/ad8/ad846957-ea4b-4872-be92-fa22a1355ebe/2-0-0/7ab451a513b0f801.png)
|
| Out[9]= |
|
Remove the discontinuity but show the break point:
| In[10]:= |
![f[x_] := \!\(\*
TagBox[GridBox[{
{"\[Piecewise]", GridBox[{
{
RowBox[{
FractionBox[
SuperscriptBox[
RowBox[{"Sin", "[",
RowBox[{"x", "-", "1"}], "]"}], "2"],
RowBox[{"x", "-", "1"}]], "+", "1"}],
RowBox[{"x", "!=", "1"}]},
{"1",
RowBox[{"x", "==", "1"}]}
},
AllowedDimensions->{2, Automatic},
Editable->True,
GridBoxAlignment->{
"Columns" -> {{Left}}, "ColumnsIndexed" -> {}, "Rows" -> {{Baseline}}, "RowsIndexed" -> {}},
GridBoxItemSize->{
"Columns" -> {{Automatic}}, "ColumnsIndexed" -> {}, "Rows" -> {{1.}}, "RowsIndexed" -> {}},
GridBoxSpacings->{"Columns" -> {
Offset[0.27999999999999997`], {
Offset[0.84]},
Offset[0.27999999999999997`]}, "ColumnsIndexed" -> {}, "Rows" -> {
Offset[0.2], {
Offset[0.4]},
Offset[0.2]}, "RowsIndexed" -> {}},
Selectable->True]}
},
GridBoxAlignment->{
"Columns" -> {{Left}}, "ColumnsIndexed" -> {}, "Rows" -> {{Baseline}}, "RowsIndexed" -> {}},
GridBoxItemSize->{
"Columns" -> {{Automatic}}, "ColumnsIndexed" -> {}, "Rows" -> {{1.}}, "RowsIndexed" -> {}},
GridBoxSpacings->{"Columns" -> {
Offset[0.27999999999999997`], {
Offset[0.35]},
Offset[0.27999999999999997`]}, "ColumnsIndexed" -> {}, "Rows" -> {
Offset[0.2], {
Offset[0.4]},
Offset[0.2]}, "RowsIndexed" -> {}}],
"Piecewise",
DeleteWithContents->True,
Editable->False,
SelectWithContents->True,
Selectable->False,
StripWrapperBoxes->True]\)
ResourceFunction["EnhancedPlot"][f[x], {x, -1, 2}, "Exception" -> 1, AxesOrigin -> {0, 0}]](https://www.wolframcloud.com/obj/resourcesystem/images/ad8/ad846957-ea4b-4872-be92-fa22a1355ebe/2-0-0/570573b131b16cda.png)
|
| Out[11]= |

|
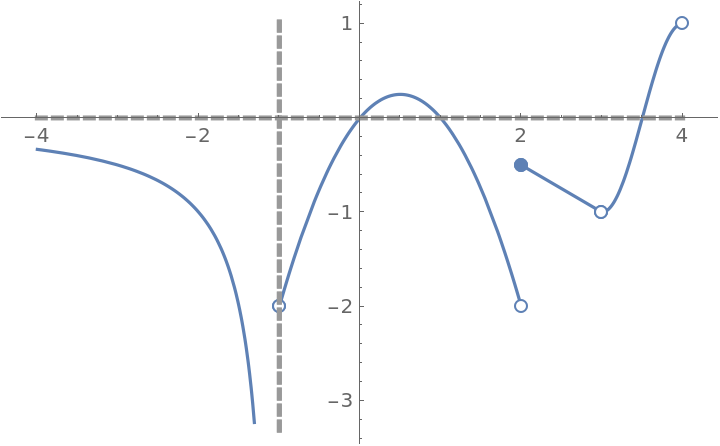
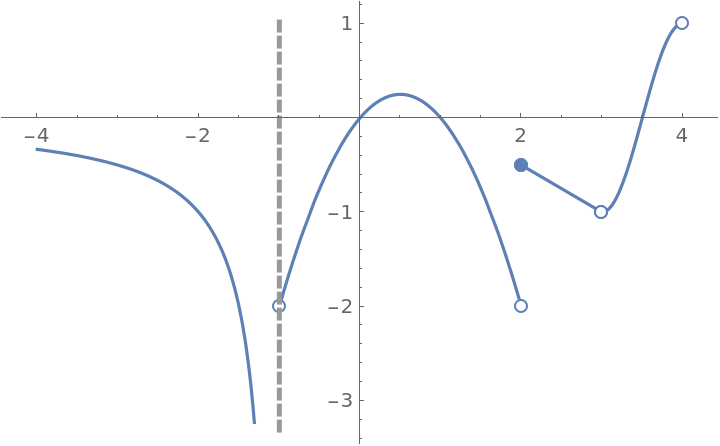
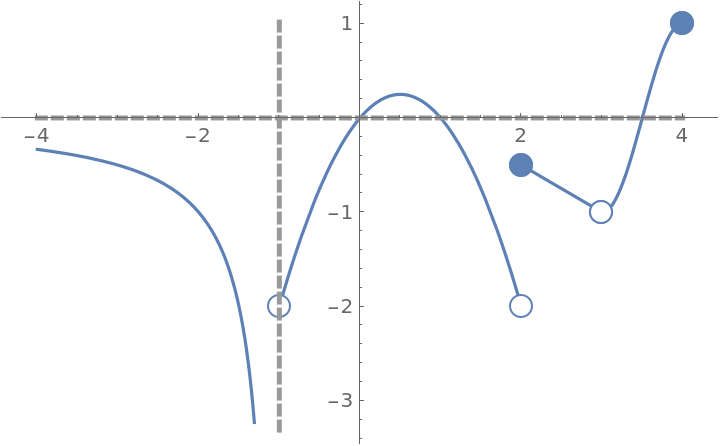
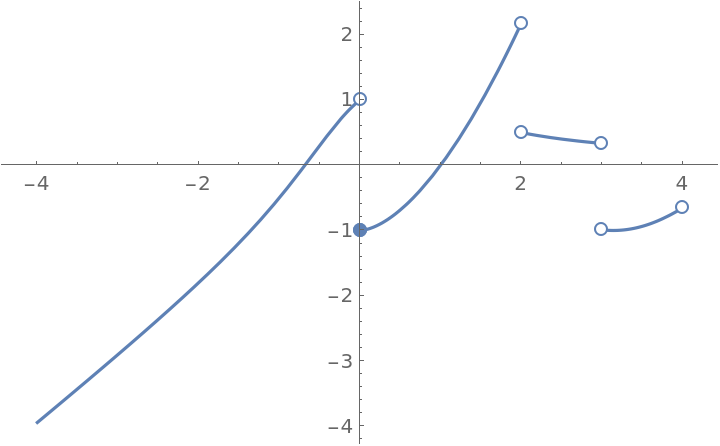
Plot a function with an asymptote at x=-1, a horizontal asymptote at y=0 , a jump discontinuity at x=2 and a removable discontinuity at x=3:
| In[12]:= |
![Clear[f]
f[x_] := \!\(\*
TagBox[GridBox[{
{"\[Piecewise]", GridBox[{
{
FractionBox["1",
RowBox[{"1", "+", "x"}]],
RowBox[{"x", "<",
RowBox[{"-", "1"}]}]},
{
RowBox[{"x", "-",
SuperscriptBox["x", "2"]}],
RowBox[{
RowBox[{"-", "1"}], "<", "x", "<", "2"}]},
{
RowBox[{
FractionBox["1", "2"],
RowBox[{"(",
RowBox[{"1", "-", "x"}], ")"}]}],
RowBox[{"2", "<=", "x", "<", "3"}]},
{
RowBox[{"Cos", "[",
RowBox[{"\[Pi]", " ", "x"}], "]"}],
RowBox[{"3", "<", "x", "<", "4"}]}
},
AllowedDimensions->{2, Automatic},
Editable->True,
GridBoxAlignment->{"Columns" -> {{Left}}, "Rows" -> {{Baseline}}},
GridBoxItemSize->{"Columns" -> {{Automatic}}, "Rows" -> {{1.}}},
GridBoxSpacings->{"Columns" -> {
Offset[0.27999999999999997`], {
Offset[0.84]},
Offset[0.27999999999999997`]}, "Rows" -> {
Offset[0.2], {
Offset[0.4]},
Offset[0.2]}},
Selectable->True]}
},
GridBoxAlignment->{"Columns" -> {{Left}}, "Rows" -> {{Baseline}}},
GridBoxItemSize->{"Columns" -> {{Automatic}}, "Rows" -> {{1.}}},
GridBoxSpacings->{"Columns" -> {
Offset[0.27999999999999997`], {
Offset[0.35]},
Offset[0.27999999999999997`]}, "Rows" -> {
Offset[0.2], {
Offset[0.4]},
Offset[0.2]}}],
"Piecewise",
DeleteWithContents->True,
Editable->False,
SelectWithContents->True,
Selectable->False,
StripWrapperBoxes->True]\)
ResourceFunction["EnhancedPlot"][f[x], {x, -4, 4}, "FindExceptions" -> True, "Asymptote" -> -1, "HorizontalAsymptote" -> 0]](https://www.wolframcloud.com/obj/resourcesystem/images/ad8/ad846957-ea4b-4872-be92-fa22a1355ebe/2-0-0/16c03466737446b4.png)
|
| Out[14]= |
|
"FindAsymptote" misses the horizontal asymptote at y=0:
| In[15]:= |
![Clear[f]
f[x_] := \!\(\*
TagBox[GridBox[{
{"\[Piecewise]", GridBox[{
{
FractionBox["1",
RowBox[{"1", "+", "x"}]],
RowBox[{"x", "<",
RowBox[{"-", "1"}]}]},
{
RowBox[{"x", "-",
SuperscriptBox["x", "2"]}],
RowBox[{
RowBox[{"-", "1"}], "<", "x", "<", "2"}]},
{
RowBox[{
FractionBox["1", "2"],
RowBox[{"(",
RowBox[{"1", "-", "x"}], ")"}]}],
RowBox[{"2", "<=", "x", "<", "3"}]},
{
RowBox[{"Cos", "[",
RowBox[{"\[Pi]", " ", "x"}], "]"}],
RowBox[{"3", "<", "x", "<", "4"}]}
},
AllowedDimensions->{2, Automatic},
Editable->True,
GridBoxAlignment->{"Columns" -> {{Left}}, "Rows" -> {{Baseline}}},
GridBoxItemSize->{"Columns" -> {{Automatic}}, "Rows" -> {{1.}}},
GridBoxSpacings->{"Columns" -> {
Offset[0.27999999999999997`], {
Offset[0.84]},
Offset[0.27999999999999997`]}, "Rows" -> {
Offset[0.2], {
Offset[0.4]},
Offset[0.2]}},
Selectable->True]}
},
GridBoxAlignment->{"Columns" -> {{Left}}, "Rows" -> {{Baseline}}},
GridBoxItemSize->{"Columns" -> {{Automatic}}, "Rows" -> {{1.}}},
GridBoxSpacings->{"Columns" -> {
Offset[0.27999999999999997`], {
Offset[0.35]},
Offset[0.27999999999999997`]}, "Rows" -> {
Offset[0.2], {
Offset[0.4]},
Offset[0.2]}}],
"Piecewise",
DeleteWithContents->True,
Editable->False,
SelectWithContents->True,
Selectable->False,
StripWrapperBoxes->True]\)
ResourceFunction["EnhancedPlot"][f[x], {x, -4, 4}, "FindExceptions" -> True, "FindAsymptotes" -> True]](https://www.wolframcloud.com/obj/resourcesystem/images/ad8/ad846957-ea4b-4872-be92-fa22a1355ebe/2-0-0/652ced113b4fcdd0.png)
|
| Out[17]= |
|
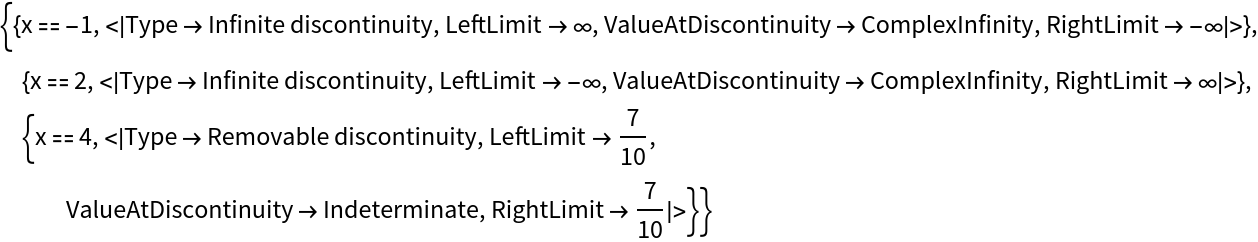
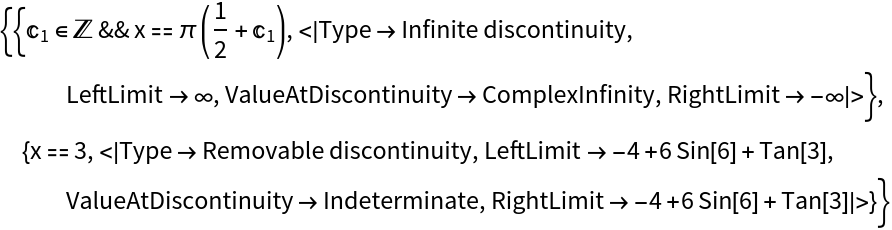
An example from the resource function FunctionDiscontinuities:
| In[18]:= |
|
| Out[19]= |
|
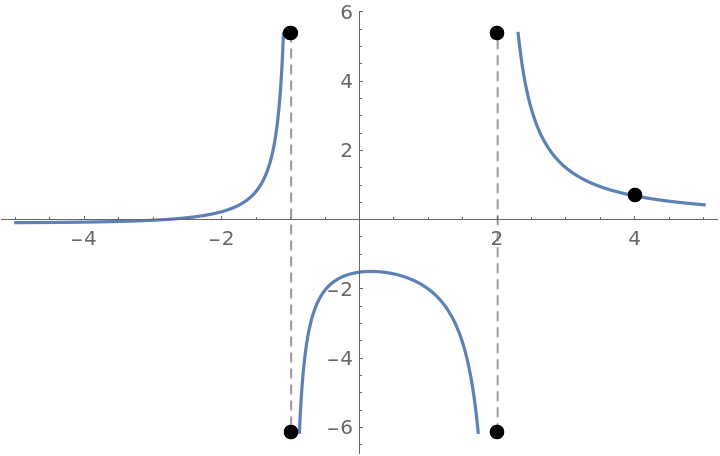
Plot the result using the Plot command and the option ExclusionsStyle:
| In[20]:= |
|
| Out[20]= |
|
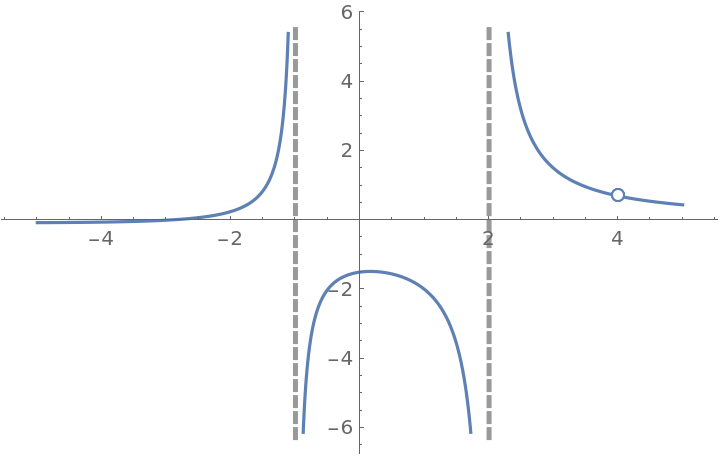
Use EnhancedPlot to obtain a much better plot:
| In[21]:= |
|
| Out[21]= |
|
It is not necessary to call on the resource function Asymptotes to find the vertical asymptotes of the following function since they are among the discontinuities found by the resource function FunctionDiscontinuities:
| In[22]:= |
|
| Out[22]= |
|
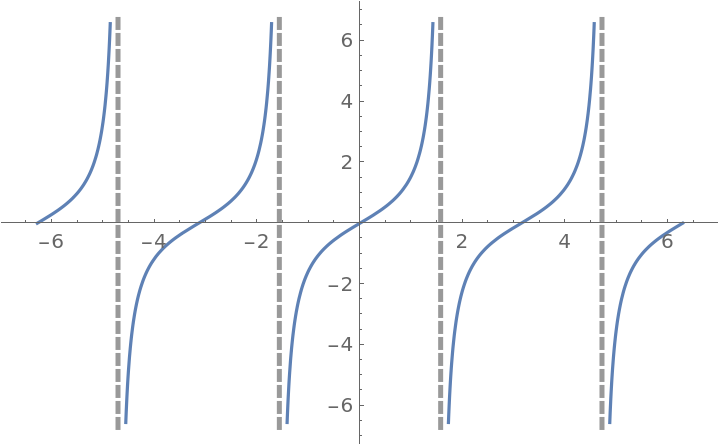
Plot a function with asymptotes and a removable discontinuity:
| In[23]:= |
![f[x_] := (x^2 - 9)/(x - 3) Sin[2 x] + Tan[x] - 9
ResourceFunction["EnhancedPlot"][f[x], {x, 0, 2 \[Pi]}, "FindExceptions" -> True]](https://www.wolframcloud.com/obj/resourcesystem/images/ad8/ad846957-ea4b-4872-be92-fa22a1355ebe/2-0-0/7fbf58b3df3eb713.png)
|
| Out[24]= |
|
| In[25]:= |
|
| Out[25]= |
|
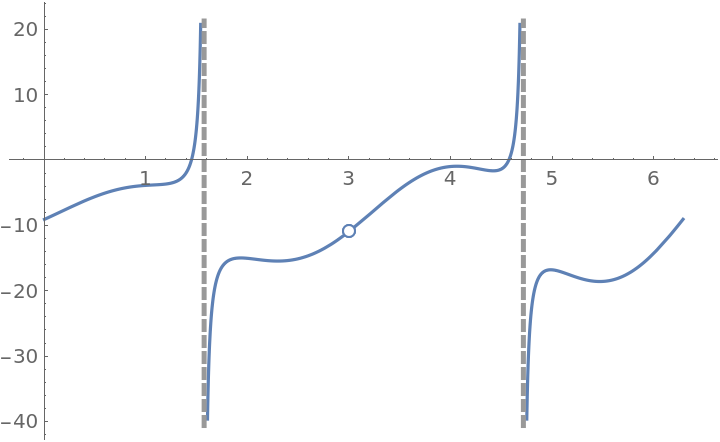
Remove the singularity by appropriately defining the function at x=3 so that f(3)=limn→3f(x):
| In[26]:= |
|
| Out[26]= |
|
| In[27]:= |
![f[x_] := \!\(\*
TagBox[GridBox[{
{"\[Piecewise]", GridBox[{
{
RowBox[{
RowBox[{
FractionBox[
RowBox[{
SuperscriptBox["x", "2"], "-", "9"}],
RowBox[{"x", "-", "3"}]],
RowBox[{"Sin", "[",
RowBox[{"2", "x"}], "]"}]}], "+",
RowBox[{"Tan", "[", "x", "]"}], "-", "9"}],
RowBox[{"x", "!=", "3"}]},
{
RowBox[{
RowBox[{"-", "9"}], "+",
RowBox[{"6", " ",
RowBox[{"Sin", "[", "6", "]"}]}], "+",
RowBox[{"Tan", "[", "3", "]"}]}],
RowBox[{"x", "==", "3"}]}
},
AllowedDimensions->{2, Automatic},
Editable->True,
GridBoxAlignment->{
"Columns" -> {{Left}}, "ColumnsIndexed" -> {}, "Rows" -> {{Baseline}}, "RowsIndexed" -> {}},
GridBoxItemSize->{
"Columns" -> {{Automatic}}, "ColumnsIndexed" -> {}, "Rows" -> {{1.}}, "RowsIndexed" -> {}},
GridBoxSpacings->{"Columns" -> {
Offset[0.27999999999999997`], {
Offset[0.84]},
Offset[0.27999999999999997`]}, "ColumnsIndexed" -> {}, "Rows" -> {
Offset[0.2], {
Offset[0.4]},
Offset[0.2]}, "RowsIndexed" -> {}},
Selectable->True]}
},
GridBoxAlignment->{
"Columns" -> {{Left}}, "ColumnsIndexed" -> {}, "Rows" -> {{Baseline}}, "RowsIndexed" -> {}},
GridBoxItemSize->{
"Columns" -> {{Automatic}}, "ColumnsIndexed" -> {}, "Rows" -> {{1.}}, "RowsIndexed" -> {}},
GridBoxSpacings->{"Columns" -> {
Offset[0.27999999999999997`], {
Offset[0.35]},
Offset[0.27999999999999997`]}, "ColumnsIndexed" -> {}, "Rows" -> {
Offset[0.2], {
Offset[0.4]},
Offset[0.2]}, "RowsIndexed" -> {}}],
"Piecewise",
DeleteWithContents->True,
Editable->False,
SelectWithContents->True,
Selectable->False,
StripWrapperBoxes->True]\)
ResourceFunction["EnhancedPlot"][f[x], {x, 0, 2 \[Pi]}, "FindExceptions" -> True]](https://www.wolframcloud.com/obj/resourcesystem/images/ad8/ad846957-ea4b-4872-be92-fa22a1355ebe/2-0-0/1e7e3fcddf1fcebb.png)
|
| Out[28]= |
|
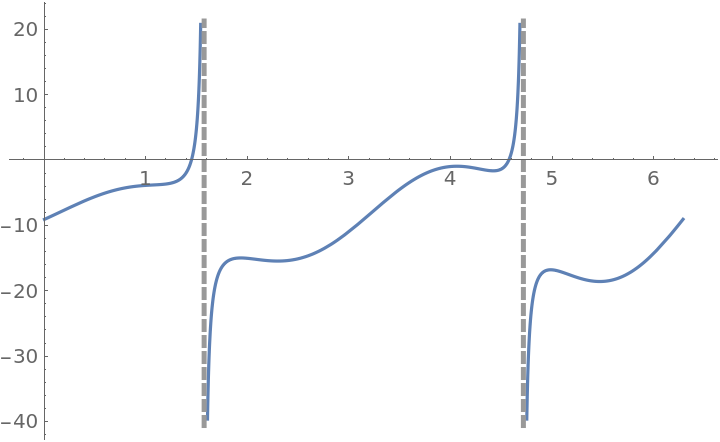
Explicitly list the jump point and add the asymptotes manually:
| In[29]:= |
![f[x_] := \!\(\*
TagBox[GridBox[{
{"\[Piecewise]", GridBox[{
{
RowBox[{
RowBox[{
FractionBox[
RowBox[{
SuperscriptBox["x", "2"], "-", "9"}],
RowBox[{"x", "-", "3"}]],
RowBox[{"Sin", "[",
RowBox[{"2", "x"}], "]"}]}], "+",
RowBox[{"Tan", "[", "x", "]"}], "-", "9"}],
RowBox[{"x", "!=", "3"}]},
{
RowBox[{
RowBox[{"-", "9"}], "+",
RowBox[{"6", " ",
RowBox[{"Sin", "[", "6", "]"}]}], "+",
RowBox[{"Tan", "[", "3", "]"}]}],
RowBox[{"x", "==", "3"}]}
},
AllowedDimensions->{2, Automatic},
Editable->True,
GridBoxAlignment->{
"Columns" -> {{Left}}, "ColumnsIndexed" -> {}, "Rows" -> {{Baseline}}, "RowsIndexed" -> {}},
GridBoxItemSize->{
"Columns" -> {{Automatic}}, "ColumnsIndexed" -> {}, "Rows" -> {{1.}}, "RowsIndexed" -> {}},
GridBoxSpacings->{"Columns" -> {
Offset[0.27999999999999997`], {
Offset[0.84]},
Offset[0.27999999999999997`]}, "ColumnsIndexed" -> {}, "Rows" -> {
Offset[0.2], {
Offset[0.4]},
Offset[0.2]}, "RowsIndexed" -> {}},
Selectable->True]}
},
GridBoxAlignment->{
"Columns" -> {{Left}}, "ColumnsIndexed" -> {}, "Rows" -> {{Baseline}}, "RowsIndexed" -> {}},
GridBoxItemSize->{
"Columns" -> {{Automatic}}, "ColumnsIndexed" -> {}, "Rows" -> {{1.}}, "RowsIndexed" -> {}},
GridBoxSpacings->{"Columns" -> {
Offset[0.27999999999999997`], {
Offset[0.35]},
Offset[0.27999999999999997`]}, "ColumnsIndexed" -> {}, "Rows" -> {
Offset[0.2], {
Offset[0.4]},
Offset[0.2]}, "RowsIndexed" -> {}}],
"Piecewise",
DeleteWithContents->True,
Editable->False,
SelectWithContents->True,
Selectable->False,
StripWrapperBoxes->True]\)
ResourceFunction["EnhancedPlot"][f[x], {x, 0, 2 \[Pi]}, "Exception" -> 3, "Asymptote" -> {\[Pi]/2, (3 \[Pi])/2}]](https://www.wolframcloud.com/obj/resourcesystem/images/ad8/ad846957-ea4b-4872-be92-fa22a1355ebe/2-0-0/067abb1f15b89a75.png)
|
| Out[30]= |

|
Plot a function with a jump discontinuity:
| In[31]:= |
|
| Out[31]= |
|
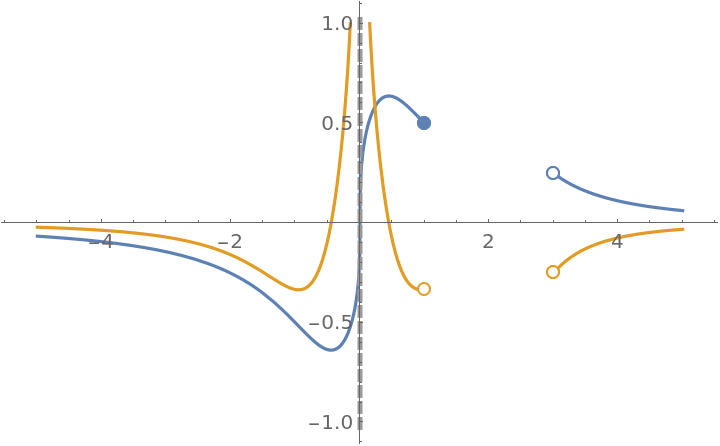
A function with an odd root over a domain consisting of two disjoint intervals with one interval containing negative numbers. Plot the function and its derivative:
| In[32]:= |
![ResourceFunction["EnhancedPlot"][{\!\(\*
TagBox[GridBox[{
{"\[Piecewise]", GridBox[{
{
FractionBox[
SuperscriptBox["x",
RowBox[{"1", "/", "3"}]],
RowBox[{"1", "+",
SuperscriptBox["x", "2"]}]],
RowBox[{"x", "<=", "1"}]},
{
FractionBox["1",
SuperscriptBox[
RowBox[{"(",
RowBox[{"1", "-", "x"}], ")"}], "2"]],
RowBox[{"x", ">", "3"}]}
},
AllowedDimensions->{2, Automatic},
Editable->True,
GridBoxAlignment->{
"Columns" -> {{Left}}, "ColumnsIndexed" -> {}, "Rows" -> {{Baseline}}, "RowsIndexed" -> {}},
GridBoxItemSize->{
"Columns" -> {{Automatic}}, "ColumnsIndexed" -> {}, "Rows" -> {{1.}}, "RowsIndexed" -> {}},
GridBoxSpacings->{"Columns" -> {
Offset[0.27999999999999997`], {
Offset[0.84]},
Offset[0.27999999999999997`]}, "ColumnsIndexed" -> {}, "Rows" -> {
Offset[0.2], {
Offset[0.4]},
Offset[0.2]}, "RowsIndexed" -> {}},
Selectable->True]}
},
GridBoxAlignment->{
"Columns" -> {{Left}}, "ColumnsIndexed" -> {}, "Rows" -> {{Baseline}}, "RowsIndexed" -> {}},
GridBoxItemSize->{
"Columns" -> {{Automatic}}, "ColumnsIndexed" -> {}, "Rows" -> {{1.}}, "RowsIndexed" -> {}},
GridBoxSpacings->{"Columns" -> {
Offset[0.27999999999999997`], {
Offset[0.35]},
Offset[0.27999999999999997`]}, "ColumnsIndexed" -> {}, "Rows" -> {
Offset[0.2], {
Offset[0.4]},
Offset[0.2]}, "RowsIndexed" -> {}}],
"Piecewise",
DeleteWithContents->True,
Editable->False,
SelectWithContents->True,
Selectable->False,
StripWrapperBoxes->True]\) , \!\(\*
TagBox[GridBox[{
{"\[Piecewise]", GridBox[{
{
RowBox[{
RowBox[{"-",
FractionBox[
RowBox[{"2", " ",
SuperscriptBox["x",
RowBox[{"4", "/", "3"}]]}],
SuperscriptBox[
RowBox[{"(",
RowBox[{"1", "+",
SuperscriptBox["x", "2"]}], ")"}], "2"]]}], "+",
FractionBox["1",
RowBox[{"3", " ",
SuperscriptBox["x",
RowBox[{"2", "/", "3"}]], " ",
RowBox[{"(",
RowBox[{"1", "+",
SuperscriptBox["x", "2"]}], ")"}]}]]}],
RowBox[{"x", "<", "1"}]},
{
RowBox[{"-",
FractionBox["2",
SuperscriptBox[
RowBox[{"(",
RowBox[{
RowBox[{"-", "1"}], "+", "x"}], ")"}], "3"]]}],
RowBox[{"x", ">", "3"}]}
},
AllowedDimensions->{2, Automatic},
Editable->True,
GridBoxAlignment->{"Columns" -> {{Left}}, "Rows" -> {{Baseline}}},
GridBoxItemSize->{"Columns" -> {{Automatic}}, "Rows" -> {{1.}}},
GridBoxSpacings->{"Columns" -> {
Offset[0.27999999999999997`], {
Offset[0.84]},
Offset[0.27999999999999997`]}, "Rows" -> {
Offset[0.2], {
Offset[0.4]},
Offset[0.2]}},
Selectable->True]}
},
GridBoxAlignment->{"Columns" -> {{Left}}, "Rows" -> {{Baseline}}},
GridBoxItemSize->{"Columns" -> {{Automatic}}, "Rows" -> {{1.}}},
GridBoxSpacings->{"Columns" -> {
Offset[0.27999999999999997`], {
Offset[0.35]},
Offset[0.27999999999999997`]}, "Rows" -> {
Offset[0.2], {
Offset[0.4]},
Offset[0.2]}}],
"Piecewise",
DeleteWithContents->True,
Editable->False,
SelectWithContents->True,
Selectable->False,
StripWrapperBoxes->True]\)}, {x, -5, 5}, "FindExceptions" -> True, PlotRange -> {-1, 1}]](https://www.wolframcloud.com/obj/resourcesystem/images/ad8/ad846957-ea4b-4872-be92-fa22a1355ebe/2-0-0/3e30ee242d653ac2.png)
|
| Out[32]= |
|
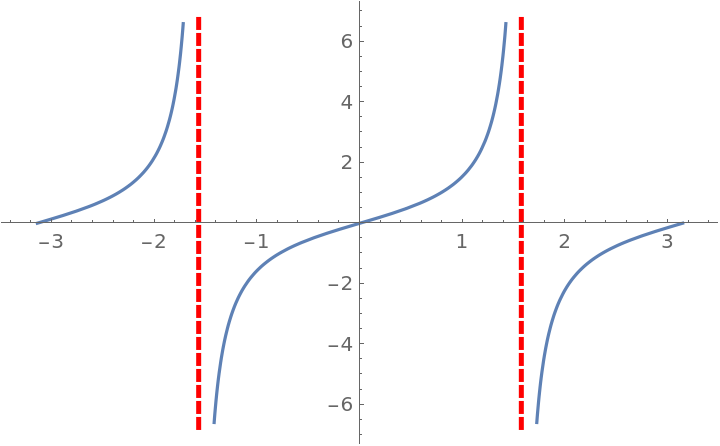
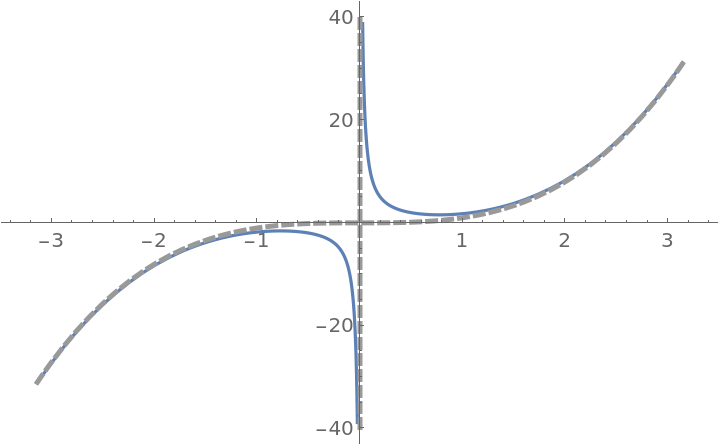
Plot a function with two vertical asymptotes and apply a style to the asymptotes:
| In[33]:= |
![ResourceFunction["EnhancedPlot"][Tan[x], {x, -\[Pi], \[Pi]}, "Asymptote" -> {-(\[Pi]/2), \[Pi]/2}, "AsymptoteStyle" -> {{Dashed, Red}}]](https://www.wolframcloud.com/obj/resourcesystem/images/ad8/ad846957-ea4b-4872-be92-fa22a1355ebe/2-0-0/3dbd0d838c927eee.png)
|
| Out[33]= |
|
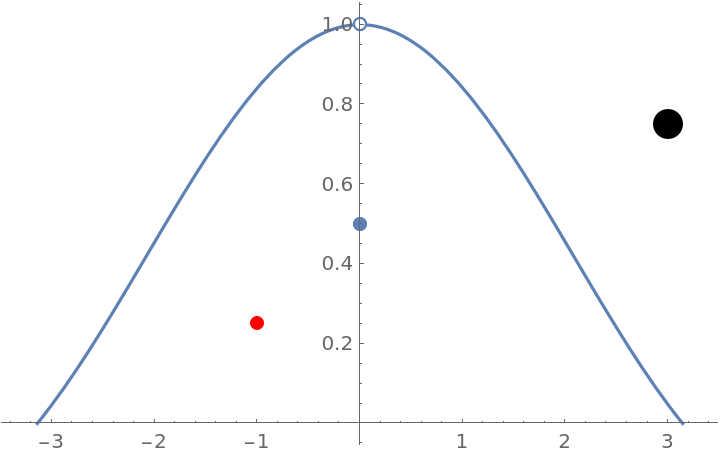
Plot a curve with a removable discontinuity and two points drawn off the curve:
| In[34]:= |
![f[x_] := \!\(\*
TagBox[GridBox[{
{"\[Piecewise]", GridBox[{
{
FractionBox[
RowBox[{"Sin", "[", "x", "]"}], "x"],
RowBox[{"x", "!=", "0"}]},
{".5",
RowBox[{"x", "==", "0"}]}
},
AllowedDimensions->{2, Automatic},
Editable->True,
GridBoxAlignment->{
"Columns" -> {{Left}}, "ColumnsIndexed" -> {}, "Rows" -> {{Baseline}}, "RowsIndexed" -> {}},
GridBoxItemSize->{
"Columns" -> {{Automatic}}, "ColumnsIndexed" -> {}, "Rows" -> {{1.}}, "RowsIndexed" -> {}},
GridBoxSpacings->{"Columns" -> {
Offset[0.27999999999999997`], {
Offset[0.84]},
Offset[0.27999999999999997`]}, "ColumnsIndexed" -> {}, "Rows" -> {
Offset[0.2], {
Offset[0.4]},
Offset[0.2]}, "RowsIndexed" -> {}},
Selectable->True]}
},
GridBoxAlignment->{
"Columns" -> {{Left}}, "ColumnsIndexed" -> {}, "Rows" -> {{Baseline}}, "RowsIndexed" -> {}},
GridBoxItemSize->{
"Columns" -> {{Automatic}}, "ColumnsIndexed" -> {}, "Rows" -> {{1.}}, "RowsIndexed" -> {}},
GridBoxSpacings->{"Columns" -> {
Offset[0.27999999999999997`], {
Offset[0.35]},
Offset[0.27999999999999997`]}, "ColumnsIndexed" -> {}, "Rows" -> {
Offset[0.2], {
Offset[0.4]},
Offset[0.2]}, "RowsIndexed" -> {}}],
"Piecewise",
DeleteWithContents->True,
Editable->False,
SelectWithContents->True,
Selectable->False]\)
ResourceFunction["EnhancedPlot"][f[x], {x, -\[Pi], \[Pi]}, "Exception" -> 0, "DrawPoint" -> {{-1, 1/4}, {3, 3/4}}, "DrawPointStyle" -> {Red, AbsolutePointSize[15]}, AxesOrigin -> {0, 0}]](https://www.wolframcloud.com/obj/resourcesystem/images/ad8/ad846957-ea4b-4872-be92-fa22a1355ebe/2-0-0/75720ff50755f40e.png)
|
| Out[35]= |
|
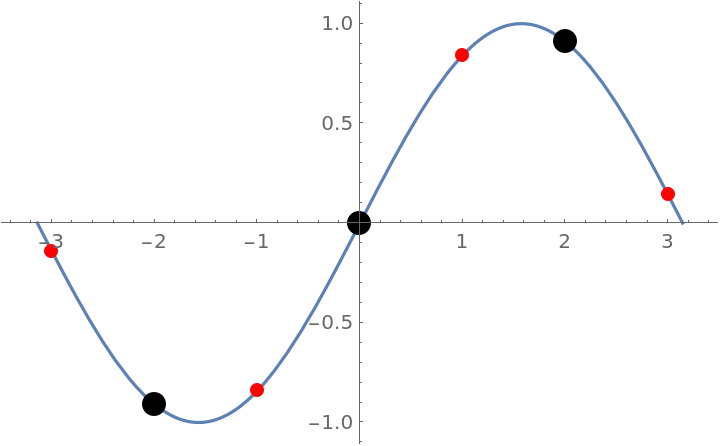
Plot a curve with a removable discontinuity and several points drawn on the curve:
| In[36]:= |
![f[x_] := Sin[x]
ResourceFunction["EnhancedPlot"][f[x], {x, -\[Pi], \[Pi]}, "Exception" -> 0, "DrawPoint" -> Range[-3, 3], "DrawPointStyle" -> {Red, AbsolutePointSize[12]}]](https://www.wolframcloud.com/obj/resourcesystem/images/ad8/ad846957-ea4b-4872-be92-fa22a1355ebe/2-0-0/303b33b2c269a807.png)
|
| Out[37]= |
|
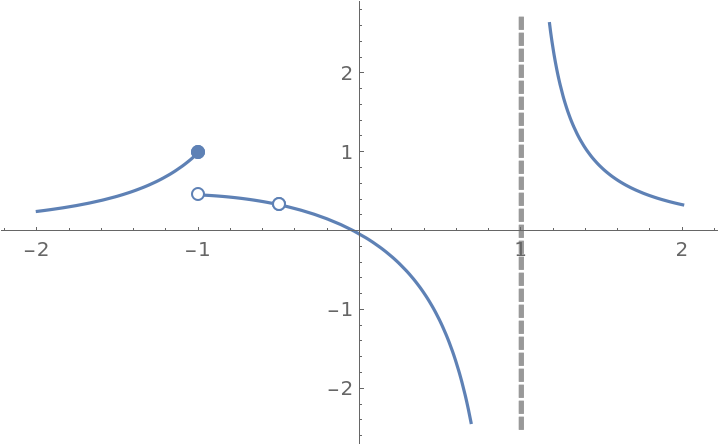
Create a plot with several exceptions: a removable discontinuity (at x=-1/2), a jump discontinuity (at x=-1) and an infinite discontinuity (at x=1):
| In[38]:= |
![Clear[f]
f[x_] := \!\(\*
TagBox[GridBox[{
{"\[Piecewise]", GridBox[{
{
FractionBox["1",
SuperscriptBox["x", "2"]],
RowBox[{"x", "<=",
RowBox[{"-", "1"}]}]},
{
RowBox[{
FractionBox[
RowBox[{"Sin", "[",
RowBox[{"x", "+",
RowBox[{"1", "/", "2"}]}], "]"}],
RowBox[{"x", "+",
RowBox[{"1", "/", "2"}]}]], "+",
FractionBox["1",
RowBox[{"x", "-", "1"}]]}],
RowBox[{
RowBox[{"-", "1"}], "<", "x", "<", "1"}]},
{
FractionBox["1",
RowBox[{
SuperscriptBox["x", "2"], "-", "1"}]],
RowBox[{"x", ">=", "1"}]}
},
AllowedDimensions->{2, Automatic},
Editable->True,
GridBoxAlignment->{
"Columns" -> {{Left}}, "ColumnsIndexed" -> {}, "Rows" -> {{Baseline}}, "RowsIndexed" -> {}},
GridBoxItemSize->{
"Columns" -> {{Automatic}}, "ColumnsIndexed" -> {}, "Rows" -> {{1.}}, "RowsIndexed" -> {}},
GridBoxSpacings->{"Columns" -> {
Offset[0.27999999999999997`], {
Offset[0.84]},
Offset[0.27999999999999997`]}, "ColumnsIndexed" -> {}, "Rows" -> {
Offset[0.2], {
Offset[0.4]},
Offset[0.2]}, "RowsIndexed" -> {}},
Selectable->True]}
},
GridBoxAlignment->{
"Columns" -> {{Left}}, "ColumnsIndexed" -> {}, "Rows" -> {{Baseline}}, "RowsIndexed" -> {}},
GridBoxItemSize->{
"Columns" -> {{Automatic}}, "ColumnsIndexed" -> {}, "Rows" -> {{1.}}, "RowsIndexed" -> {}},
GridBoxSpacings->{"Columns" -> {
Offset[0.27999999999999997`], {
Offset[0.35]},
Offset[0.27999999999999997`]}, "ColumnsIndexed" -> {}, "Rows" -> {
Offset[0.2], {
Offset[0.4]},
Offset[0.2]}, "RowsIndexed" -> {}}],
"Piecewise",
DeleteWithContents->True,
Editable->False,
SelectWithContents->True,
Selectable->False,
StripWrapperBoxes->True]\)
ResourceFunction["EnhancedPlot"][f[x], {x, -2, 2}, "Exception" -> {-1, -1/2}, "Asymptote" -> 1]](https://www.wolframcloud.com/obj/resourcesystem/images/ad8/ad846957-ea4b-4872-be92-fa22a1355ebe/2-0-0/0fe2efeea841882b.png)
|
| Out[39]= |

|
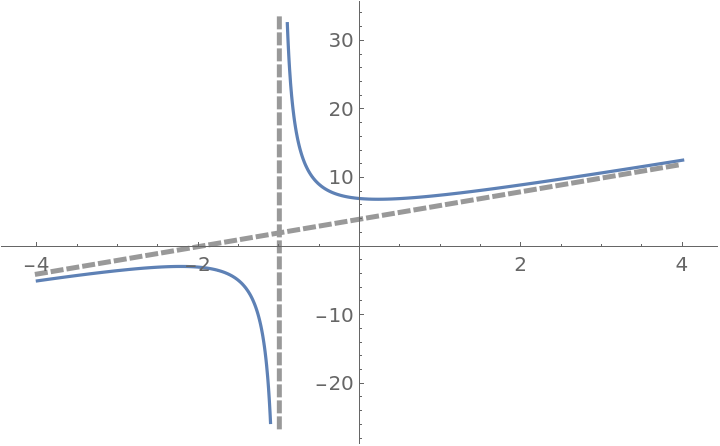
Setting "FindAsymptotes"→True uses the resource function Asymptotes to find the asymptotes (one vertical and one oblique) of the following function:
| In[40]:= |
|
| Out[40]= |
|
Plot a function with asymptotes (vertical and other):
| In[41]:= |
|
| Out[41]= |
|
Setting "FindExceptions"→True uses the resource function FunctionDiscontinuities to find the discontinuities:
| In[42]:= |
![Clear[f]
f[x_] := \!\(\*
TagBox[GridBox[{
{"\[Piecewise]", GridBox[{
{
FractionBox["1",
SuperscriptBox["x", "2"]],
RowBox[{"x", "<=",
RowBox[{"-", "1"}]}]},
{
RowBox[{
FractionBox[
RowBox[{"Sin", "[",
RowBox[{"x", "+",
RowBox[{"1", "/", "2"}]}], "]"}],
RowBox[{"x", "+",
RowBox[{"1", "/", "2"}]}]], "+",
FractionBox["1",
RowBox[{"x", "-", "1"}]]}],
RowBox[{
RowBox[{"-", "1"}], "<", "x", "<", "1"}]},
{
FractionBox["1",
RowBox[{
SuperscriptBox["x", "2"], "-", "1"}]],
RowBox[{"x", ">=", "1"}]}
},
AllowedDimensions->{2, Automatic},
Editable->True,
GridBoxAlignment->{
"Columns" -> {{Left}}, "ColumnsIndexed" -> {}, "Rows" -> {{Baseline}}, "RowsIndexed" -> {}},
GridBoxItemSize->{
"Columns" -> {{Automatic}}, "ColumnsIndexed" -> {}, "Rows" -> {{1.}}, "RowsIndexed" -> {}},
GridBoxSpacings->{"Columns" -> {
Offset[0.27999999999999997`], {
Offset[0.84]},
Offset[0.27999999999999997`]}, "ColumnsIndexed" -> {}, "Rows" -> {
Offset[0.2], {
Offset[0.4]},
Offset[0.2]}, "RowsIndexed" -> {}},
Selectable->True]}
},
GridBoxAlignment->{
"Columns" -> {{Left}}, "ColumnsIndexed" -> {}, "Rows" -> {{Baseline}}, "RowsIndexed" -> {}},
GridBoxItemSize->{
"Columns" -> {{Automatic}}, "ColumnsIndexed" -> {}, "Rows" -> {{1.}}, "RowsIndexed" -> {}},
GridBoxSpacings->{"Columns" -> {
Offset[0.27999999999999997`], {
Offset[0.35]},
Offset[0.27999999999999997`]}, "ColumnsIndexed" -> {}, "Rows" -> {
Offset[0.2], {
Offset[0.4]},
Offset[0.2]}, "RowsIndexed" -> {}}],
"Piecewise",
DeleteWithContents->True,
Editable->False,
SelectWithContents->True,
Selectable->False,
StripWrapperBoxes->True]\)
ResourceFunction["EnhancedPlot"][f[x], {x, -2, 2}, "FindExceptions" -> True, "Asymptote" -> 1]](https://www.wolframcloud.com/obj/resourcesystem/images/ad8/ad846957-ea4b-4872-be92-fa22a1355ebe/2-0-0/39d46a90923426f6.png)
|
| Out[43]= |
|
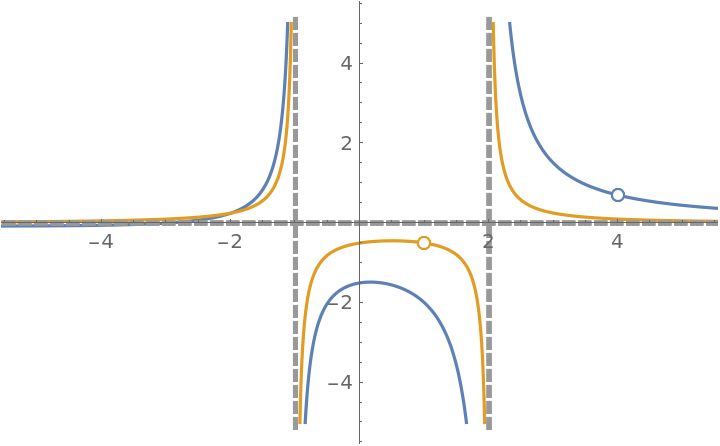
Plot two functions:
| In[44]:= |
![f[x_] := (-12 - x + x^2)/(8 + 2 x - 5 x^2 + x^3);
ResourceFunction["EnhancedPlot", ResourceVersion->"2.0.0"][{f[x], (x - 1)/((x - 1) (x^2 - x - 2))}, {x, -6, 6}, "FindExceptions" -> True, "FindAsymptotes" -> True, PlotRange -> 5]](https://www.wolframcloud.com/obj/resourcesystem/images/ad8/ad846957-ea4b-4872-be92-fa22a1355ebe/2-0-0/01d2815fe485dc1b.png)
|
| Out[45]= |
|
If a point is listed as an exception but isn’t an exception, then a solid point is plotted on the graph:
| In[46]:= |
|
| Out[46]= |
|
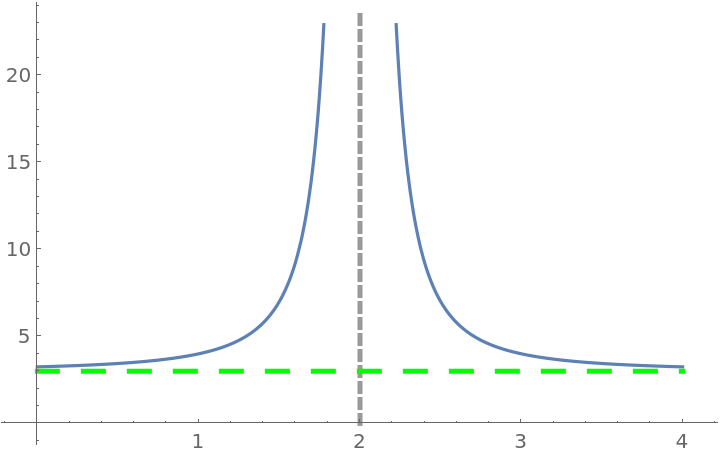
Plot a function with its horizontal asymptote:
| In[47]:= |
![ResourceFunction["EnhancedPlot"][1/(x - 2)^2 + 3, {x, 0, 4}, "Asymptote" -> {2}, "HorizontalAsymptote" -> 3, "HorizontalAsymptoteStyle" -> {{Green, Dashing[Large]}}, AxesOrigin -> {0, 0}]](https://www.wolframcloud.com/obj/resourcesystem/images/ad8/ad846957-ea4b-4872-be92-fa22a1355ebe/2-0-0/1d576fc91d644425.png)
|
| Out[47]= |
|
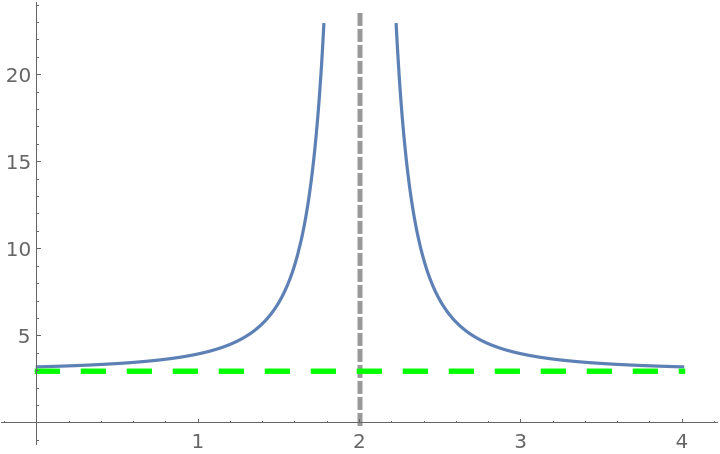
| In[48]:= |
![ResourceFunction["EnhancedPlot"][1/(x - 2)^2 + 3, {x, 0, 4}, "FindAsymptotes" -> True, "HorizontalAsymptoteStyle" -> {{Green, Dashing[Large]}}, AxesOrigin -> {0, 0}]](https://www.wolframcloud.com/obj/resourcesystem/images/ad8/ad846957-ea4b-4872-be92-fa22a1355ebe/2-0-0/570d00b3dd118c76.png)
|
| Out[48]= |
|
Make the points bigger:
| In[49]:= |
![Clear[f]
f[x_] := \!\(\*
TagBox[GridBox[{
{"\[Piecewise]", GridBox[{
{
FractionBox["1",
RowBox[{"1", "+", "x"}]],
RowBox[{"x", "<",
RowBox[{"-", "1"}]}]},
{
RowBox[{"x", "-",
SuperscriptBox["x", "2"]}],
RowBox[{
RowBox[{"-", "1"}], "<", "x", "<", "2"}]},
{
RowBox[{
FractionBox["1", "2"],
RowBox[{"(",
RowBox[{"1", "-", "x"}], ")"}]}],
RowBox[{"2", "<=", "x", "<", "3"}]},
{
RowBox[{"Cos", "[",
RowBox[{"\[Pi]", " ", "x"}], "]"}],
RowBox[{"3", "<", "x", "<=", "4"}]}
},
AllowedDimensions->{2, Automatic},
Editable->True,
GridBoxAlignment->{"Columns" -> {{Left}}, "Rows" -> {{Baseline}}},
GridBoxItemSize->{"Columns" -> {{Automatic}}, "Rows" -> {{1.}}},
GridBoxSpacings->{"Columns" -> {
Offset[0.27999999999999997`], {
Offset[0.84]},
Offset[0.27999999999999997`]}, "Rows" -> {
Offset[0.2], {
Offset[0.4]},
Offset[0.2]}},
Selectable->True]}
},
GridBoxAlignment->{"Columns" -> {{Left}}, "Rows" -> {{Baseline}}},
GridBoxItemSize->{"Columns" -> {{Automatic}}, "Rows" -> {{1.}}},
GridBoxSpacings->{"Columns" -> {
Offset[0.27999999999999997`], {
Offset[0.35]},
Offset[0.27999999999999997`]}, "Rows" -> {
Offset[0.2], {
Offset[0.4]},
Offset[0.2]}}],
"Piecewise",
DeleteWithContents->True,
Editable->False,
SelectWithContents->True,
Selectable->False,
StripWrapperBoxes->True]\)
ResourceFunction["EnhancedPlot"][f[x], {x, -4, 4}, "FindExceptions" -> True, "HorizontalAsymptote" -> 0, "PointStyle" -> AbsolutePointSize[12]]](https://www.wolframcloud.com/obj/resourcesystem/images/ad8/ad846957-ea4b-4872-be92-fa22a1355ebe/2-0-0/352883624b44cdce.png)
|
| Out[50]= |
|
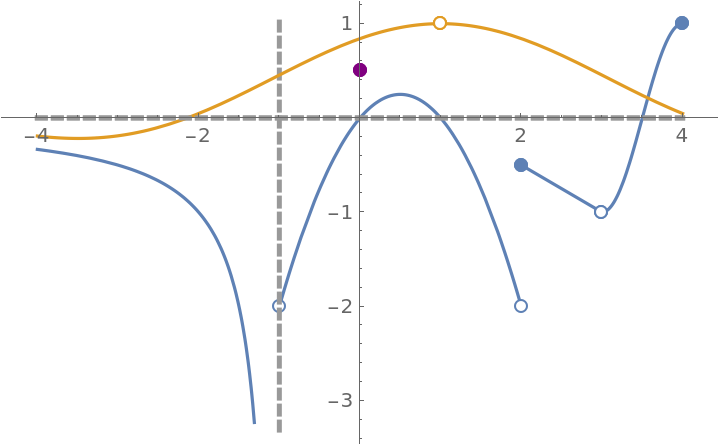
| In[51]:= |
![Clear[f]
f[x_] := \!\(\*
TagBox[GridBox[{
{"\[Piecewise]", GridBox[{
{
FractionBox["1",
RowBox[{"1", "+", "x"}]],
RowBox[{"x", "<",
RowBox[{"-", "1"}]}]},
{
RowBox[{"x", "-",
SuperscriptBox["x", "2"]}],
RowBox[{
RowBox[{"-", "1"}], "<", "x", "<", "2"}]},
{
RowBox[{
FractionBox["1", "2"],
RowBox[{"(",
RowBox[{"1", "-", "x"}], ")"}]}],
RowBox[{"2", "<=", "x", "<", "3"}]},
{
RowBox[{"Cos", "[",
RowBox[{"\[Pi]", " ", "x"}], "]"}],
RowBox[{"3", "<", "x", "<=", "4"}]}
},
AllowedDimensions->{2, Automatic},
Editable->True,
GridBoxAlignment->{"Columns" -> {{Left}}, "Rows" -> {{Baseline}}},
GridBoxItemSize->{"Columns" -> {{Automatic}}, "Rows" -> {{1.}}},
GridBoxSpacings->{"Columns" -> {
Offset[0.27999999999999997`], {
Offset[0.84]},
Offset[0.27999999999999997`]}, "Rows" -> {
Offset[0.2], {
Offset[0.4]},
Offset[0.2]}},
Selectable->True]}
},
GridBoxAlignment->{"Columns" -> {{Left}}, "Rows" -> {{Baseline}}},
GridBoxItemSize->{"Columns" -> {{Automatic}}, "Rows" -> {{1.}}},
GridBoxSpacings->{"Columns" -> {
Offset[0.27999999999999997`], {
Offset[0.35]},
Offset[0.27999999999999997`]}, "Rows" -> {
Offset[0.2], {
Offset[0.4]},
Offset[0.2]}}],
"Piecewise",
DeleteWithContents->True,
Editable->False,
SelectWithContents->True,
Selectable->False,
StripWrapperBoxes->True]\)
ResourceFunction["EnhancedPlot", ResourceVersion->"2.0.0"][{f[x], Sin[x - 1]/(x - 1)}, {x, -4, 4}, "FindExceptions" -> True, "HorizontalAsymptote" -> 0, "DrawPoint" -> {{0, 1/2}}, "DrawPointStyle" -> Purple]](https://www.wolframcloud.com/obj/resourcesystem/images/ad8/ad846957-ea4b-4872-be92-fa22a1355ebe/2-0-0/075557ee2c147d9d.png)
|
| Out[52]= |
|
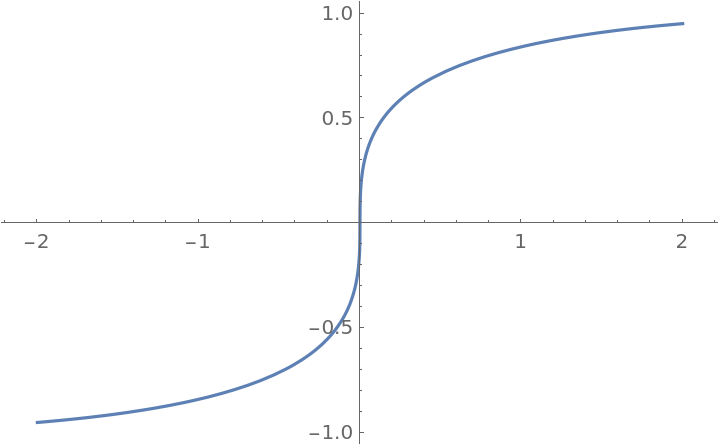
By default, the Wolfram Language returns the principal root of a number. If the number is real and negative and the root is odd, then the principal root is an imaginary number. Setting "PowerBehavior" to Real (the default) will force EnhancedPlot to plot the positive root:
| In[53]:= |
|
| Out[53]= |
|
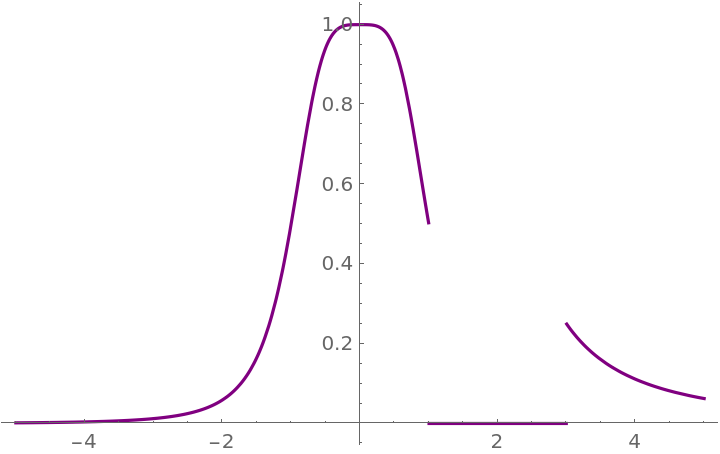
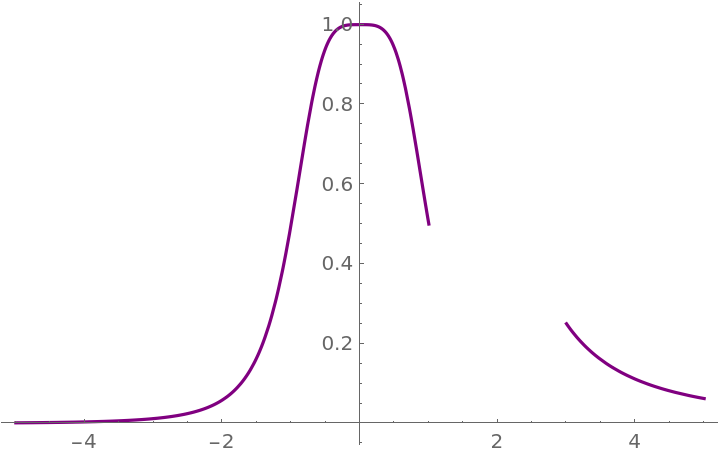
By default, the Wolfram Language does not produce a correct plot of a piecewise function whose domain consists of disjoint intervals. The reason is that it uses 0 as the default value if none of the conditions apply:
| In[54]:= |
![Clear[f]
f[x_] := \!\(\*
TagBox[GridBox[{
{"\[Piecewise]", GridBox[{
{
FractionBox["1",
RowBox[{"1", "+",
SuperscriptBox["x", "4"]}]],
RowBox[{"x", "<", "1"}]},
{
FractionBox["1",
SuperscriptBox[
RowBox[{"(",
RowBox[{"1", "-", "x"}], ")"}], "2"]],
RowBox[{"x", ">", "3"}]}
},
AllowedDimensions->{2, Automatic},
Editable->True,
GridBoxAlignment->{
"Columns" -> {{Left}}, "ColumnsIndexed" -> {}, "Rows" -> {{Baseline}}, "RowsIndexed" -> {}},
GridBoxItemSize->{
"Columns" -> {{Automatic}}, "ColumnsIndexed" -> {}, "Rows" -> {{1.}}, "RowsIndexed" -> {}},
GridBoxSpacings->{"Columns" -> {
Offset[0.27999999999999997`], {
Offset[0.84]},
Offset[0.27999999999999997`]}, "ColumnsIndexed" -> {}, "Rows" -> {
Offset[0.2], {
Offset[0.4]},
Offset[0.2]}, "RowsIndexed" -> {}},
Selectable->True]}
},
GridBoxAlignment->{
"Columns" -> {{Left}}, "ColumnsIndexed" -> {}, "Rows" -> {{Baseline}}, "RowsIndexed" -> {}},
GridBoxItemSize->{
"Columns" -> {{Automatic}}, "ColumnsIndexed" -> {}, "Rows" -> {{1.}}, "RowsIndexed" -> {}},
GridBoxSpacings->{"Columns" -> {
Offset[0.27999999999999997`], {
Offset[0.35]},
Offset[0.27999999999999997`]}, "ColumnsIndexed" -> {}, "Rows" -> {
Offset[0.2], {
Offset[0.4]},
Offset[0.2]}, "RowsIndexed" -> {}}],
"Piecewise",
DeleteWithContents->True,
Editable->False,
SelectWithContents->True,
Selectable->False,
StripWrapperBoxes->True]\)
Plot[f[x], {x, -5, 5}, PlotStyle -> Purple]](https://www.wolframcloud.com/obj/resourcesystem/images/ad8/ad846957-ea4b-4872-be92-fa22a1355ebe/2-0-0/3b6ebbe3806715e2.png)
|
| Out[55]= |
|
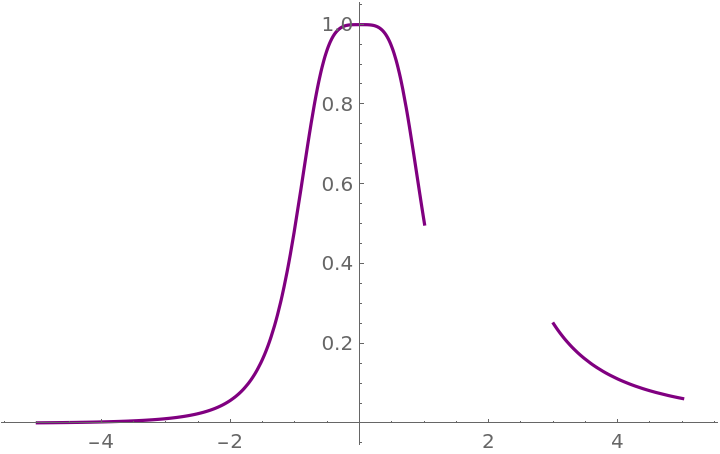
A correct plot is obtained by manually setting the default value of the Piecewise to Null:
| In[56]:= |
![Clear[f]
f[x_] := \!\(\*
TagBox[GridBox[{
{"\[Piecewise]", GridBox[{
{
FractionBox["1",
RowBox[{"1", "+",
SuperscriptBox["x", "4"]}]],
RowBox[{"x", "<", "1"}]},
{
FractionBox["1",
SuperscriptBox[
RowBox[{"(",
RowBox[{"1", "-", "x"}], ")"}], "2"]],
RowBox[{"x", ">", "3"}]},
{"Null", "True"}
},
AllowedDimensions->{2, Automatic},
Editable->True,
GridBoxAlignment->{
"Columns" -> {{Left}}, "ColumnsIndexed" -> {}, "Rows" -> {{Baseline}}, "RowsIndexed" -> {}},
GridBoxItemSize->{
"Columns" -> {{Automatic}}, "ColumnsIndexed" -> {}, "Rows" -> {{1.}}, "RowsIndexed" -> {}},
GridBoxSpacings->{"Columns" -> {
Offset[0.27999999999999997`], {
Offset[0.84]},
Offset[0.27999999999999997`]}, "ColumnsIndexed" -> {}, "Rows" -> {
Offset[0.2], {
Offset[0.4]},
Offset[0.2]}, "RowsIndexed" -> {}},
Selectable->True]}
},
GridBoxAlignment->{
"Columns" -> {{Left}}, "ColumnsIndexed" -> {}, "Rows" -> {{Baseline}}, "RowsIndexed" -> {}},
GridBoxItemSize->{
"Columns" -> {{Automatic}}, "ColumnsIndexed" -> {}, "Rows" -> {{1.}}, "RowsIndexed" -> {}},
GridBoxSpacings->{"Columns" -> {
Offset[0.27999999999999997`], {
Offset[0.35]},
Offset[0.27999999999999997`]}, "ColumnsIndexed" -> {}, "Rows" -> {
Offset[0.2], {
Offset[0.4]},
Offset[0.2]}, "RowsIndexed" -> {}}],
"Piecewise",
DeleteWithContents->True,
Editable->False,
SelectWithContents->True,
Selectable->False,
StripWrapperBoxes->True]\)
Plot[f[x], {x, -5, 5}, PlotStyle -> Purple]](https://www.wolframcloud.com/obj/resourcesystem/images/ad8/ad846957-ea4b-4872-be92-fa22a1355ebe/2-0-0/000dd263941f61c1.png)
|
| Out[57]= |
|
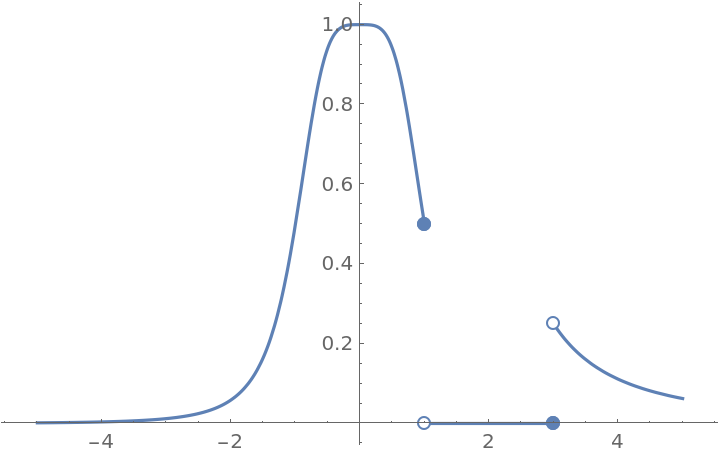
EnhancedPlot automatically sets the default value of Piecewise to Null:
| In[58]:= |
![Clear[f]
f[x_] := \!\(\*
TagBox[GridBox[{
{"\[Piecewise]", GridBox[{
{
FractionBox["1",
RowBox[{"1", "+",
SuperscriptBox["x", "4"]}]],
RowBox[{"x", "<=", "1"}]},
{
FractionBox["1",
SuperscriptBox[
RowBox[{"(",
RowBox[{"1", "-", "x"}], ")"}], "2"]],
RowBox[{"x", ">=", "3"}]}
},
AllowedDimensions->{2, Automatic},
Editable->True,
GridBoxAlignment->{
"Columns" -> {{Left}}, "ColumnsIndexed" -> {}, "Rows" -> {{Baseline}}, "RowsIndexed" -> {}},
GridBoxItemSize->{
"Columns" -> {{Automatic}}, "ColumnsIndexed" -> {}, "Rows" -> {{1.}}, "RowsIndexed" -> {}},
GridBoxSpacings->{"Columns" -> {
Offset[0.27999999999999997`], {
Offset[0.84]},
Offset[0.27999999999999997`]}, "ColumnsIndexed" -> {}, "Rows" -> {
Offset[0.2], {
Offset[0.4]},
Offset[0.2]}, "RowsIndexed" -> {}},
Selectable->True]}
},
GridBoxAlignment->{
"Columns" -> {{Left}}, "ColumnsIndexed" -> {}, "Rows" -> {{Baseline}}, "RowsIndexed" -> {}},
GridBoxItemSize->{
"Columns" -> {{Automatic}}, "ColumnsIndexed" -> {}, "Rows" -> {{1.}}, "RowsIndexed" -> {}},
GridBoxSpacings->{"Columns" -> {
Offset[0.27999999999999997`], {
Offset[0.35]},
Offset[0.27999999999999997`]}, "ColumnsIndexed" -> {}, "Rows" -> {
Offset[0.2], {
Offset[0.4]},
Offset[0.2]}, "RowsIndexed" -> {}}],
"Piecewise",
DeleteWithContents->True,
Editable->False,
SelectWithContents->True,
Selectable->False,
StripWrapperBoxes->True]\)
ResourceFunction["EnhancedPlot"][f[x], {x, -5, 5}, PlotStyle -> Purple]](https://www.wolframcloud.com/obj/resourcesystem/images/ad8/ad846957-ea4b-4872-be92-fa22a1355ebe/2-0-0/63f1cb19ff1009f9.png)
|
| Out[59]= |
|
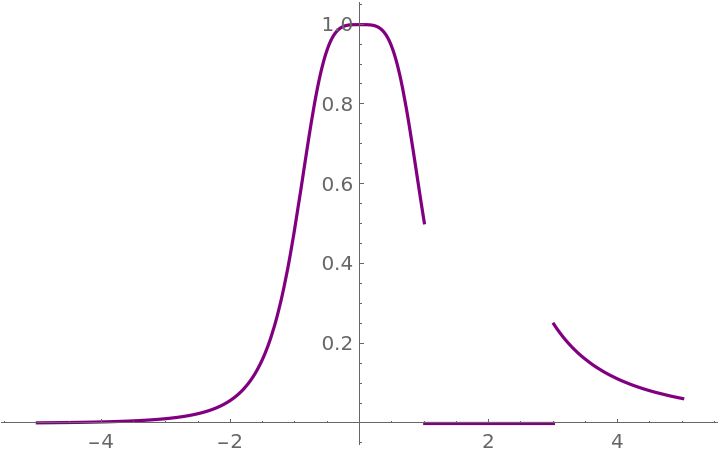
Return default Plot behavior by setting the option "ZeroToNull" to False:
| In[60]:= |
![Clear[f]
f[x_] := \!\(\*
TagBox[GridBox[{
{"\[Piecewise]", GridBox[{
{
FractionBox["1",
RowBox[{"1", "+",
SuperscriptBox["x", "4"]}]],
RowBox[{"x", "<=", "1"}]},
{
FractionBox["1",
SuperscriptBox[
RowBox[{"(",
RowBox[{"1", "-", "x"}], ")"}], "2"]],
RowBox[{"x", ">", "3"}]}
},
AllowedDimensions->{2, Automatic},
Editable->True,
GridBoxAlignment->{
"Columns" -> {{Left}}, "ColumnsIndexed" -> {}, "Rows" -> {{Baseline}}, "RowsIndexed" -> {}},
GridBoxItemSize->{
"Columns" -> {{Automatic}}, "ColumnsIndexed" -> {}, "Rows" -> {{1.}}, "RowsIndexed" -> {}},
GridBoxSpacings->{"Columns" -> {
Offset[0.27999999999999997`], {
Offset[0.84]},
Offset[0.27999999999999997`]}, "ColumnsIndexed" -> {}, "Rows" -> {
Offset[0.2], {
Offset[0.4]},
Offset[0.2]}, "RowsIndexed" -> {}},
Selectable->True]}
},
GridBoxAlignment->{
"Columns" -> {{Left}}, "ColumnsIndexed" -> {}, "Rows" -> {{Baseline}}, "RowsIndexed" -> {}},
GridBoxItemSize->{
"Columns" -> {{Automatic}}, "ColumnsIndexed" -> {}, "Rows" -> {{1.}}, "RowsIndexed" -> {}},
GridBoxSpacings->{"Columns" -> {
Offset[0.27999999999999997`], {
Offset[0.35]},
Offset[0.27999999999999997`]}, "ColumnsIndexed" -> {}, "Rows" -> {
Offset[0.2], {
Offset[0.4]},
Offset[0.2]}, "RowsIndexed" -> {}}],
"Piecewise",
DeleteWithContents->True,
Editable->False,
SelectWithContents->True,
Selectable->False,
StripWrapperBoxes->True]\)
ResourceFunction["EnhancedPlot"][f[x], {x, -5, 5}, PlotStyle -> Purple, "ZeroToNull" -> False]](https://www.wolframcloud.com/obj/resourcesystem/images/ad8/ad846957-ea4b-4872-be92-fa22a1355ebe/2-0-0/2650a0cc7a14d2eb.png)
|
| Out[61]= |
|
Note that with the option "ZeroToNull" set to False, "FindExceptions" will list the break points as jump discontinuities:
| In[62]:= |
|
| Out[62]= |
|
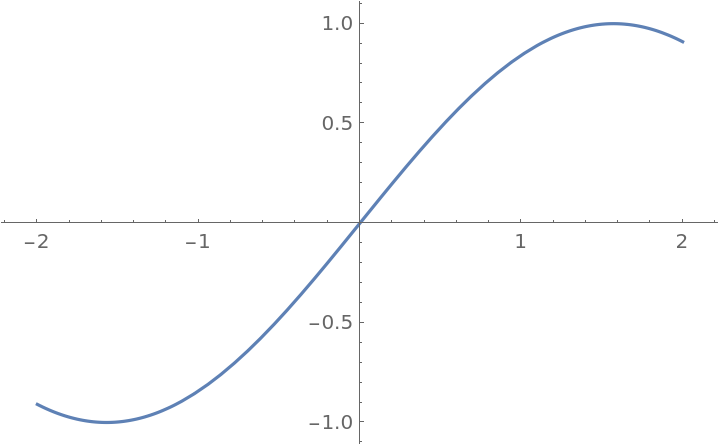
The resource function Asymptotes can be very slow:
| In[63]:= |
![Clear[f]
f[x_] := \!\(\*
TagBox[GridBox[{
{"\[Piecewise]", GridBox[{
{
RowBox[{
FractionBox["1",
RowBox[{"1", "+",
SuperscriptBox["x", "2"]}]], "+", "x"}],
RowBox[{"x", "<",
RowBox[{"-", "1"}]}]},
{
RowBox[{
SuperscriptBox["x",
RowBox[{"5", "/", "3"}]], "-", "1"}],
RowBox[{
RowBox[{"-", "1"}], "<=", "x", "<", "2"}]},
{
RowBox[{"1", "/", "x"}],
RowBox[{"2", "<", "x", "<", "3"}]},
{
RowBox[{"Cos", "[", "x", "]"}],
RowBox[{"3", "<", "x", "<", "4"}]}
},
AllowedDimensions->{2, Automatic},
Editable->True,
GridBoxAlignment->{"Columns" -> {{Left}}, "Rows" -> {{Baseline}}},
GridBoxItemSize->{"Columns" -> {{Automatic}}, "Rows" -> {{1.}}},
GridBoxSpacings->{"Columns" -> {
Offset[0.27999999999999997`], {
Offset[0.84]},
Offset[0.27999999999999997`]}, "Rows" -> {
Offset[0.2], {
Offset[0.4]},
Offset[0.2]}},
Selectable->True]}
},
GridBoxAlignment->{"Columns" -> {{Left}}, "Rows" -> {{Baseline}}},
GridBoxItemSize->{"Columns" -> {{Automatic}}, "Rows" -> {{1.}}},
GridBoxSpacings->{"Columns" -> {
Offset[0.27999999999999997`], {
Offset[0.35]},
Offset[0.27999999999999997`]}, "Rows" -> {
Offset[0.2], {
Offset[0.4]},
Offset[0.2]}}],
"Piecewise",
DeleteWithContents->True,
Editable->False,
SelectWithContents->True,
Selectable->False,
StripWrapperBoxes->True]\)
ResourceFunction["Asymptotes"][f[x], x, y]](https://www.wolframcloud.com/obj/resourcesystem/images/ad8/ad846957-ea4b-4872-be92-fa22a1355ebe/2-0-0/10462d8ef6c379e1.png)
|
| Out[64]= |
|
This contributes a significant amount of time to EnhancedPlot if the setting "FindAsymptotes"→True is used:
| In[65]:= |
![Clear[f]
f[x_] := \!\(\*
TagBox[GridBox[{
{"\[Piecewise]", GridBox[{
{
RowBox[{
FractionBox["1",
RowBox[{"1", "+",
SuperscriptBox["x", "2"]}]], "+", "x"}],
RowBox[{"x", "<", "0"}]},
{
RowBox[{
SuperscriptBox["x",
RowBox[{"5", "/", "3"}]], "-", "1"}],
RowBox[{"0", "<=", "x", "<", "2"}]},
{
RowBox[{"1", "/", "x"}],
RowBox[{"2", "<", "x", "<", "3"}]},
{
RowBox[{"Cos", "[", "x", "]"}],
RowBox[{"3", "<", "x", "<", "4"}]}
},
AllowedDimensions->{2, Automatic},
Editable->True,
GridBoxAlignment->{"Columns" -> {{Left}}, "Rows" -> {{Baseline}}},
GridBoxItemSize->{"Columns" -> {{Automatic}}, "Rows" -> {{1.}}},
GridBoxSpacings->{"Columns" -> {
Offset[0.27999999999999997`], {
Offset[0.84]},
Offset[0.27999999999999997`]}, "Rows" -> {
Offset[0.2], {
Offset[0.4]},
Offset[0.2]}},
Selectable->True]}
},
GridBoxAlignment->{"Columns" -> {{Left}}, "Rows" -> {{Baseline}}},
GridBoxItemSize->{"Columns" -> {{Automatic}}, "Rows" -> {{1.}}},
GridBoxSpacings->{"Columns" -> {
Offset[0.27999999999999997`], {
Offset[0.35]},
Offset[0.27999999999999997`]}, "Rows" -> {
Offset[0.2], {
Offset[0.4]},
Offset[0.2]}}],
"Piecewise",
DeleteWithContents->True,
Editable->False,
SelectWithContents->True,
Selectable->False,
StripWrapperBoxes->True]\)
ResourceFunction["EnhancedPlot"][f[x], {x, -4, 4}, "FindExceptions" -> True, "FindAsymptotes" -> True]](https://www.wolframcloud.com/obj/resourcesystem/images/ad8/ad846957-ea4b-4872-be92-fa22a1355ebe/2-0-0/48b735ccb0809901.png)
|
| Out[66]= |
|
On the other hand, "FindExceptions" is very fast:
| In[67]:= |
![Clear[f]
f[x_] := \!\(\*
TagBox[GridBox[{
{"\[Piecewise]", GridBox[{
{
RowBox[{
FractionBox["1",
RowBox[{"1", "+",
SuperscriptBox["x", "2"]}]], "+", "x"}],
RowBox[{"x", "<", "0"}]},
{
RowBox[{
SuperscriptBox["x",
RowBox[{"5", "/", "3"}]], "-", "1"}],
RowBox[{"0", "<=", "x", "<", "2"}]},
{
RowBox[{"1", "/", "x"}],
RowBox[{"2", "<", "x", "<", "3"}]},
{
RowBox[{"Cos", "[", "x", "]"}],
RowBox[{"3", "<", "x", "<", "4"}]}
},
AllowedDimensions->{2, Automatic},
Editable->True,
GridBoxAlignment->{"Columns" -> {{Left}}, "Rows" -> {{Baseline}}},
GridBoxItemSize->{"Columns" -> {{Automatic}}, "Rows" -> {{1.}}},
GridBoxSpacings->{"Columns" -> {
Offset[0.27999999999999997`], {
Offset[0.84]},
Offset[0.27999999999999997`]}, "Rows" -> {
Offset[0.2], {
Offset[0.4]},
Offset[0.2]}},
Selectable->True]}
},
GridBoxAlignment->{"Columns" -> {{Left}}, "Rows" -> {{Baseline}}},
GridBoxItemSize->{"Columns" -> {{Automatic}}, "Rows" -> {{1.}}},
GridBoxSpacings->{"Columns" -> {
Offset[0.27999999999999997`], {
Offset[0.35]},
Offset[0.27999999999999997`]}, "Rows" -> {
Offset[0.2], {
Offset[0.4]},
Offset[0.2]}}],
"Piecewise",
DeleteWithContents->True,
Editable->False,
SelectWithContents->True,
Selectable->False,
StripWrapperBoxes->True]\)
ResourceFunction["EnhancedPlot"][f[x], {x, -4, 4}, "FindExceptions" -> True]](https://www.wolframcloud.com/obj/resourcesystem/images/ad8/ad846957-ea4b-4872-be92-fa22a1355ebe/2-0-0/61d7ac86276f115c.png)
|
| Out[68]= |

|
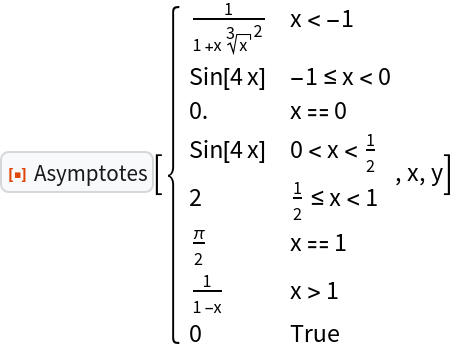
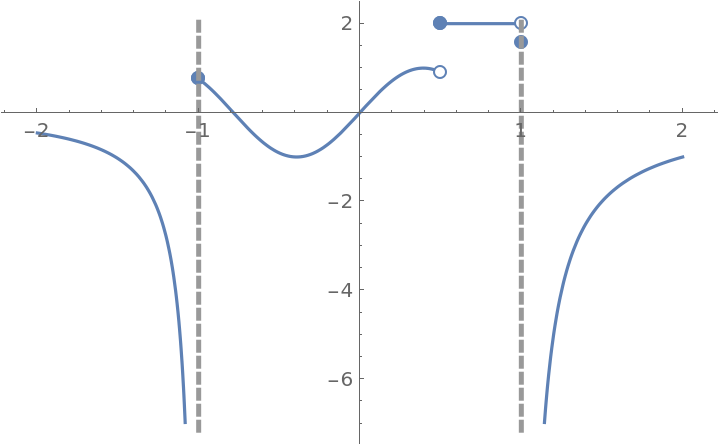
The resource function Asymptotes can miss the asymptotes of some functions:
| In[69]:= |
![Clear[f]
f[x_] := \!\(\*
TagBox[GridBox[{
{"\[Piecewise]", GridBox[{
{
FractionBox["1",
RowBox[{"1", "+",
RowBox[{"x", " ",
SuperscriptBox[
RadicalBox["x", "3",
MultilineFunction->None,
SurdForm->True], "2"]}]}]],
RowBox[{"x", "<",
RowBox[{"-", "1"}]}]},
{
RowBox[{"Sin", "[",
RowBox[{"4", " ", "x"}], "]"}],
RowBox[{
RowBox[{"-", "1"}], "<=", "x", "<", "0"}]},
{"0",
RowBox[{"x", "==", "0"}]},
{
RowBox[{"Sin", "[",
RowBox[{"4", " ", "x"}], "]"}],
RowBox[{"0", "<", "x", "<",
FractionBox["1", "2"]}]},
{"2",
RowBox[{
FractionBox["1", "2"], "<=", "x", "<", "1"}]},
{
FractionBox["\[Pi]", "2"],
RowBox[{"x", "==", "1"}]},
{
FractionBox["1",
RowBox[{"1", "-", "x"}]],
RowBox[{"x", ">", "1"}]}
},
AllowedDimensions->{2, Automatic},
Editable->True,
GridBoxAlignment->{"Columns" -> {{Left}}, "Rows" -> {{Baseline}}},
GridBoxItemSize->{"Columns" -> {{Automatic}}, "Rows" -> {{1.}}},
GridBoxSpacings->{"Columns" -> {
Offset[0.27999999999999997`], {
Offset[0.84]},
Offset[0.27999999999999997`]}, "Rows" -> {
Offset[0.2], {
Offset[0.4]},
Offset[0.2]}},
Selectable->True]}
},
GridBoxAlignment->{"Columns" -> {{Left}}, "Rows" -> {{Baseline}}},
GridBoxItemSize->{"Columns" -> {{Automatic}}, "Rows" -> {{1.}}},
GridBoxSpacings->{"Columns" -> {
Offset[0.27999999999999997`], {
Offset[0.35]},
Offset[0.27999999999999997`]}, "Rows" -> {
Offset[0.2], {
Offset[0.4]},
Offset[0.2]}}],
"Piecewise",
DeleteWithContents->True,
Editable->False,
SelectWithContents->True,
Selectable->False,
StripWrapperBoxes->True]\)
ResourceFunction["Asymptotes"][f[x], x, y]](https://www.wolframcloud.com/obj/resourcesystem/images/ad8/ad846957-ea4b-4872-be92-fa22a1355ebe/2-0-0/0eeb5f981910fa0b.png)
|
| Out[70]= |
|
The resource function FunctionDiscontinuities will find the exceptions:
| In[71]:= |
![Clear[f]
f[x_] := \!\(\*
TagBox[GridBox[{
{"\[Piecewise]", GridBox[{
{
FractionBox["1",
RowBox[{"1", "+",
RowBox[{"x", " ",
SuperscriptBox[
RadicalBox["x", "3",
MultilineFunction->None,
SurdForm->True], "2"]}]}]],
RowBox[{"x", "<",
RowBox[{"-", "1"}]}]},
{
RowBox[{"Sin", "[",
RowBox[{"4", " ", "x"}], "]"}],
RowBox[{
RowBox[{"-", "1"}], "<=", "x", "<", "0"}]},
{"0",
RowBox[{"x", "==", "0"}]},
{
RowBox[{"Sin", "[",
RowBox[{"4", " ", "x"}], "]"}],
RowBox[{"0", "<", "x", "<",
FractionBox["1", "2"]}]},
{"2",
RowBox[{
FractionBox["1", "2"], "<=", "x", "<", "1"}]},
{
FractionBox["\[Pi]", "2"],
RowBox[{"x", "==", "1"}]},
{
FractionBox["1",
RowBox[{"1", "-", "x"}]],
RowBox[{"x", ">", "1"}]}
},
AllowedDimensions->{2, Automatic},
Editable->True,
GridBoxAlignment->{"Columns" -> {{Left}}, "Rows" -> {{Baseline}}},
GridBoxItemSize->{"Columns" -> {{Automatic}}, "Rows" -> {{1.}}},
GridBoxSpacings->{"Columns" -> {
Offset[0.27999999999999997`], {
Offset[0.84]},
Offset[0.27999999999999997`]}, "Rows" -> {
Offset[0.2], {
Offset[0.4]},
Offset[0.2]}},
Selectable->True]}
},
GridBoxAlignment->{"Columns" -> {{Left}}, "Rows" -> {{Baseline}}},
GridBoxItemSize->{"Columns" -> {{Automatic}}, "Rows" -> {{1.}}},
GridBoxSpacings->{"Columns" -> {
Offset[0.27999999999999997`], {
Offset[0.35]},
Offset[0.27999999999999997`]}, "Rows" -> {
Offset[0.2], {
Offset[0.4]},
Offset[0.2]}}],
"Piecewise",
DeleteWithContents->True,
Editable->False,
SelectWithContents->True,
Selectable->False,
StripWrapperBoxes->True]\)
ResourceFunction["EnhancedPlot"][f[x], {x, -2, 2}, "FindExceptions" -> True]](https://www.wolframcloud.com/obj/resourcesystem/images/ad8/ad846957-ea4b-4872-be92-fa22a1355ebe/2-0-0/79da9772b3e828c7.png)
|
| Out[72]= |
|
EnhancedPlot sometimes misses a removable discontinuity:
| In[73]:= |
|
| Out[73]= |
|
However, the discontinuity can be listed manually:
| In[74]:= |
|
| Out[74]= |

|
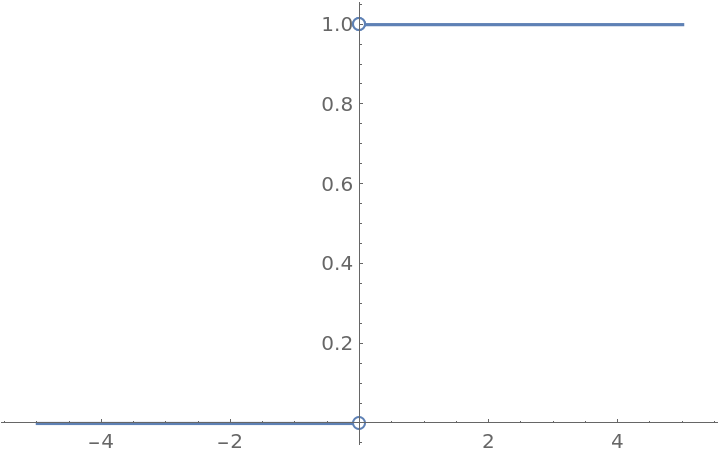
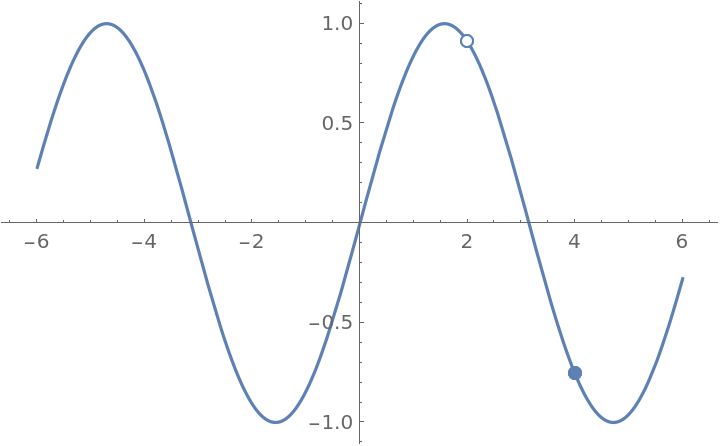
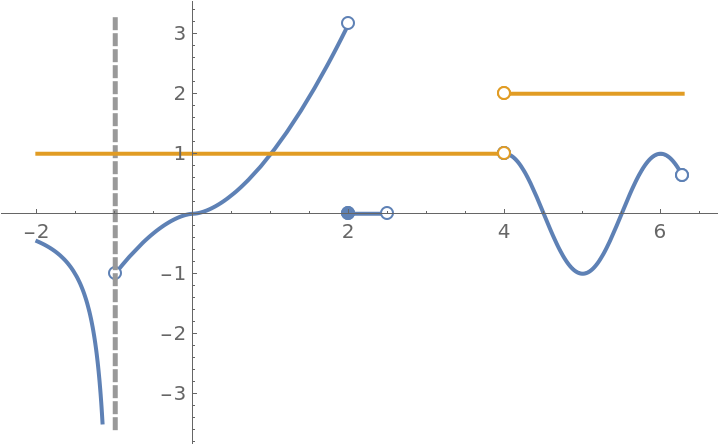
When a discontinuity denoted by a filled circle is overlapped by a empty circle, the filled circle is covered by the empty circle—that is, the empty circle is not really empty (see behavior at x=4):
| In[75]:= |
![Clear[g]
g[x_] := \!\(\*
TagBox[GridBox[{
{"\[Piecewise]", GridBox[{
{
FractionBox["1",
RowBox[{"1", "+",
RowBox[{"x", " ",
SuperscriptBox[
RadicalBox["x", "3",
MultilineFunction->None,
SurdForm->True], "2"]}]}]],
RowBox[{"x", "<",
RowBox[{"-", "1"}]}]},
{
RadicalBox[
SuperscriptBox["x", "5"], "3",
MultilineFunction->None,
SurdForm->True],
RowBox[{
RowBox[{"-", "1"}], "<", "x", "<", "2"}]},
{"0",
RowBox[{"2", "<=", "x", "<", "2.5"}]},
{
RowBox[{"Cos", "[",
RowBox[{"\[Pi]", " ", "x"}], "]"}],
RowBox[{"4", "<=", "x", "<",
RowBox[{"2", "\[Pi]"}]}]}
},
AllowedDimensions->{2, Automatic},
Editable->True,
GridBoxAlignment->{"Columns" -> {{Left}}, "Rows" -> {{Baseline}}},
GridBoxItemSize->{"Columns" -> {{Automatic}}, "Rows" -> {{1.}}},
GridBoxSpacings->{"Columns" -> {
Offset[0.27999999999999997`], {
Offset[0.84]},
Offset[0.27999999999999997`]}, "Rows" -> {
Offset[0.2], {
Offset[0.4]},
Offset[0.2]}},
Selectable->True]}
},
GridBoxAlignment->{"Columns" -> {{Left}}, "Rows" -> {{Baseline}}},
GridBoxItemSize->{"Columns" -> {{Automatic}}, "Rows" -> {{1.}}},
GridBoxSpacings->{"Columns" -> {
Offset[0.27999999999999997`], {
Offset[0.35]},
Offset[0.27999999999999997`]}, "Rows" -> {
Offset[0.2], {
Offset[0.4]},
Offset[0.2]}}],
"Piecewise",
DeleteWithContents->True,
Editable->False,
SelectWithContents->True,
Selectable->False,
StripWrapperBoxes->True]\)
h[x_] := \!\(\*
TagBox[GridBox[{
{"\[Piecewise]", GridBox[{
{"1",
RowBox[{"x", "<", "4"}]},
{"2",
RowBox[{"x", ">", "4"}]}
},
AllowedDimensions->{2, Automatic},
Editable->True,
GridBoxAlignment->{
"Columns" -> {{Left}}, "ColumnsIndexed" -> {}, "Rows" -> {{Baseline}}, "RowsIndexed" -> {}},
GridBoxItemSize->{
"Columns" -> {{Automatic}}, "ColumnsIndexed" -> {}, "Rows" -> {{1.}}, "RowsIndexed" -> {}},
GridBoxSpacings->{"Columns" -> {
Offset[0.27999999999999997`], {
Offset[0.84]},
Offset[0.27999999999999997`]}, "ColumnsIndexed" -> {}, "Rows" -> {
Offset[0.2], {
Offset[0.4]},
Offset[0.2]}, "RowsIndexed" -> {}},
Selectable->True]}
},
GridBoxAlignment->{
"Columns" -> {{Left}}, "ColumnsIndexed" -> {}, "Rows" -> {{Baseline}}, "RowsIndexed" -> {}},
GridBoxItemSize->{
"Columns" -> {{Automatic}}, "ColumnsIndexed" -> {}, "Rows" -> {{1.}}, "RowsIndexed" -> {}},
GridBoxSpacings->{"Columns" -> {
Offset[0.27999999999999997`], {
Offset[0.35]},
Offset[0.27999999999999997`]}, "ColumnsIndexed" -> {}, "Rows" -> {
Offset[0.2], {
Offset[0.4]},
Offset[0.2]}, "RowsIndexed" -> {}}],
"Piecewise",
DeleteWithContents->True,
Editable->False,
SelectWithContents->True,
Selectable->False,
StripWrapperBoxes->True]\)
ResourceFunction["EnhancedPlot"][{g[x], h[x]}, {x, -2, 2 \[Pi]}, "FindExceptions" -> True, PlotStyle -> Thick]](https://www.wolframcloud.com/obj/resourcesystem/images/ad8/ad846957-ea4b-4872-be92-fa22a1355ebe/2-0-0/7c995f033c6961dd.png)
|
| Out[76]= |
|
This work is licensed under a Creative Commons Attribution 4.0 International License