Wolfram Function Repository
Instant-use add-on functions for the Wolfram Language
Function Repository Resource:
Visualize a biomolecular sequence with highlighted residues
ResourceFunction["BioSequenceMoleculePlot"][bioseq] creates a two-dimensional structure diagram of the biomolecular sequence bioseq, where all residues are highlighted. |
| "Highlighting" | Automatic | how to highlight the given BioSequence |
Visualize the structure of the "beefy meaty peptide":
| In[1]:= | ![ResourceFunction["BioSequenceMoleculePlot"][
BioSequence["Peptide", "KGDEESLA"]]](https://www.wolframcloud.com/obj/resourcesystem/images/528/528b4c5e-0560-47b0-931b-1735f4ab9fa0/410c95738dd3c053.png) |
| Out[1]= | 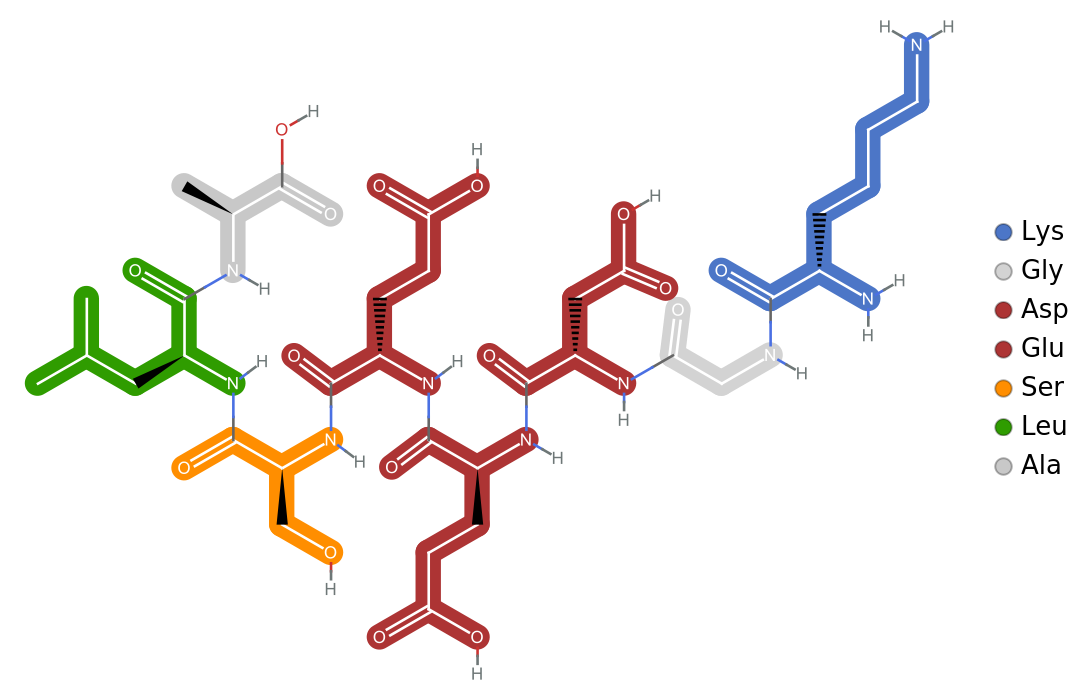 |
Visualize the structure of the circular peptide evolidine:
| In[2]:= | ![ResourceFunction["BioSequenceMoleculePlot"][
BioSequence["CircularPeptide", "SFLPVNL"]]](https://www.wolframcloud.com/obj/resourcesystem/images/528/528b4c5e-0560-47b0-931b-1735f4ab9fa0/7c8facc5d5a573aa.png) |
| Out[2]= | 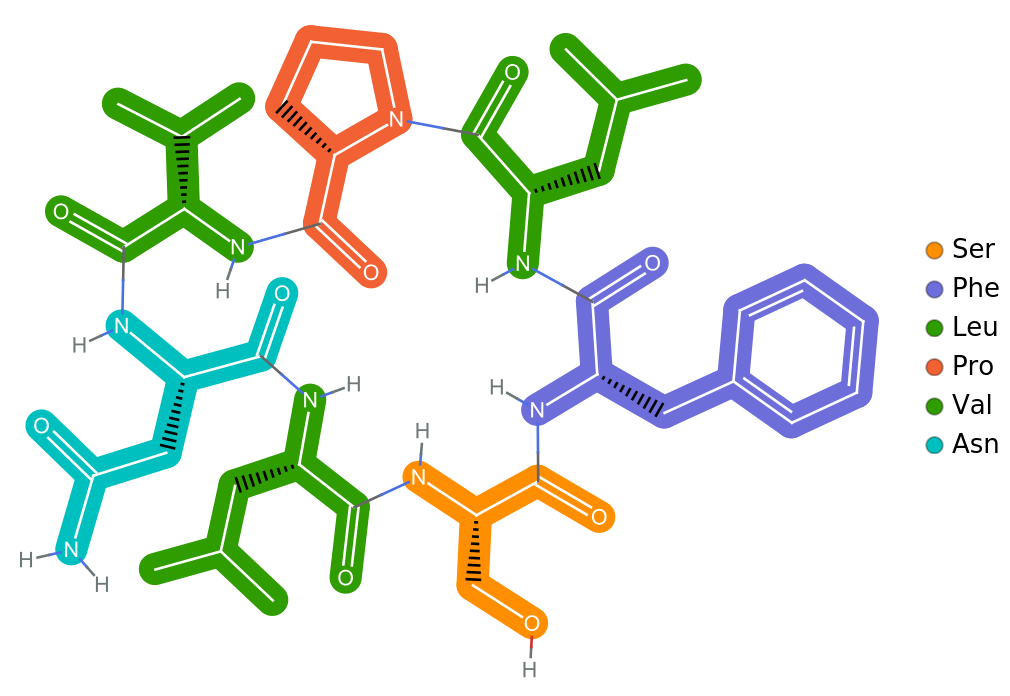 |
Compare an RNA and a circular RNA sequence:
| In[3]:= | ![{ResourceFunction["BioSequenceMoleculePlot"][
BioSequence["RNA", "AUCGCCGUG"]], ResourceFunction["BioSequenceMoleculePlot"][
BioSequence["CircularRNA", "AUCGCCGUG"]]} // GraphicsRow](https://www.wolframcloud.com/obj/resourcesystem/images/528/528b4c5e-0560-47b0-931b-1735f4ab9fa0/29216d38132f7622.png) |
| Out[3]= | 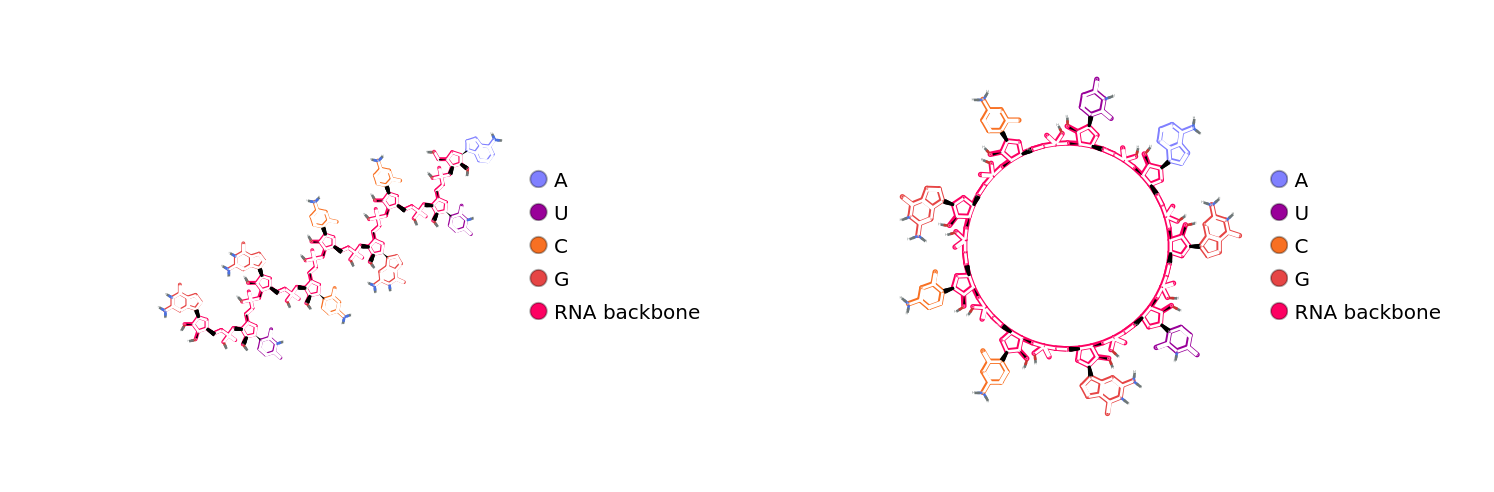 |
Highlight the sugars and phosphate groups together in a DNA-RNA hybrid strand:
| In[4]:= | ![ResourceFunction["BioSequenceMoleculePlot"][
BioSequence[
"HybridStrand", {BioSequence["DNA", "TGC"], BioSequence["RNA", "GUA"]}], "Highlighting" -> "ResidueBackbone"]](https://www.wolframcloud.com/obj/resourcesystem/images/528/528b4c5e-0560-47b0-931b-1735f4ab9fa0/4734f4a73f3b86ca.png) |
| Out[4]= | 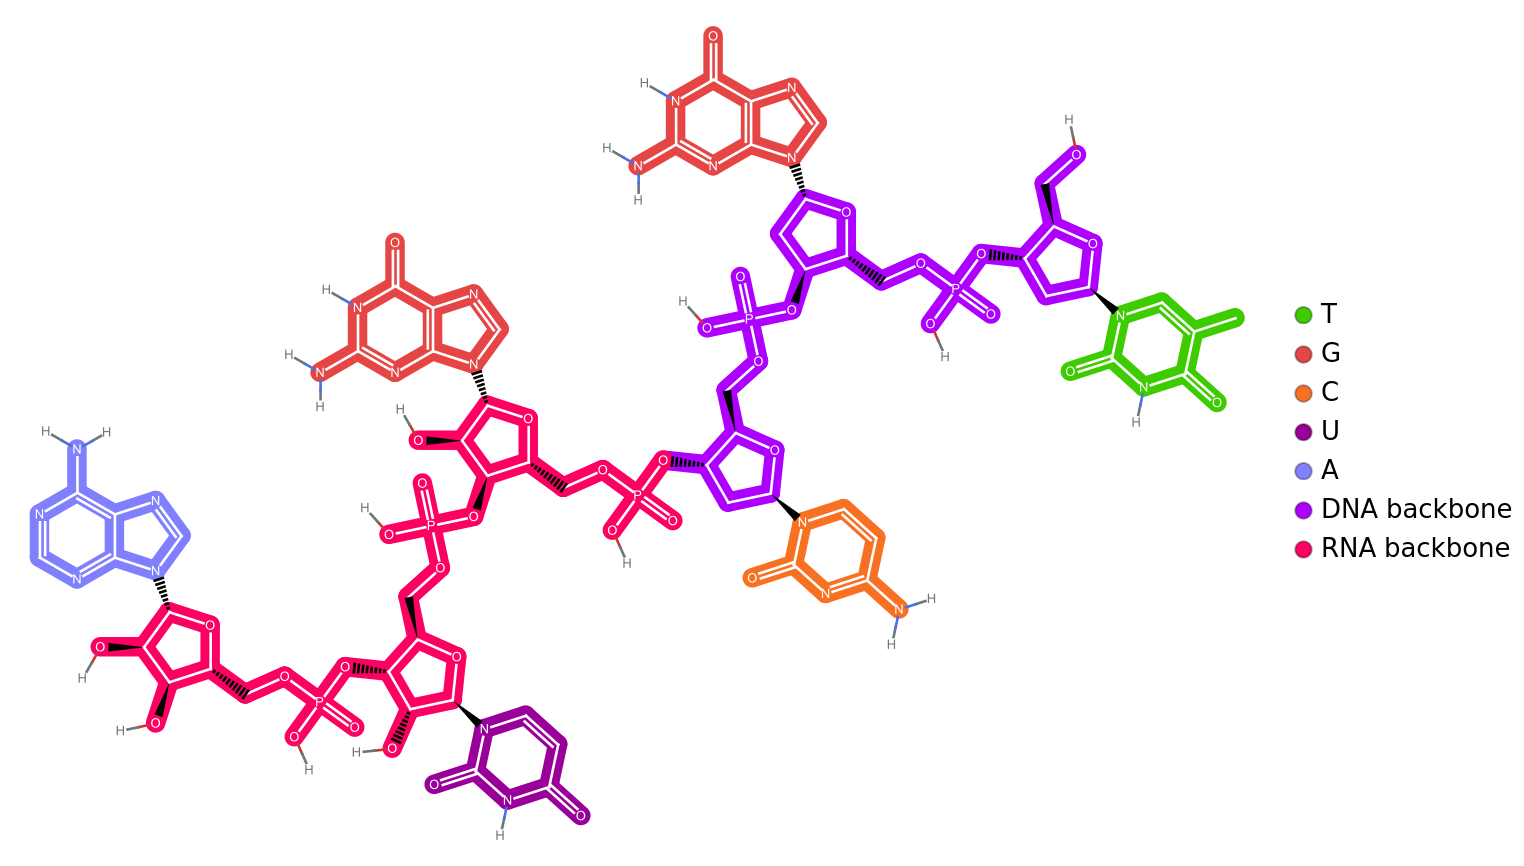 |
Highlight the sugars and phosphate groups separately:
| In[5]:= | ![ResourceFunction["BioSequenceMoleculePlot"][
BioSequence[
"HybridStrand", {BioSequence["DNA", "TGC"], BioSequence["RNA", "GUA"]}], "Highlighting" -> "ResidueSugar"]](https://www.wolframcloud.com/obj/resourcesystem/images/528/528b4c5e-0560-47b0-931b-1735f4ab9fa0/7bebbfde4f176b45.png) |
| Out[5]= | 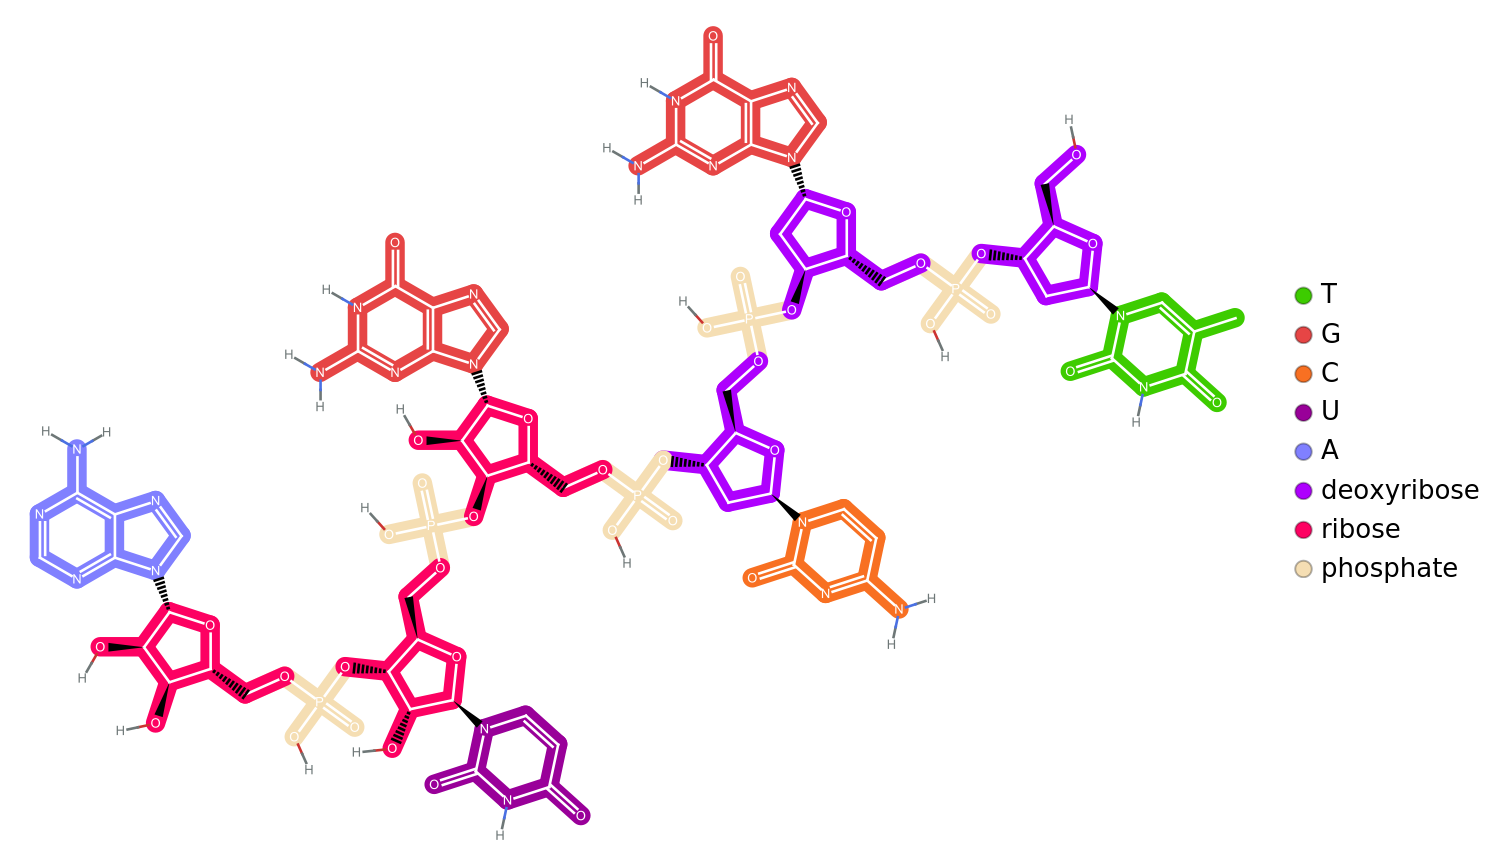 |
Highlight the amino acid residues in human insulin:
| In[6]:= | ![ResourceFunction["BioSequenceMoleculePlot"][
BioSequence[{
BioSequence["Peptide", "FVNQHLCGSHLVEALYLVCGERGFFYTPKT", {}],
BioSequence["Peptide", "GIVEQCCTSICSLYQLENYCN", {}]}, {
Bond[{{2, 1, 6}, {2, 1, 11}}, "DisulfideBridges"],
Bond[{{2, 1, 7}, {1, 1, 7}}, "DisulfideBridges"],
Bond[{{2, 1, 20}, {1, 1, 19}}, "DisulfideBridges"]}]]](https://www.wolframcloud.com/obj/resourcesystem/images/528/528b4c5e-0560-47b0-931b-1735f4ab9fa0/1516ec9af0b321a1.png) |
| Out[6]= | 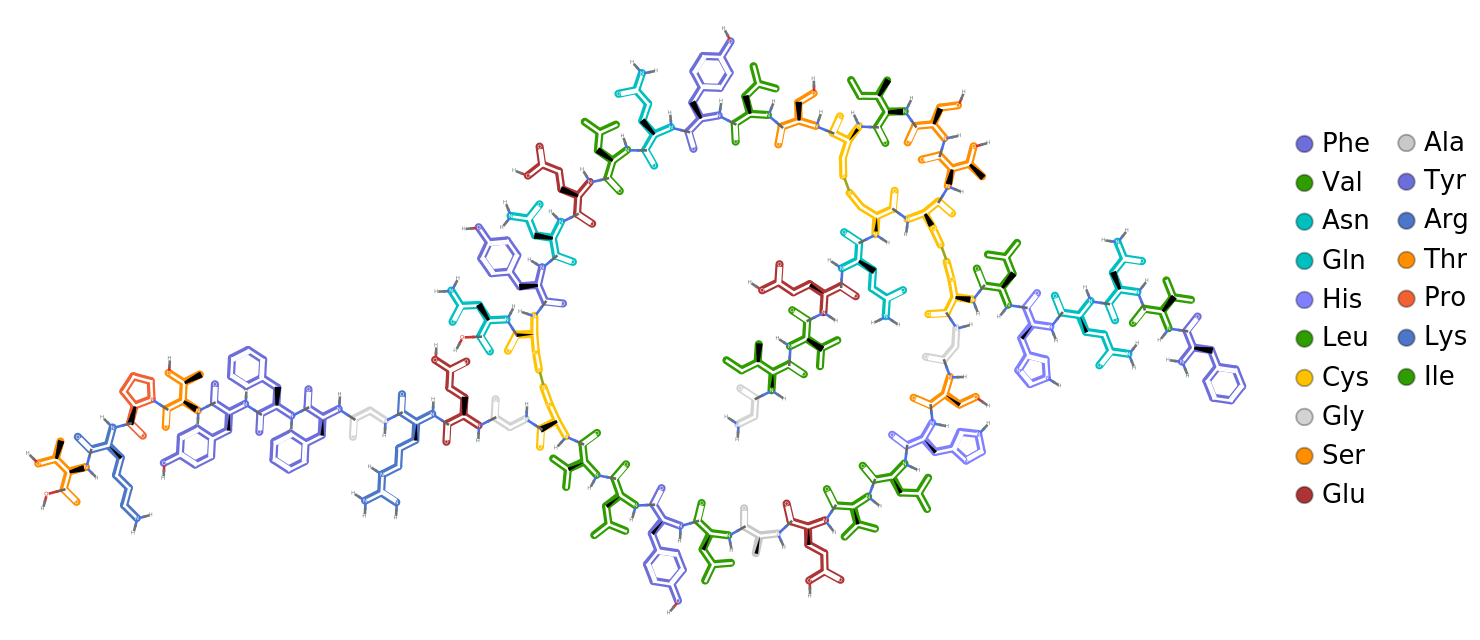 |
This work is licensed under a Creative Commons Attribution 4.0 International License