Wolfram Function Repository
Instant-use add-on functions for the Wolfram Language
Function Repository Resource:
Generate the stave diagram corresponding to a nucleotide sequence
ResourceFunction["NucleotideStaveDiagram"][bioseq] visualizes the "DNA" or "RNA" BioSequence bioseq as a stave diagram. |
| "MaxColumns" | Automatic | maximum number of columns on a stave before moving to a new one |
| PlotStyle | Automatic | graphics directives to determine styles of markers |
| "ShowLabels" | True | whether to show labels for the nucleotides |
| "StaveStyle" | Automatic | style specifications for the staves |
| "WildcardStyle" | Automatic | graphics directives to determine styles of markers corresponding to degenerate letters |
Stave diagram for a DNA sequence:
| In[1]:= |
| Out[1]= | 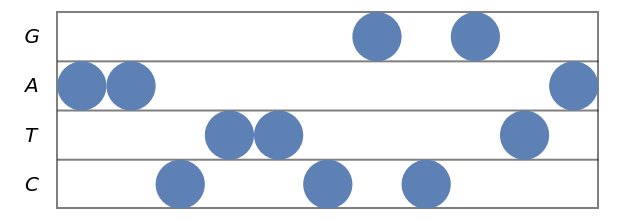 |
Stave diagram for an RNA sequence:
| In[2]:= |
| Out[2]= | 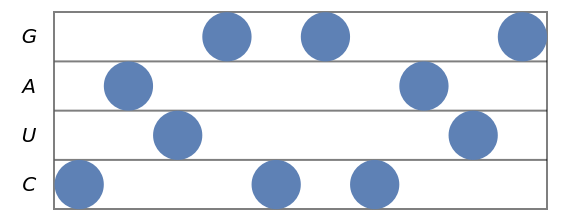 |
Stave diagram for a gene:
| In[3]:= |
| Out[3]= | 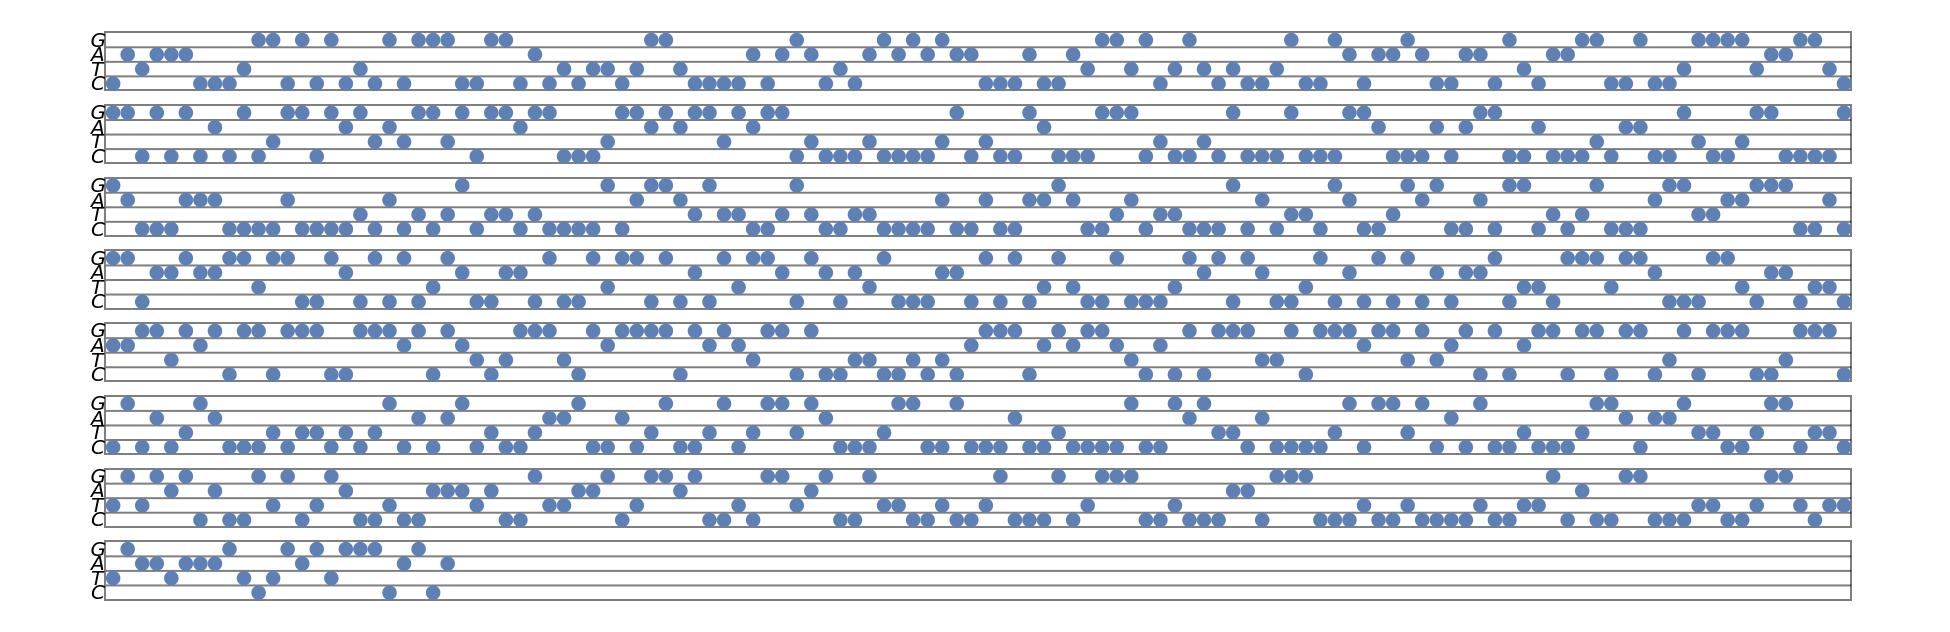 |
Stave diagram for a sequence containing degenerate letters:
| In[4]:= |
| Out[4]= | 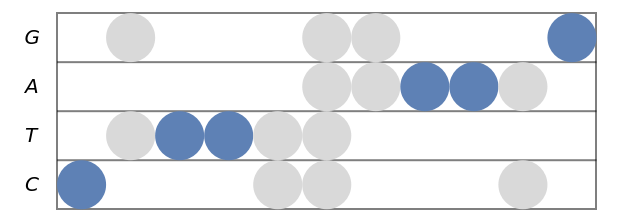 |
NucleotideStaveDiagram can be used on strings and will infer the sequence type from the letters:
| In[5]:= |
| Out[5]= | 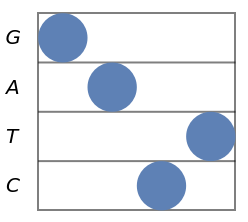 |
The setting "MaxColumns"→Automatic corresponds to a cutoff of 120 columns. Use a smaller number of columns:
| In[6]:= | ![ResourceFunction["NucleotideStaveDiagram"][
BioSequence[Entity["Gene", {"HBA1", {"Species" -> "HomoSapiens"}}]], "MaxColumns" -> 75]](https://www.wolframcloud.com/obj/resourcesystem/images/753/7532fe52-be11-4fe8-9a54-d8b8e5128443/3eb69d670a96edf5.png) |
| Out[6]= | 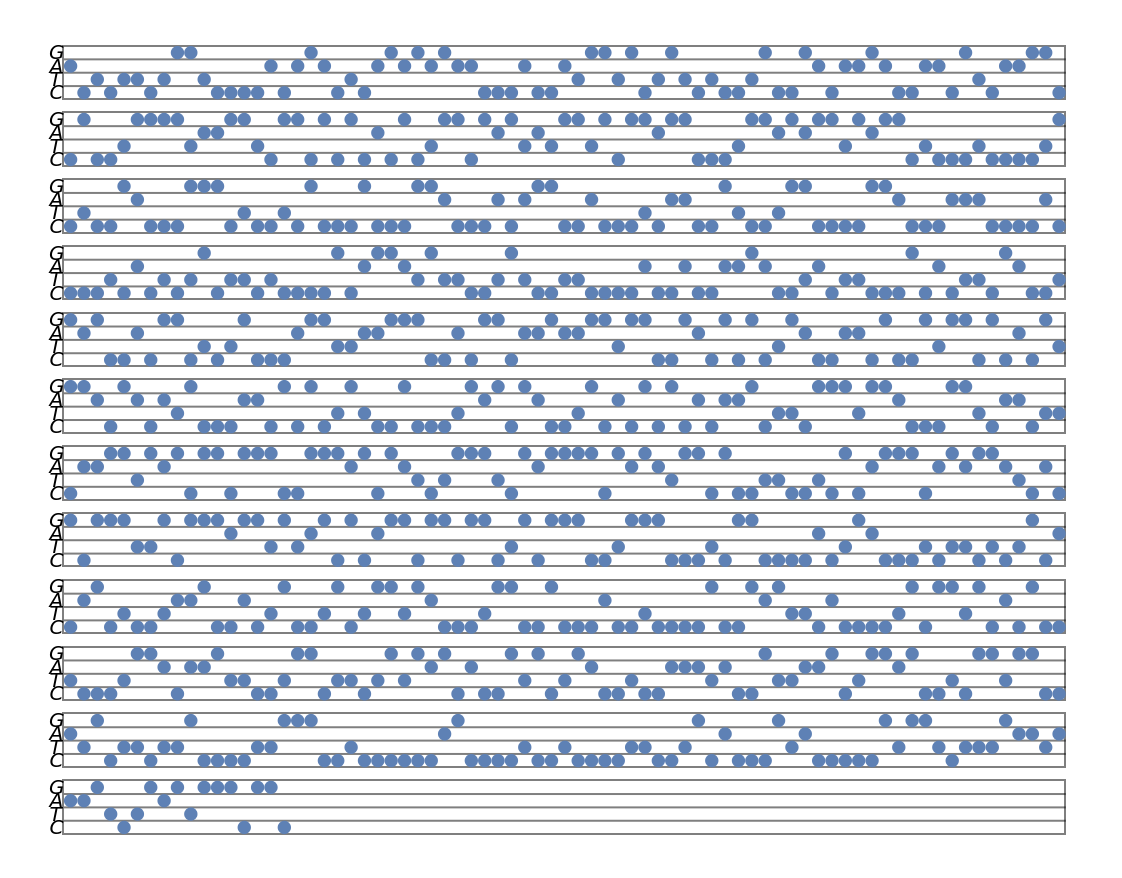 |
Use different style directives for markers corresponding to non-degenerate letters:
| In[7]:= | ![(* Evaluate this cell to get the example input *) CloudGet["https://www.wolframcloud.com/obj/3a196360-fc77-4181-ab33-d946a52b9377"]](https://www.wolframcloud.com/obj/resourcesystem/images/753/7532fe52-be11-4fe8-9a54-d8b8e5128443/5a90706955f38205.png) |
| Out[7]= | 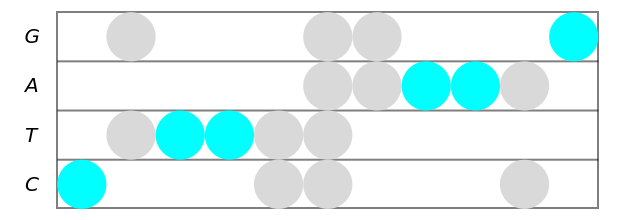 |
Show the stave diagram with and without the nucleotide labels:
| In[8]:= | ![(* Evaluate this cell to get the example input *) CloudGet["https://www.wolframcloud.com/obj/74c28959-5ed3-422f-9ff9-c9910cbf4774"]](https://www.wolframcloud.com/obj/resourcesystem/images/753/7532fe52-be11-4fe8-9a54-d8b8e5128443/00b7936e1df1b7f4.png) |
| Out[8]= |  |
Specify the style to use for the staves:
| In[9]:= | ![(* Evaluate this cell to get the example input *) CloudGet["https://www.wolframcloud.com/obj/9cb37390-fc58-494c-9113-249354ad9060"]](https://www.wolframcloud.com/obj/resourcesystem/images/753/7532fe52-be11-4fe8-9a54-d8b8e5128443/1b96c81fa701d15e.png) |
| Out[9]= | 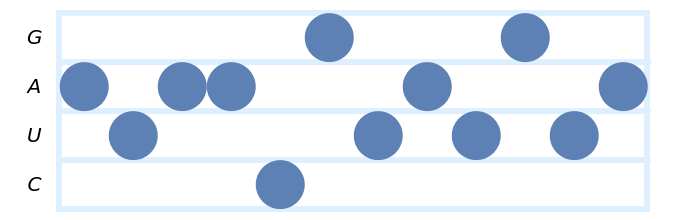 |
Use different style directives for markers corresponding to degenerate letters:
| In[10]:= | ![(* Evaluate this cell to get the example input *) CloudGet["https://www.wolframcloud.com/obj/6fcdc9ee-c8c3-45fd-8fd7-db01b97ba1a8"]](https://www.wolframcloud.com/obj/resourcesystem/images/753/7532fe52-be11-4fe8-9a54-d8b8e5128443/56f5f3b0d80b860b.png) |
| Out[10]= | 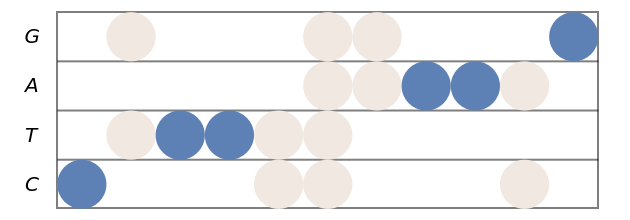 |
The stave diagram of a sequence and its complement are mirror reflections of each other:
| In[11]:= | ![(* Evaluate this cell to get the example input *) CloudGet["https://www.wolframcloud.com/obj/4040b805-1ee9-4403-9bbc-0e937e437922"]](https://www.wolframcloud.com/obj/resourcesystem/images/753/7532fe52-be11-4fe8-9a54-d8b8e5128443/1fd8917ca84177ef.png) |
| Out[11]= | 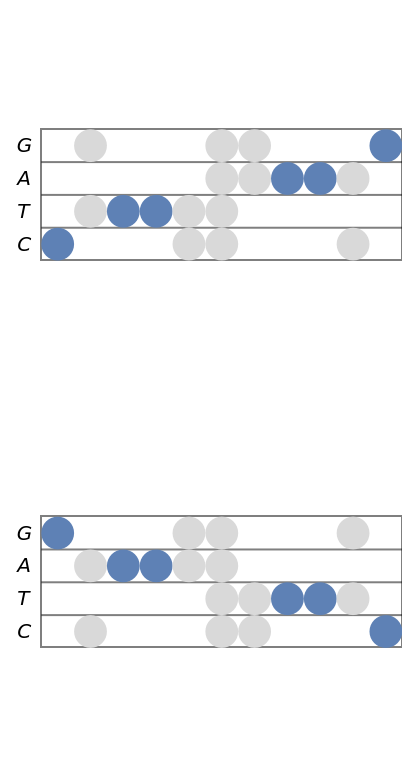 |
Palindromic sequences have centrally symmetric stave diagrams:
| In[12]:= |
| Out[12]= | 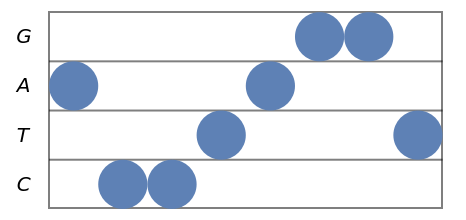 |
This work is licensed under a Creative Commons Attribution 4.0 International License