Function Repository Resource:

PeptideHydropathyPlot

Source Notebook

Generate the hydropathy plot of a peptide sequence

Contributed by: Jan Mangaldan

ResourceFunction["PeptideHydropathyPlot"][expr]

gives the hydropathy plot of the peptide represented by expr.

Details and Options

A hydropathy plot of a peptide/protein plots the degree of hydrophobicity of a peptide residue versus its position in the peptide sequence. It is used to characterize or identify possible structures or domains of a protein (e.g. membrane-spanning domains, potential antigenic sites and regions that are likely to be exposed on the surface).
In a hydropathy plot, positive regions usually indicate sections of the sequence that are in contact with other hydrophobic molecules (e.g. lipids). Conversely, negative regions correspond to hydrophilic sections, which are more likely to be the exposed surface of a protein in a solvent like water.
The input expr can be a BioSequence object, an Entity of entity type "Protein" or a peptide sequence string.
ResourceFunction["PeptideHydropathyPlot"] accepts the same options as ListLinePlot, with the following additional option:
WindowSizeAutomaticsize of the window used for the moving average computation
For sequences longer than 8 in length, WindowSizeAutomatic utilizes a window size of 7.
ResourceFunction["PeptideHydropathyPlot"] uses the Kyte–Doolittle hydropathy scale.

Examples

Basic Examples (1) 

Hydropathy plot for a "Protein" Entity:

In[1]:=
ResourceFunction["PeptideHydropathyPlot"][Entity["Protein", "MB"]]
Out[1]=

Scope (2) 

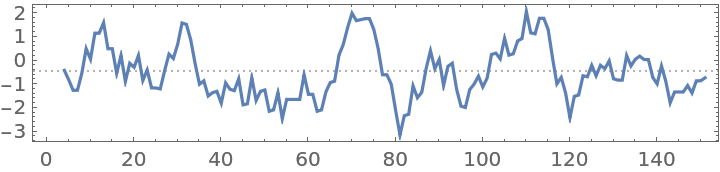
Hydropathy plot of a "Peptide" BioSequence:

In[2]:=
ResourceFunction["PeptideHydropathyPlot"][
BioSequence[
 "Peptide", "MMSSAAFPRWLSMGVPRTPSRTVLFERERTGLTYRVPSLLPVPPGPTLLAFVEQRLSPDDSHAHRLVLRRGTLAGGSVRWGALHVLGTAALAEHRSMNPCPVHDAGTGTVFLFFIAVLGHTPEAVQIATGRNAARLCCVASRDAGLSWGSARDLTEEAIGGAVQDWATFAVGPGHGVQLPSGRLLVPAYTYRVDRRECFGKICRTSPHSFAFYSDDHGRTWRCGGLVPNLRSGECQLAAVDGGQAGSFLYCNARSPLGSRVQALSTDEGTSFLPAERVASLPETAWGCQGSIVGFPAPAPNRPRDDSWSVGPRSPLQPPLLGPGVHEPPEEAAVDPRGGQVPGGPFSRLQPRGDGPRQPGPRPGVSGDVGSWTLALPMPFAAPPQSPTWLLYSHPVGRRARLHMGIRLSQSPLDPRSWTEPWVIYEGPSGYSDLASIGPAPEGGLVFACLYESGARTSYDEISFCTFSLREVLENVPASPKPPNLGDKPRGCCWPS"]]
Out[2]=

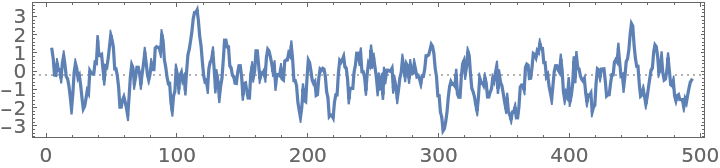
Hydropathy plot for bovine chymotrypsinogen A:

In[3]:=
ResourceFunction[
 "PeptideHydropathyPlot"]["CGVPAIQPVLSGLSRIVNGEEAVPGSWPWQVSLQDKTGFHFCGGSLINENWVVTAAHCGVTTSDVVVAGEFDQGSSSEKIQKLKIAKVFKNSKYNSLTINNDITLLKLSTAASFSQTVSAVCLPSASDDFAAGTTCVTTGWGLTRYTNANTPDRLQQASLPLLSNTNCKKYWGTKIKDAMICAGASGVSSCMGDSGGPLVCKKNGAWTLVGIVSWGSSTCSTSTPGVYARVTALVNWVQQTLAAN"]
Out[3]=

Options (1) 

WindowSize (1) 

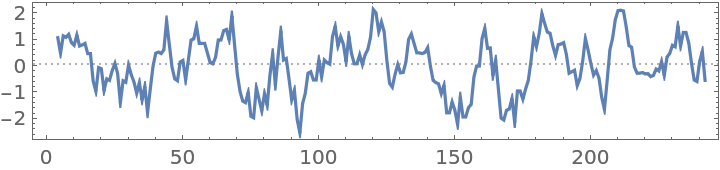
Use different window sizes for the hydropathy plot of bacteriorhodopsin:

In[4]:=
Table[ResourceFunction["PeptideHydropathyPlot"][BioSequence[
   "Peptide", "EAQITGRPEWIWLALGTALMGLGTLYFLVKGMGVSDPDAKKFYAITTLVPAIAFTMYLSMLLGYGLTMVPFGGEQNPIYWARYADWLFTTPLLLLDLALLVDADQGTILALVGADGIMIGTGLVGALTKVYSYRFVWWAISTAAMLYILYVLFFGFTSKAESMRPEVASTFKVLRNVTVVLWSAYPVVWLIGSEGAGIVPLNIETLLFMVLDVSAKVGFGLILLRSRAIFGEAEAPEPSAGDGAAATS"], PlotLabel -> "window size " <> IntegerString[w], WindowSize -> w], {w, {7, 9, 11}}] // GraphicsColumn
Out[4]=

Neat Examples (1) 

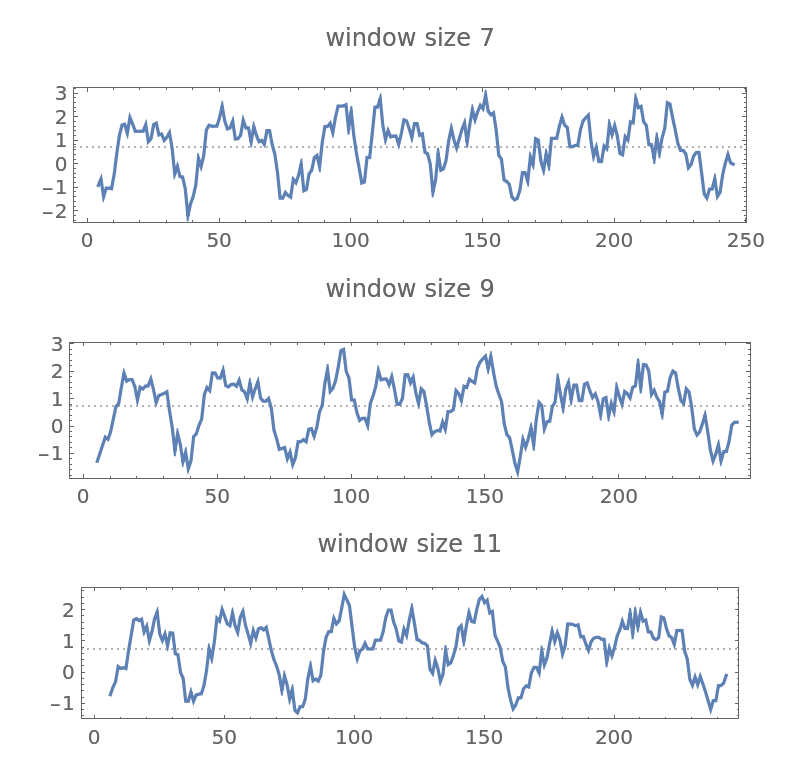
Download the amino acid sequence for the protein titin and visualize its hydropathy:

In[5]:=
titin = First[
   Import["https://www.uniprot.org/uniprot/Q8WZ42.fasta"]];
ResourceFunction["PeptideHydropathyPlot"][titin, AspectRatio -> 1/20, WindowSize -> 41]
Out[5]=

Version History

  • 1.0.0 – 26 October 2021

Source Metadata

Related Resources

Author Notes

Support for other hydropathy/hydrophobicity scales (e.g. Hopp-Woods, Sweet-Eisenberg) will be added in a future version.

License Information