Function Repository Resource:

BanzhafPowerIndex

Source Notebook

Compute the strength of a voter by reference to the frequency with which their vote could change the outcome of an election

Contributed by: Seth J. Chandler

ResourceFunction["BanzhafPowerIndex"][list]

computes the power index where the votes of each player are denoted by list.

ResourceFunction["BanzhafPowerIndex"][assoc]

computes the power index where the keys of assoc are the identities of the players and the values of assoc are their respective number of votes.

ResourceFunction["BanzhafPowerIndex"][votes,q]

computes the power index, if q is the number of votes needed to win.

Details and Options

ResourceFunction["BanzhafPowerIndex"][votes,q,All] (or ResourceFunction["BanzhafPowerIndex"][votes,All]) returns an Association with two keys, "Index" and "Quota", where the "Index" key corresponds to the result of ResourceFunction["BanzhafPowerIndex"][votes,q] (or ResourceFunction["BanzhafPowerIndex"][votes]), while the "Quota" key corresponds to the number of votes needed to win.
ResourceFunction["BanzhafPowerIndex"] takes the following options:
"TieResult""Loss"how ties are treated
"WinningFraction"fraction of players needed to have a winning number of votes
It is assumed by default that winning requires a majority of the votes cast. To change the fraction used to compute whether a set of players have a winning number of votes, set the "WinningFraction" option to a value between 0 and 1.
A tie is regarded as a loss by default. To let a tie be regarded as a win, set the value of the "TieResult"option to "Win".

Examples

Basic Examples (2) 

Compute the Banzhaf power index where player 1 has 1 vote, player 2 has 2 votes and player 3 has 3 votes:

In[1]:=
ResourceFunction["BanzhafPowerIndex"][<|1 -> 1, 2 -> 2, 3 -> 3|>]
Out[1]=

Compute the Banzhaf power index where you have not "named" the players:

In[2]:=
ResourceFunction["BanzhafPowerIndex"][{1, 2, 3}]
Out[2]=

Compute the Banzhaf power index for five players, assuming 11 votes are needed to win:

In[3]:=
ResourceFunction["BanzhafPowerIndex"][{1, 2, 3, 4, 5}, 11] // N
Out[3]=

Scope (5) 

Use All to obtain an Association containing information on the power index and the number of votes needed to win (the "quota"):

In[4]:=
ResourceFunction["BanzhafPowerIndex"][{1, 2, 3, 4, 5, 6, 9}, All, "WinningFraction" -> 2/3]
Out[4]=

The additional All argument can be used even if the user explicitly sets the quota size:

In[5]:=
ResourceFunction["BanzhafPowerIndex"][{1, 2, 3, 4, 5, 6, 9}, 23, All]
Out[5]=

The additional All argument can be used where the votes are structured as an Association between player name and vote:

In[6]:=
ResourceFunction[
 "BanzhafPowerIndex"][<|"a" -> 1, "b" -> 2, "c" -> 3|>, All]
Out[6]=

BanzhafPowerIndex can handle a 100 player scenario in about one second on a typical 2022 laptop:

In[7]:=
ResourceFunction["BanzhafPowerIndex"][
   Ceiling@RandomVariate[LogNormalDistribution[1, 2], 100]]; // RepeatedTiming
Out[7]=

Going to a 200-player scenario increases the computation time by a factor of ≈ 6:

In[8]:=
ResourceFunction["BanzhafPowerIndex"][
   Ceiling@RandomVariate[LogNormalDistribution[1, 2], 200]]; // RepeatedTiming
Out[8]=

Compute the Banzhaf power index for votes amongst US states with different voting powers:

In[9]:=
ResourceFunction[
 "BanzhafPowerIndex"][<|"California" -> 55, "Texas" -> 38, "New York" -> 29|>]
Out[9]=
In[10]:=
ResourceFunction[
 "BanzhafPowerIndex"][<|"California" -> 55, "Texas" -> 38, "Georgia" -> 16|>]
Out[10]=

Reproduce the result from the original Banzhaf paper, suggesting that three communities effectively had no power:

In[11]:=
ResourceFunction[
 "BanzhafPowerIndex"][<|"Hempstead1" -> 9, "Hempstead2" -> 9, "New Hempstead" -> 7, "Oyster Bay" -> 3, "Glen Cove" -> 1, "Long Beach" -> 1|>]
Out[11]=

Reproduce the result from the paper by Bilbao, Fernandez and Jiménez Losada:

In[12]:=
votesUE = {10, 10, 10, 10, 8, 5, 5, 5, 5, 4, 4, 3, 3, 3, 2};
In[13]:=
ResourceFunction["BanzhafPowerIndex"][votesUE, 62] // N
Out[13]=
In[14]:=
ResourceFunction["BanzhafPowerIndex"][votesUE, 65] // N
Out[14]=

Options (2) 

TieResult (1) 

Compare the results of whether a tie should be treated as a loss or win:

In[15]:=
ResourceFunction["BanzhafPowerIndex"][{1, 2, 3, 4, 5, 6, 9}, "WinningFraction" -> 2/3, "TieResult" -> "Loss"] // N
Out[15]=
In[16]:=
ResourceFunction["BanzhafPowerIndex"][{1, 2, 3, 4, 5, 6, 9}, "WinningFraction" -> 2/3, "TieResult" -> "Win"] // N
Out[16]=

WinningFraction (1) 

Find the Banzhaf power index assuming 2/3 of the votes are needed to win:

In[17]:=
ResourceFunction["BanzhafPowerIndex"][{1, 2, 3, 4, 5, 6, 9}, "WinningFraction" -> 2/3] // N
Out[17]=

Applications (3) 

Show how the power of each player changes as the quota needed to win changes:

In[18]:=
Table[{q, ResourceFunction["BanzhafPowerIndex"][{1, 2, 3}, q]}, {q, 1,
   6}]
Out[18]=

Compute the power of each state in the United States electoral college assuming that electors from each state vote as a block:

In[19]:=
electoralVotes = <|"Alabama" -> 9, "Alaska" -> 3, "Arizona" -> 11, "Arkansas" -> 6, "California" -> 55, "Colorado" -> 9, "Connecticut" -> 7, "District of Columbia" -> 3, "Delaware" -> 3, "Florida" -> 29, "Georgia" -> 16, "Hawaii" -> 4, "Idaho" -> 4, "Illinois" -> 20, "Indiana" -> 11, "Iowa" -> 6, "Kansas" -> 6, "Kentucky" -> 8, "Louisiana" -> 8, "Maine" -> 4, "Maryland" -> 10, "Massachusetts" -> 11, "Michigan" -> 16, "Minnesota" -> 10, "Mississippi" -> 6, "Missouri" -> 10, "Montana" -> 3, "Nebraska" -> 5, "Nevada" -> 6, "New Hampshire" -> 4, "New Jersey" -> 14, "New Mexico" -> 5, "New York" -> 29, "North Carolina" -> 15, "North Dakota" -> 3, "Ohio" -> 18, "Oklahoma" -> 7, "Oregon" -> 7, "Pennsylvania" -> 20, "Rhode Island" -> 4, "South Carolina" -> 9, "South Dakota" -> 3, "Tennessee" -> 11, "Texas" -> 38, "Utah" -> 6, "Vermont" -> 3, "Virginia" -> 13, "Washington" -> 12, "West Virginia" -> 5, "Wisconsin" -> 10, "Wyoming" -> 3|>;
In[20]:=
ResourceFunction["BanzhafPowerIndex"][electoralVotes] // ReverseSort/*N
Out[20]=

Assume that the allocation of electors in most states is considered known but the allocation of electors in Florida, Pennsylvania, Ohio, North Carolina, and Wisconsin are considered "in play." Of the 92 electoral votes those states have, a candidate needs 58 of them to win. Compute the Banzhaf power index of the remaining five states:

In[21]:=
ResourceFunction["BanzhafPowerIndex"][
 KeyTake[electoralVotes, {"Florida", "Pennsylvania", "Ohio", "North Carolina", "Wisconsin"}], 58]
Out[21]=

The other candidate needs 34 votes to win. Compute the Banzhaf power index of the remaining five states:

In[22]:=
ResourceFunction["BanzhafPowerIndex"][
 KeyTake[electoralVotes, {"Florida", "Pennsylvania", "Ohio", "North Carolina", "Wisconsin"}], 34]
Out[22]=

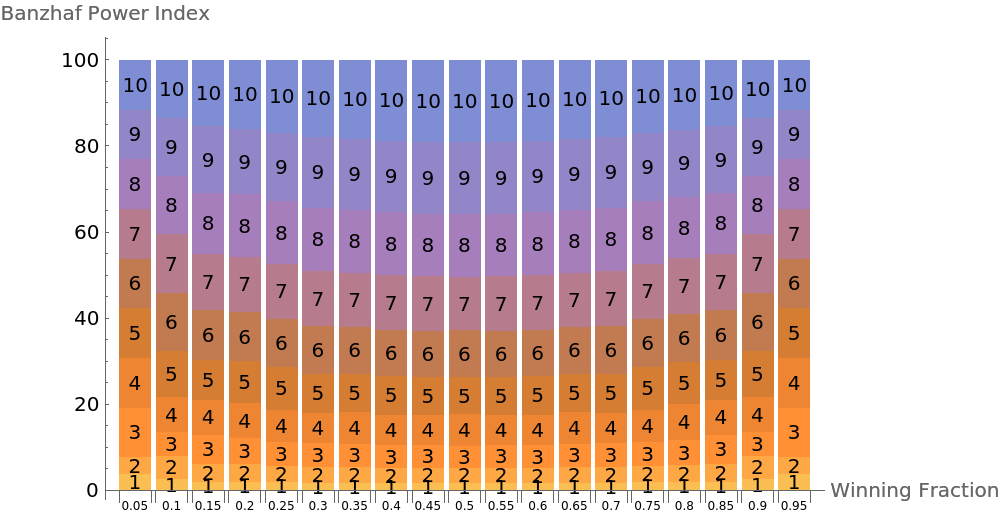
See how the power distribution changes as we alter the winning fraction:

In[23]:=
powerTable = Table[ResourceFunction["BanzhafPowerIndex"][Range[10], "WinningFraction" -> f], {f, 0.05, 0.95, 0.05}];
In[24]:=
BarChart[powerTable, ChartLayout -> "Percentile", AxesLabel -> {"Winning Fraction", "Banzhaf Power Index"}, ImageSize -> 500, ChartLabels -> {Placed[Map[Style[#, 6] &, Range[0.05, 0.95, 0.05]], Below], Range[10]}]
Out[24]=

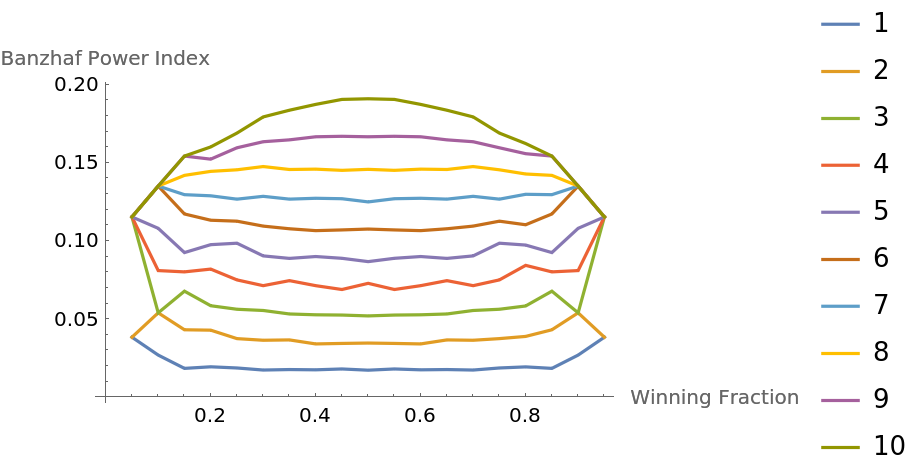
An alternative view:

In[25]:=
ListLinePlot[Transpose[powerTable], PlotLegends -> Range[10], ImageSize -> 400, DataRange -> {0.05, 0.95}, AxesLabel -> {"Winning Fraction", "Banzhaf Power Index"}]
Out[25]=

Neat Examples (2) 

This example explores how coalition formation affects the Banzhaf power index. The idea is to let individuals form coalitions which pledge themselves to aggregate the votes of the members and vote as a block in a certain way. One then computes the Banzhaf power index of the coalitions. Each coalition then distributes its power equally over its members. Start by taking 5 people with different numbers of votes:

In[26]:=
s = AssociationThread[CharacterRange["a", "e"], {3, 6, 8, 11, 13}]
Out[26]=

Compute the Banzhaf power index of the members:

In[27]:=
ResourceFunction["BanzhafPowerIndex"][s]
Out[27]=

Take every set partition of the voters with the idea being that every grouping represents a coalition of voters. In the first example, everyone is in a single coalition. In the second example, a stands by itself and everyone else is in a coalition. In the third example, {a,b} is one coalition and {c,d,e} is the other. And so on for the 52 possible set partitions. (The number of partitions is equal to BellB[Length[s]]):

In[28]:=
sp = ResourceFunction[
ResourceObject[<|"Name" -> "SetPartitions", "ShortName" -> "SetPartitions", "UUID" -> "23cfd32b-8215-488e-875f-44585e164f6a", "ResourceType" -> "Function", "Version" -> "2.0.0", "Description" -> "Give all possible ways to partition a set into blocks, ignoring the order of blocks and order within blocks", "RepositoryLocation" -> URL[
      "https://www.wolframcloud.com/obj/resourcesystem/api/1.0"], "SymbolName" -> "FunctionRepository`$4fc60841588b465482489bc11dd61cc4`SetPartitions", "FunctionLocation" -> CloudObject[
      "https://www.wolframcloud.com/objects/b590d787-71e7-4b7f-90b3-beeadf0fb19e"]|>, ResourceSystemBase -> Automatic]][Keys[s]]
Out[28]=

Compute the total vote of each coalition:

In[29]:=
vp = Map[Total[Lookup[s, #, 0]] &, sp, {2}]
Out[29]=

Associate each coalition with its total number of votes:

In[30]:=
(spvp = MapThread[AssociationThread, {sp, vp}]) // Short
Out[30]=

Compute the Banzhaf power index of each coalition (given the other coalitions):

In[31]:=
(bpi = Map[ResourceFunction["BanzhafPowerIndex"], spvp]) // ResourceFunction[
ResourceObject[<|"Name" -> "AugmentedTerse", "ShortName" -> "AugmentedTerse", "UUID" -> "55ad4cc5-e284-40ca-a3cb-8a4166c38701", "ResourceType" -> "Function", "Version" -> "1.0.0", "Description" -> "An operator form of Short with an alternative compressed representation of the output", "RepositoryLocation" -> URL[
      "https://www.wolframcloud.com/obj/resourcesystem/api/1.0"], "SymbolName" -> "FunctionRepository`$779c3314c408433eb6df4354526edb23`AugmentedTerse", "FunctionLocation" -> CloudObject[
      "https://www.wolframcloud.com/obj/5aa416ea-2adb-41c1-9102-ddaa33f49612"]|>, ResourceSystemBase -> Automatic]][8]
Out[31]=

Distribute the power of the coalitions equally over each of its members such that we end up with an Association between partitions of the sets of players and the power of each player after equal distribution:

In[32]:=
(coalitionMemberPowers = MapThread[{sp, b} |-> sp -> Flatten[KeyValueMap[Thread[Rule[#1, #2/Length[#1]]] &, b],
          1] // KeySort, {sp, bpi}] // N/*Map[Normal]/*(Flatten[#, 1] &)/*Association);

Show which set partitions give player “a" the most power:

In[33]:=
coalitionMemberPowers // ReverseSortBy[Lookup[#, "a"] &]/*(Take[#, 10] &)
Out[33]=

Take 30,000 voters in a business entity, each with a different number of votes with the distribution of votes determined by a Pareto distribution. Bin the voters and compute each bin's power index:

In[34]:=
voters = With[{n = 30000}, Sort@Ceiling[RandomVariate[ResourceFunction[
ResourceObject[<|"Name" -> "MeanMedianLogNormalDistribution", "ShortName" -> "MeanMedianLogNormalDistribution", "UUID" -> "5af0e61f-890c-4273-8b45-75967c9f256c", "ResourceType" -> "Function", "Version" -> "1.0.0", "Description" -> "Create a lognormal distribution using mean and median as parameters instead of the conventional parameters",
           "RepositoryLocation" -> URL[
           "https://www.wolframcloud.com/obj/resourcesystem/api/1.0"],
           "SymbolName" -> "FunctionRepository`$99b6a6fd8fd648c4ac9074ef8877525c`MeanMedianLogNormalDistribution", "FunctionLocation" -> CloudObject[
           "https://www.wolframcloud.com/obj/da0748d9-6cbb-4132-98fd-fdd3c764b25c"]|>, ResourceSystemBase -> Automatic]][100, 70], n]]];

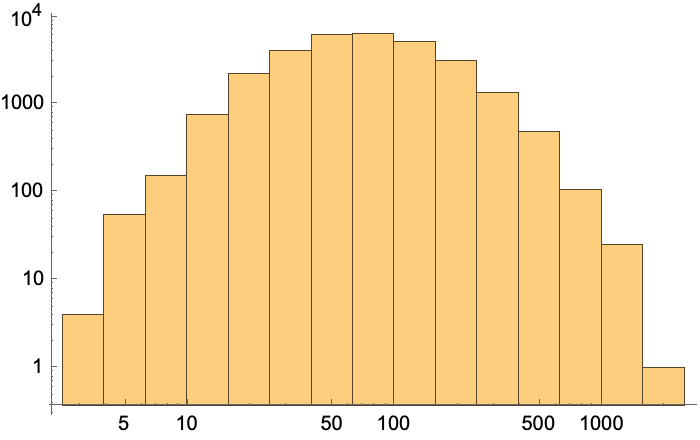
Show the distribution of voting power:

In[35]:=
Histogram[voters, {"Log", 10}, {"Log", "Count"}]
Out[35]=

Bin the voters into 10 groups ("deciles") each with the same number of voters:

In[36]:=
(partitionedVoters = Partition[voters, 3000]) // ResourceFunction[
ResourceObject[<|"Name" -> "AugmentedTerse", "ShortName" -> "AugmentedTerse", "UUID" -> "55ad4cc5-e284-40ca-a3cb-8a4166c38701", "ResourceType" -> "Function", "Version" -> "1.0.0", "Description" -> "An operator form of Short with an alternative compressed representation of the output", "RepositoryLocation" -> URL[
      "https://www.wolframcloud.com/obj/resourcesystem/api/1.0"], "SymbolName" -> "FunctionRepository`$779c3314c408433eb6df4354526edb23`AugmentedTerse", "FunctionLocation" -> CloudObject[
      "https://www.wolframcloud.com/obj/5aa416ea-2adb-41c1-9102-ddaa33f49612"]|>, ResourceSystemBase -> Automatic]][5]
Out[36]=

Get the total number of votes in each decile:

In[37]:=
clusterTotals = Map[Total, partitionedVoters]
Out[37]=

Get the ranges of votes within each decile:

In[38]:=
clusterRanges = Map[MinMax, partitionedVoters]
Out[38]=

Find the Banzhaf power index of each decile:

In[39]:=
AssociationThread[Table[StringTemplate["Decile `1`"][i], {i, 10}], ResourceFunction["BanzhafPowerIndex"][clusterTotals]] // N
Out[39]=

Change the rules so that each voter received the square root of the number of votes that they possess:

In[40]:=
voters2 = Map[Sqrt, voters] // N;
partitionedVoters2 = Partition[voters2, 3000];
clusterTotals2 = Map[Total/*Round, partitionedVoters2];
AssociationThread[Table[StringTemplate["Decile `1`"][i], {i, 10}], ResourceFunction["BanzhafPowerIndex"][clusterTotals2]] // N
Out[41]=

Publisher

Seth J. Chandler

Version History

  • 1.0.0 – 19 August 2022

Source Metadata

Related Resources

Author Notes

The error in the Bilbao paper relates to the parts of the CoefficientList it totals. I have corrected it by creating an Association and then using Lookup. I have contacted the lead author to alert him to the problem.

License Information