Wolfram Function Repository
Instant-use add-on functions for the Wolfram Language
Function Repository Resource:
Retrieve US election data by year and office from Dave Leip's Atlas of US Presidential Elections
ResourceFunction["USElectionAtlasData"][] retrieves per-state popular vote tallies for the most recent US presidential election. | |
ResourceFunction["USElectionAtlasData"][year] retrieves per-state popular vote tallies for the US presidential election held in year. | |
ResourceFunction["USElectionAtlasData"][year,office] retrieves per-state popular vote tallies for the US election for office held in year. |
Get a Dataset of popular vote totals for the most recent presidential election:
| In[1]:= |
| Out[1]= | 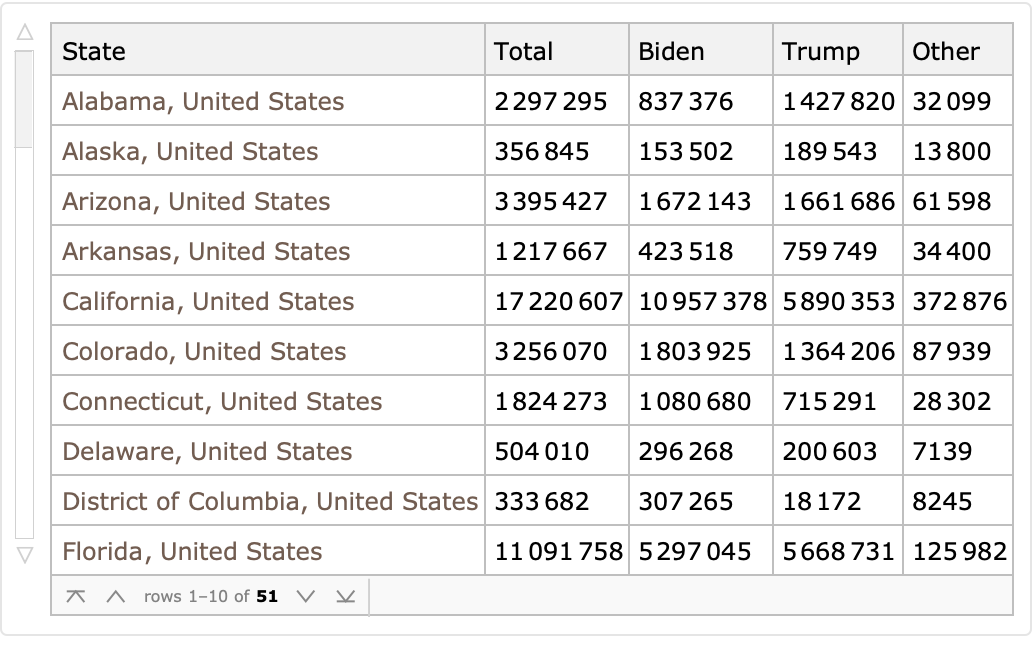 |
Get popular vote totals for the 2000 Bush versus Gore election:
| In[2]:= |
| Out[2]= | 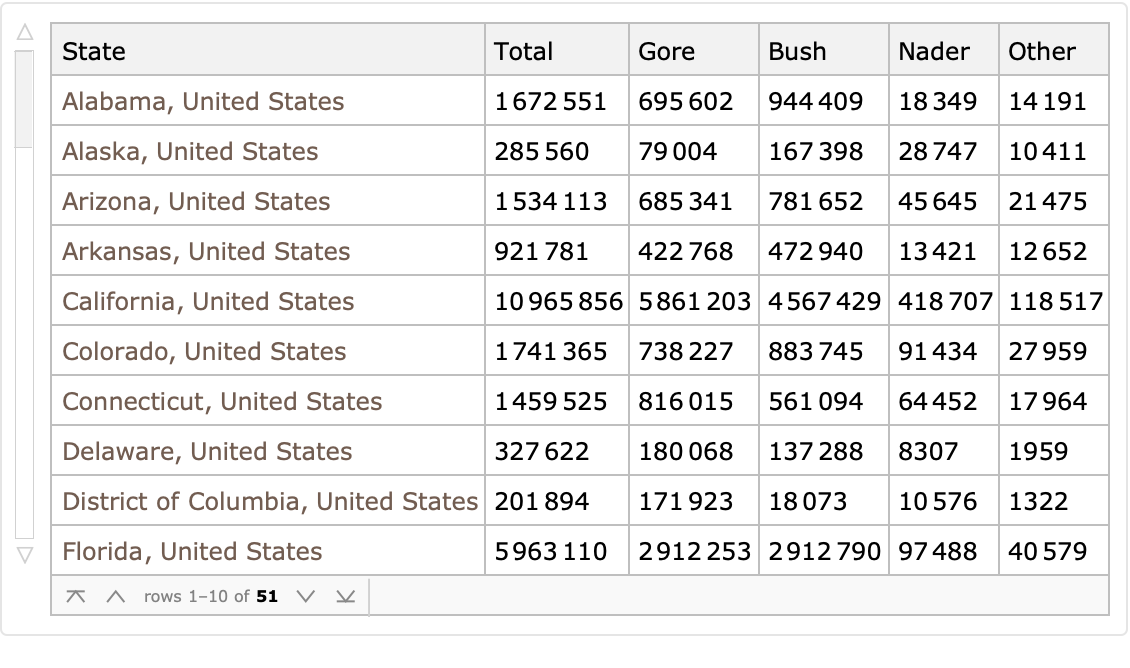 |
Look at House vote totals for the 2014 midterm elections:
| In[3]:= |
| Out[3]= | 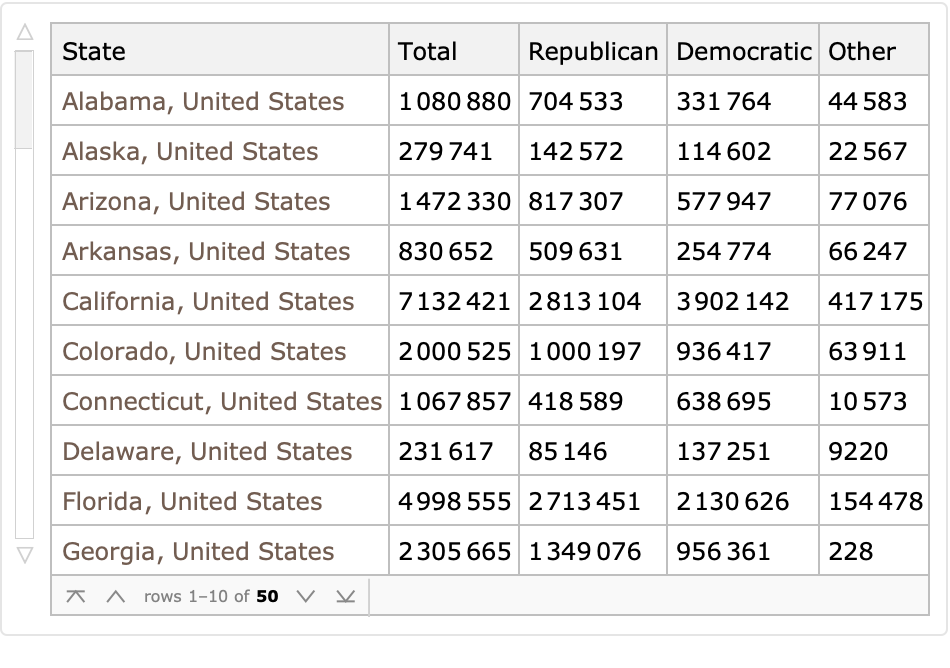 |
Get per-candidate popular vote totals from historical presidential races:
| In[4]:= |
| Out[4]= | 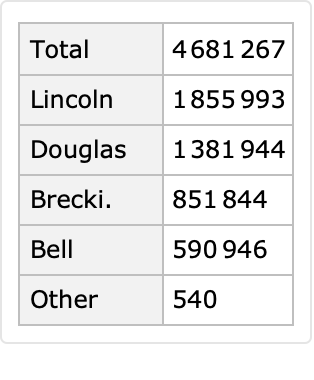 |
Compare voter turnout for the House between the two most recent midterm elections:
| In[5]:= | ![house2018 = ResourceFunction["USElectionAtlasData"][2018, "House"]; house2014 = ResourceFunction["USElectionAtlasData"][2014, "House"];](https://www.wolframcloud.com/obj/resourcesystem/images/493/4933f08c-d4e2-41d7-9937-f3a9c756afbf/77dfa56b2365f329.png) |
| In[6]:= |
| Out[6]= |
| In[7]:= |
| Out[7]= |
Look at vote counts for your home state:
| In[8]:= |
| Out[8]= | 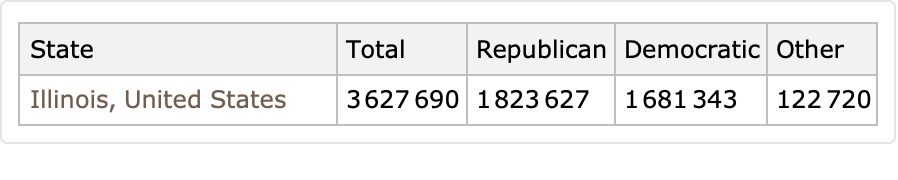 |
Create a map of the popular vote margin in the 2008 Obama-McCain race:
| In[9]:= |
| In[10]:= | ![GeoRegionValuePlot[votes[All, #State -> #Obama - #McCain &], GeoRange -> \!\(\*
NamespaceBox["LinguisticAssistant",
DynamicModuleBox[{Typeset`query$$ = "united states", Typeset`boxes$$ =
TemplateBox[{"\"United States\"",
RowBox[{"Entity", "[",
RowBox[{"\"Country\"", ",", "\"UnitedStates\""}], "]"}], "\"Entity[\\\"Country\\\", \\\"UnitedStates\\\"]\"", "\"country\""}, "Entity"], Typeset`allassumptions$$ = {}, Typeset`assumptions$$ = {}, Typeset`open$$ = {1, 2}, Typeset`querystate$$ = {"Online" -> True, "Allowed" -> True, "mparse.jsp" -> 0.717496, "Messages" -> {}}},
DynamicBox[ToBoxes[
AlphaIntegration`LinguisticAssistantBoxes["", 4, Automatic,
Dynamic[Typeset`query$$],
Dynamic[Typeset`boxes$$],
Dynamic[Typeset`allassumptions$$],
Dynamic[Typeset`assumptions$$],
Dynamic[Typeset`open$$],
Dynamic[Typeset`querystate$$]], StandardForm],
ImageSizeCache->{182.25, {8.125, 17.125}},
TrackedSymbols:>{Typeset`query$$, Typeset`boxes$$, Typeset`allassumptions$$, Typeset`assumptions$$, Typeset`open$$, Typeset`querystate$$}],
DynamicModuleValues:>{},
UndoTrackedVariables:>{Typeset`open$$}],
BaseStyle->{"Deploy"},
DeleteWithContents->True,
Editable->False,
SelectWithContents->True]\), ColorFunction -> (Blend[Lighter /@ {Red, Blue}, #] &)]](https://www.wolframcloud.com/obj/resourcesystem/images/493/4933f08c-d4e2-41d7-9937-f3a9c756afbf/0a5dd86cc01c5792.png) |
| Out[10]= | 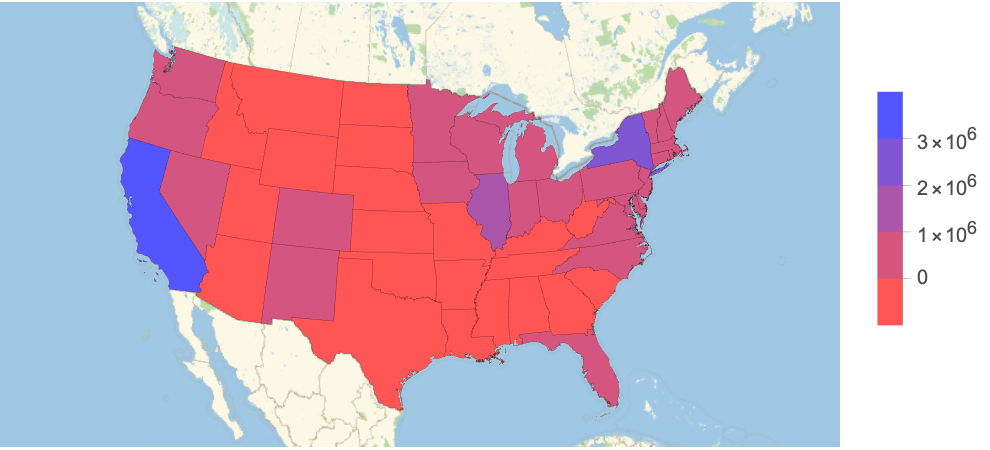 |
Count up the total votes cast for Theodore Roosevelt in his four electoral wins:
| In[11]:= | ![Dataset[Merge[
Table[Normal@
ResourceFunction["USElectionAtlasData"][year][Total, Rest], {year, Range[1932, 1944, 4]}], Total]]["Roosev."]](https://www.wolframcloud.com/obj/resourcesystem/images/493/4933f08c-d4e2-41d7-9937-f3a9c756afbf/2c377dc7fba403c9.png) |
| Out[11]= |
Plot vote totals for the popular vote winners of all presidential elections for the last century:
| In[12]:= | ![ListPlot@
Table[{year, Max@ResourceFunction["USElectionAtlasData"][year][Total, 3 ;;]}, {year, Range[1920, 2020, 4]}]](https://www.wolframcloud.com/obj/resourcesystem/images/493/4933f08c-d4e2-41d7-9937-f3a9c756afbf/6ed71ddb7d357514.png) |
| Out[12]= | 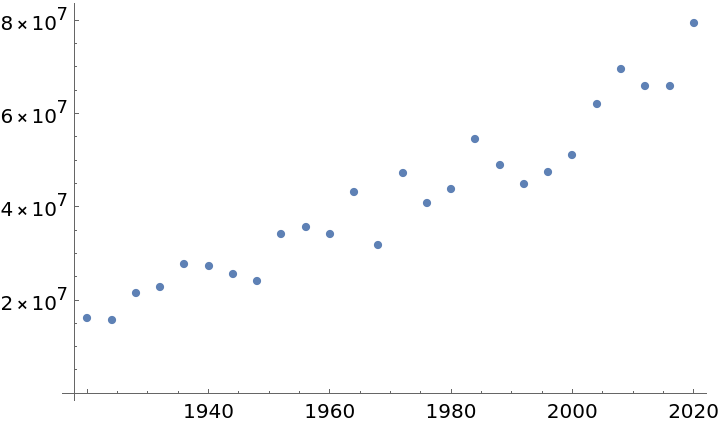 |
This work is licensed under a Creative Commons Attribution 4.0 International License