Basic Examples (3)
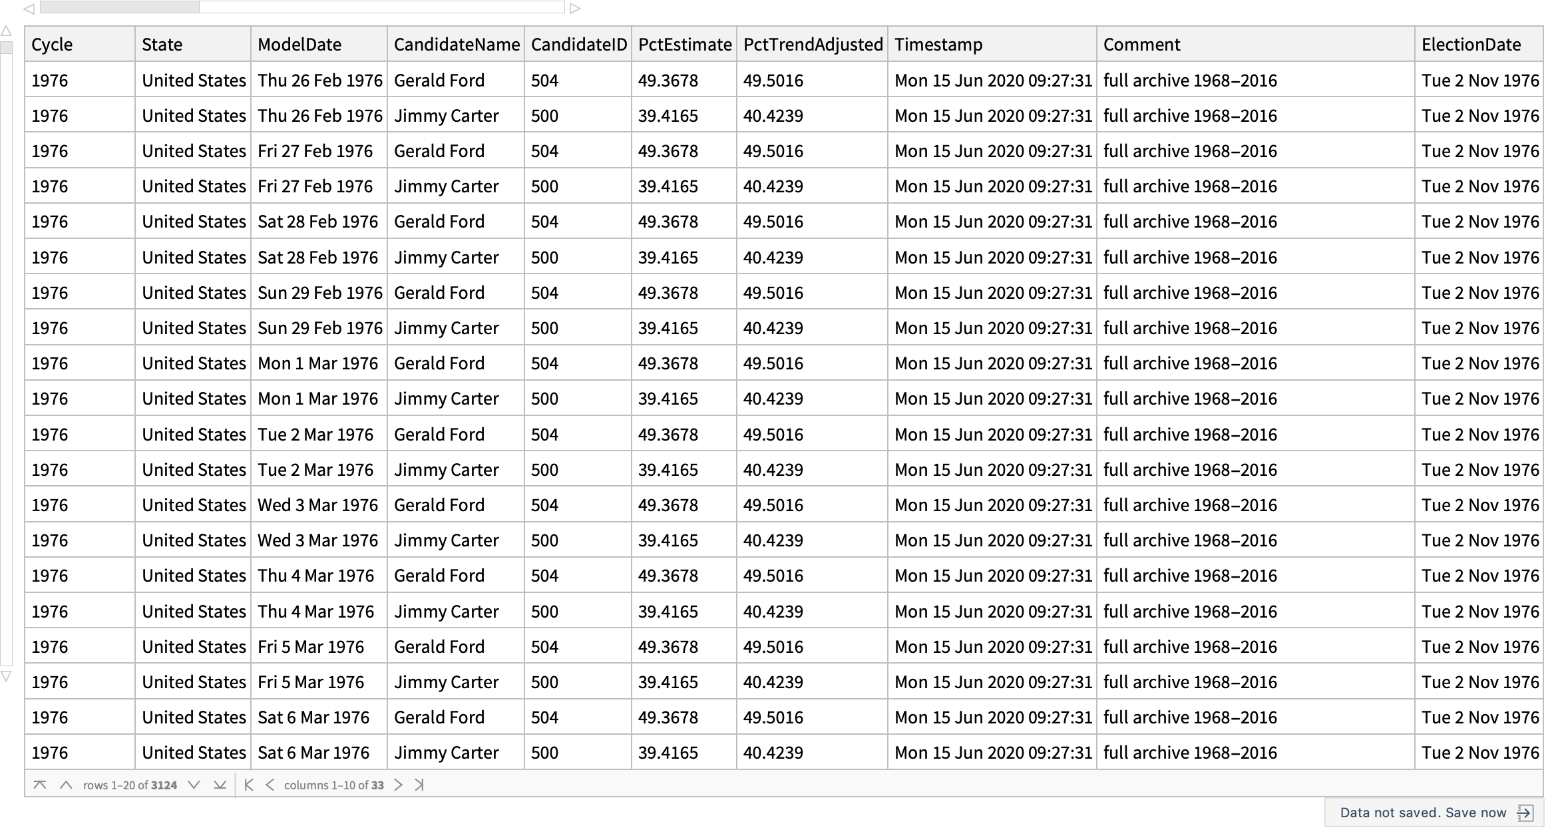
Get polling data for the 1976 US presidential election from fivethirtyeight.com:
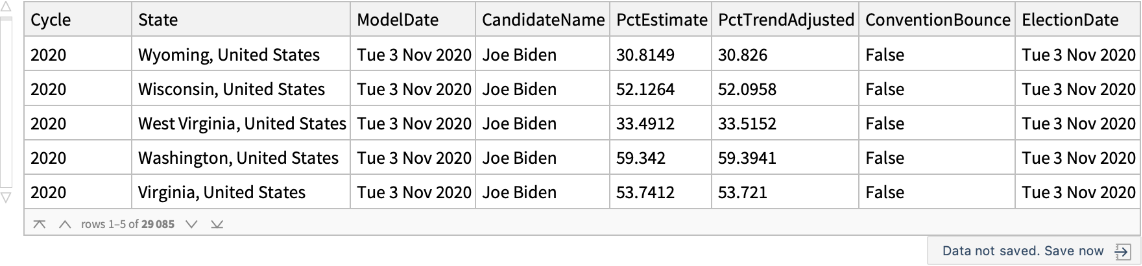
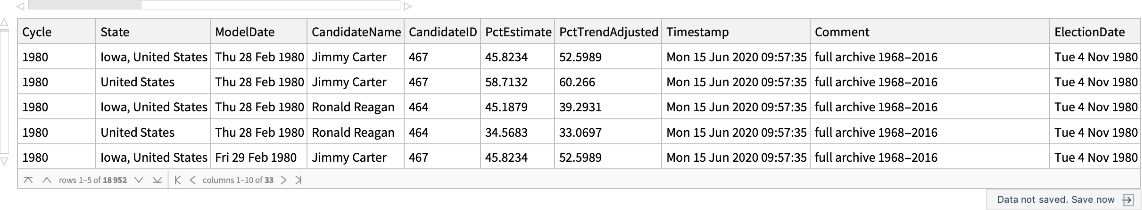
Retrieve polling data for the 2020 election cycle:
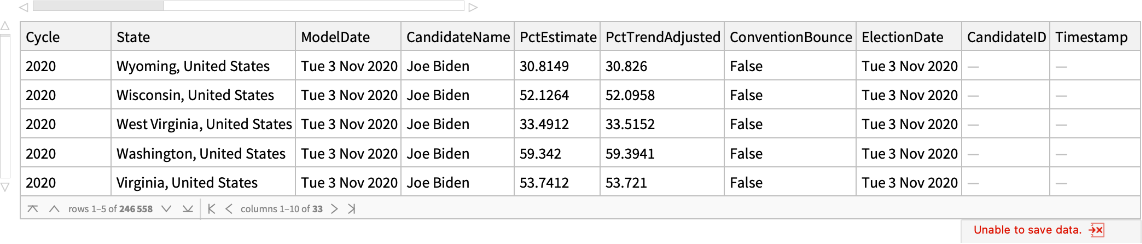
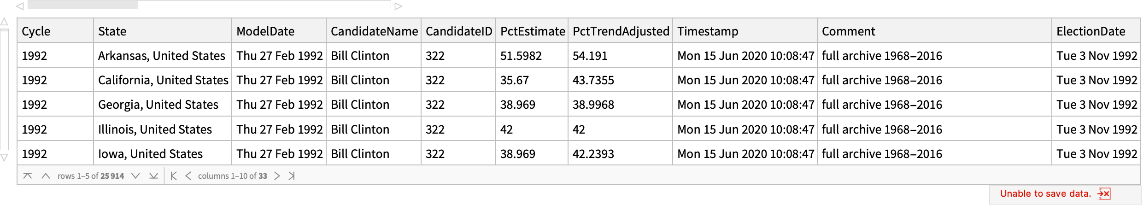
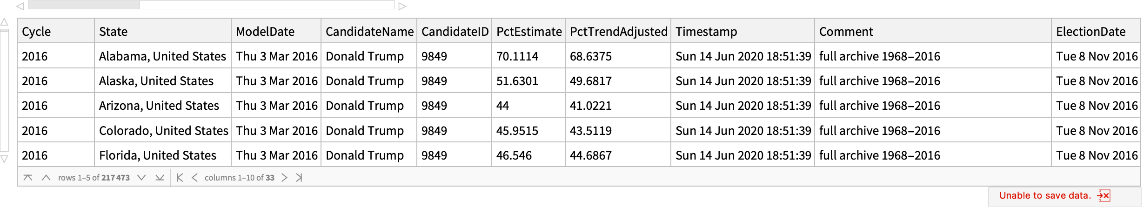
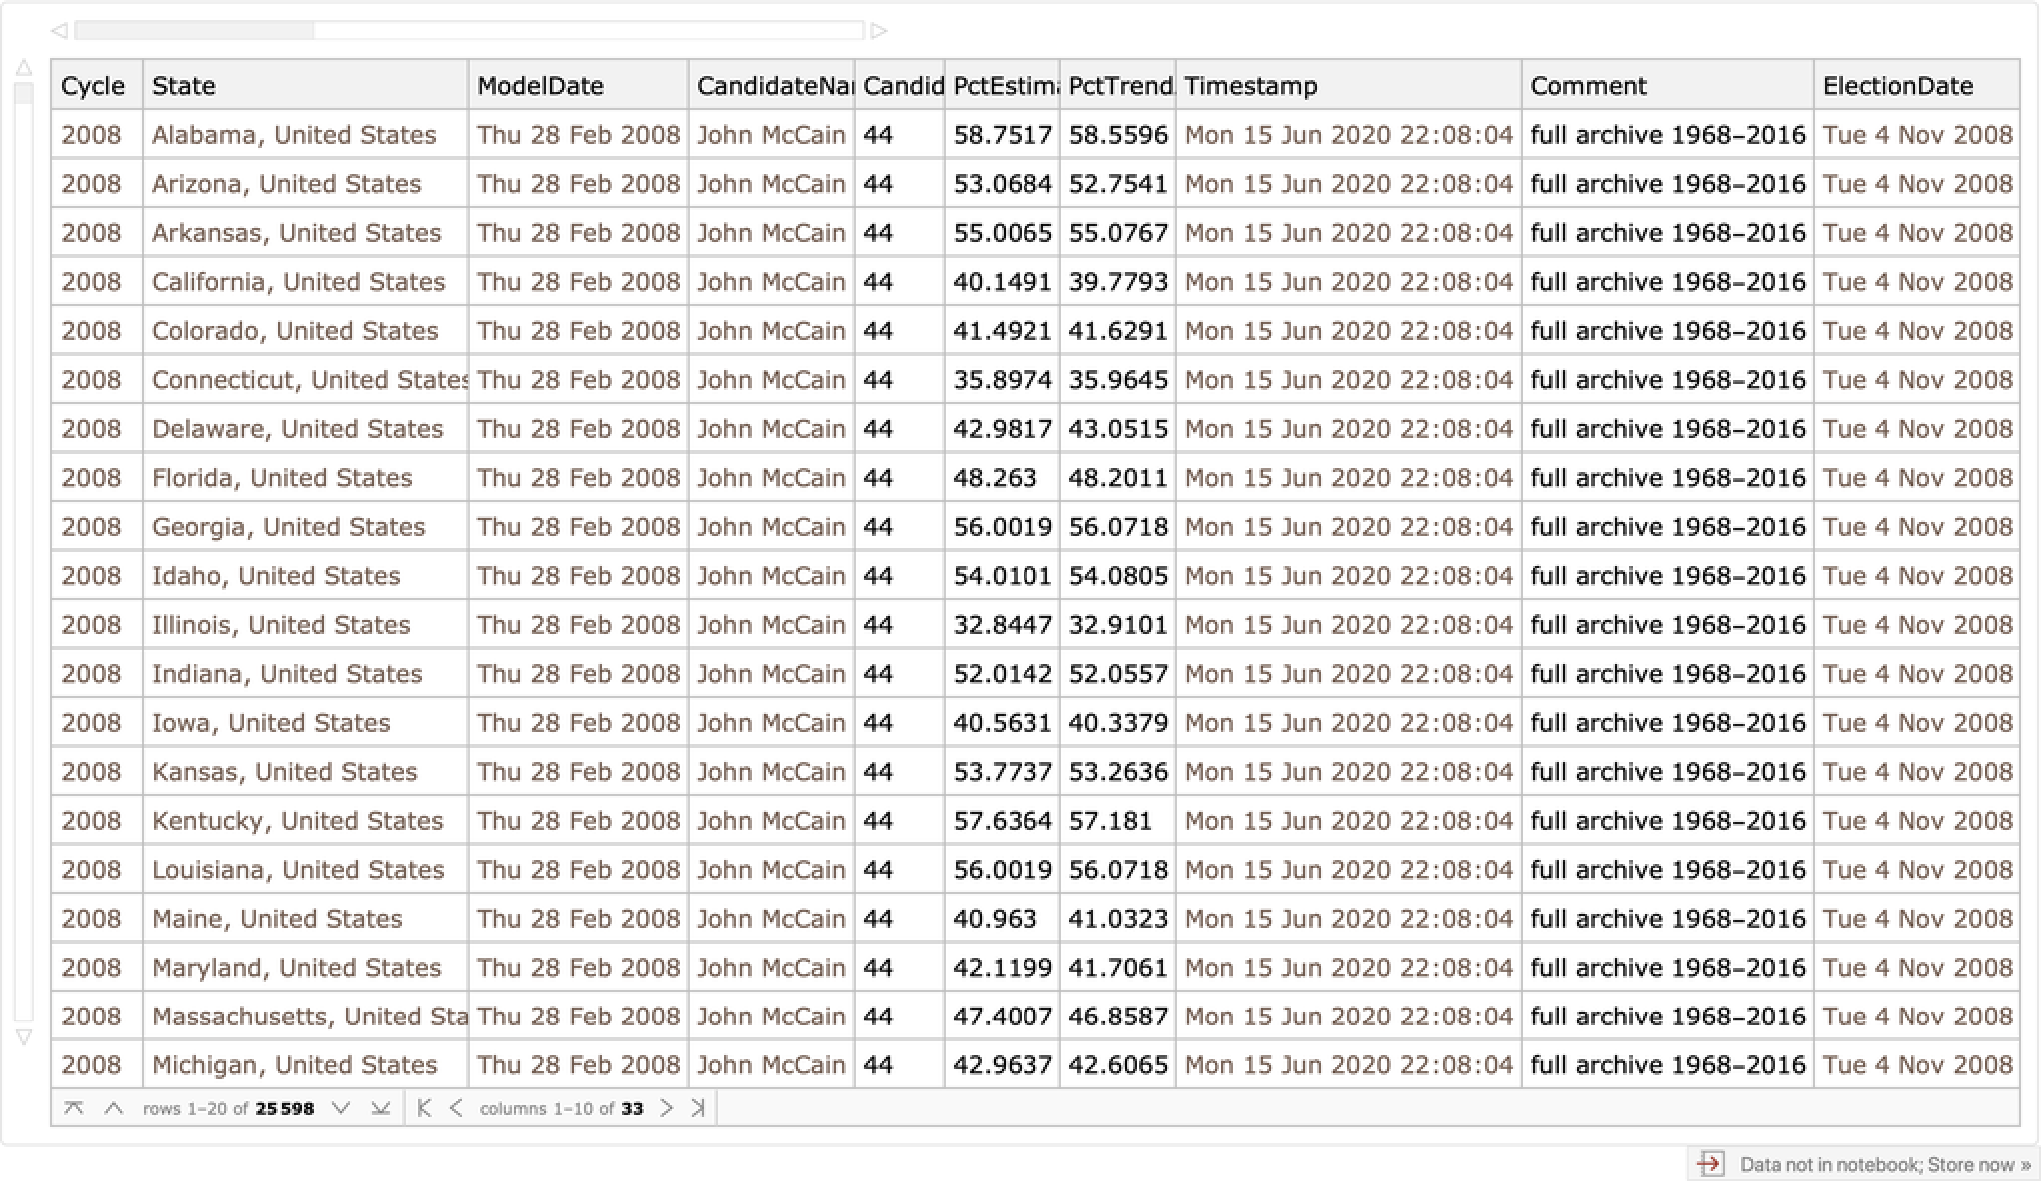
Get all polling data:
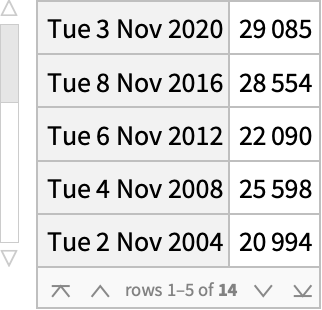
See the included elections dates:
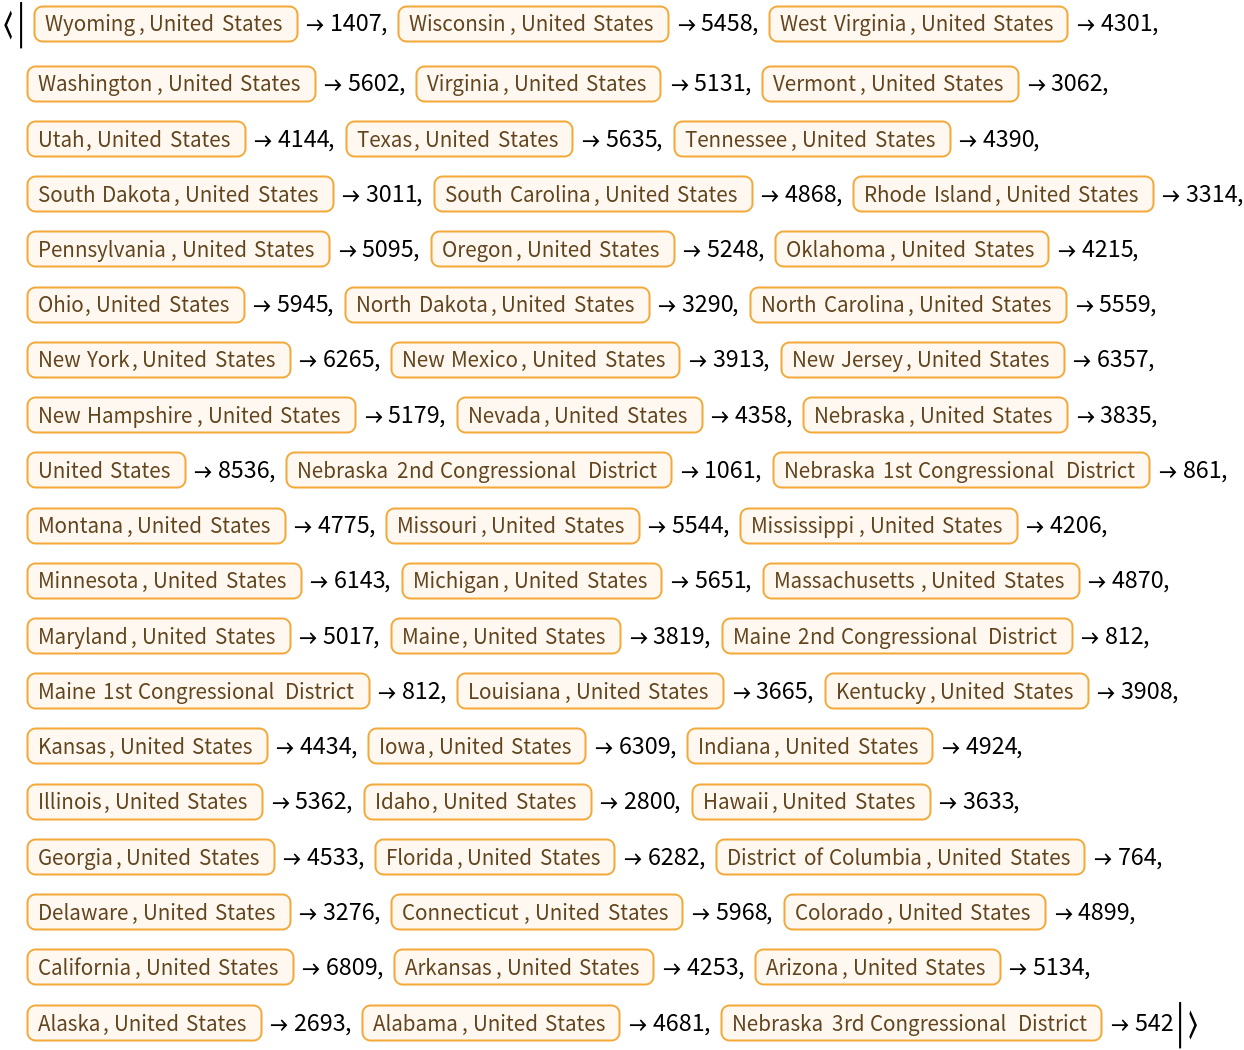
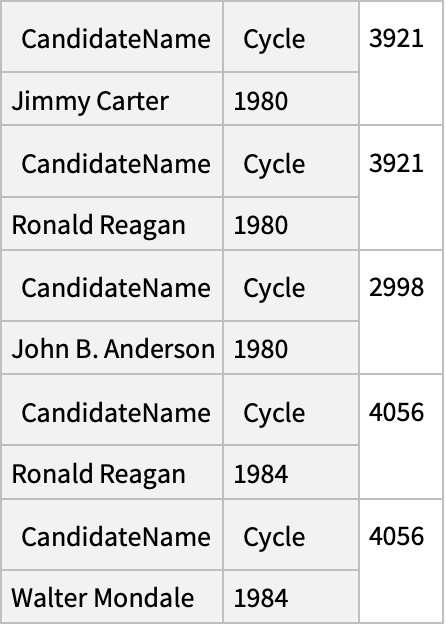
See the number of statewide averages for each state or region:
Scope (3)
Use a DateObject to specify the date:
Get data for two elections:
Get all polling data without the current election cycle using "Historic":
Applications (3)
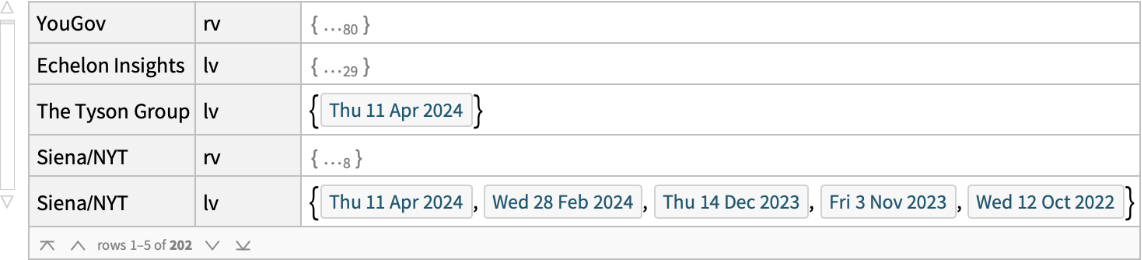
Get current polling for the 2024 election and group all the polls by pollster and population, then split by polling date:
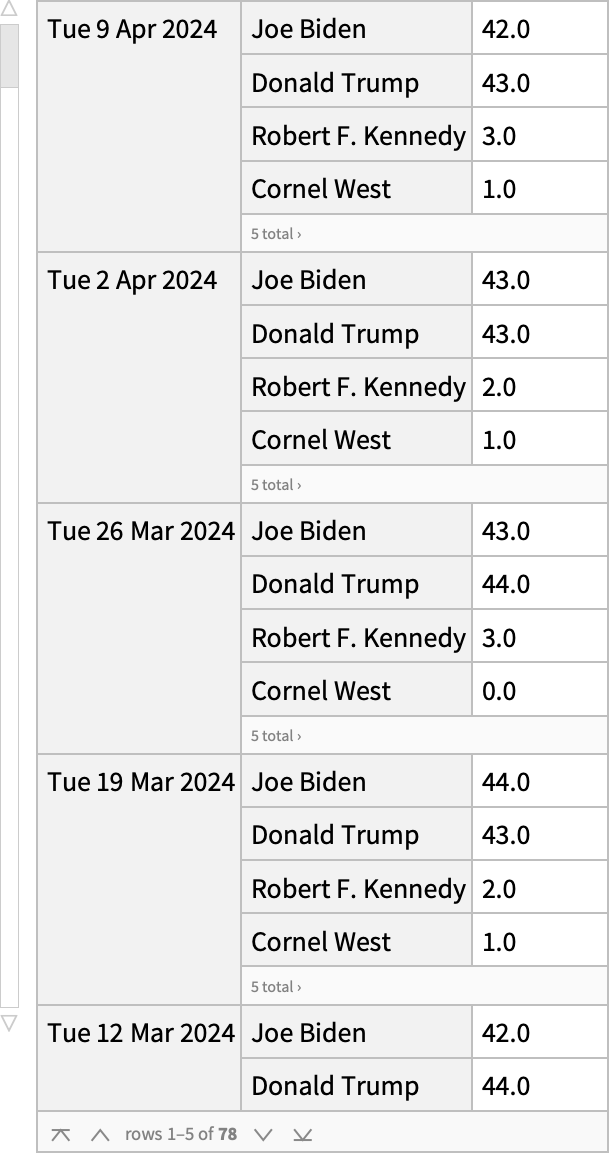
For each date, find a single value for each candidate. The Min will use many-candidate results over two-candidate results:
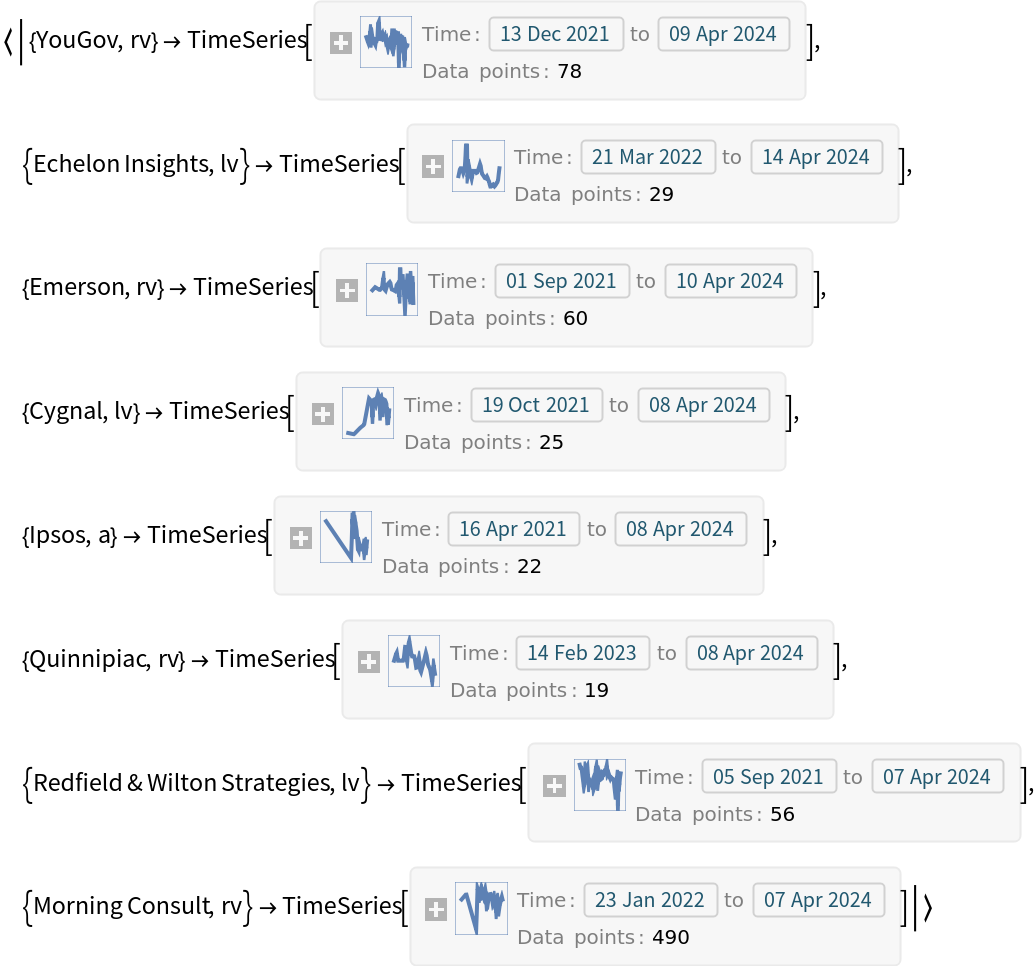
Create time series from the data, eliminating pollsters without recent or many polls:
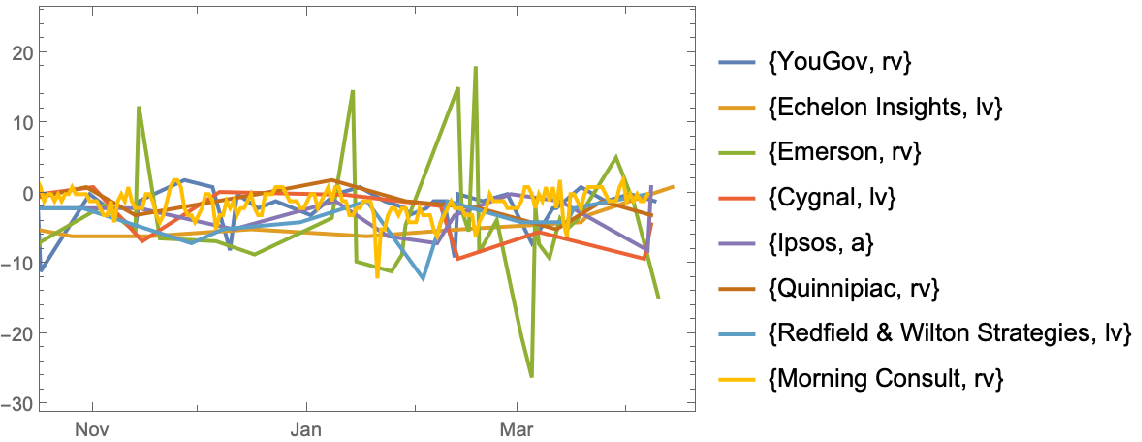
Plot all the series:
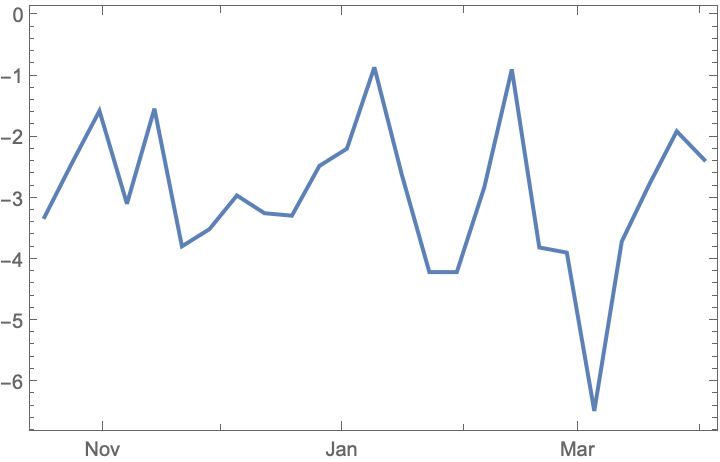
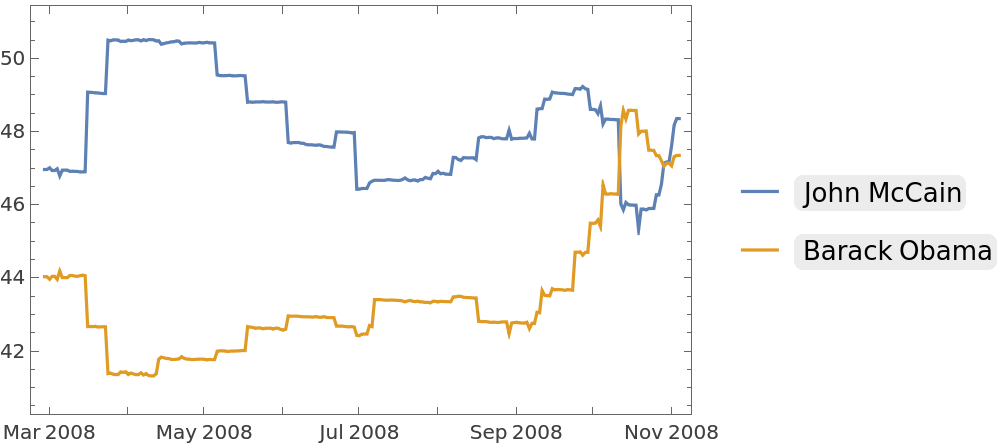
Take a simple average over the pollsters at regular intervals and plot the result:
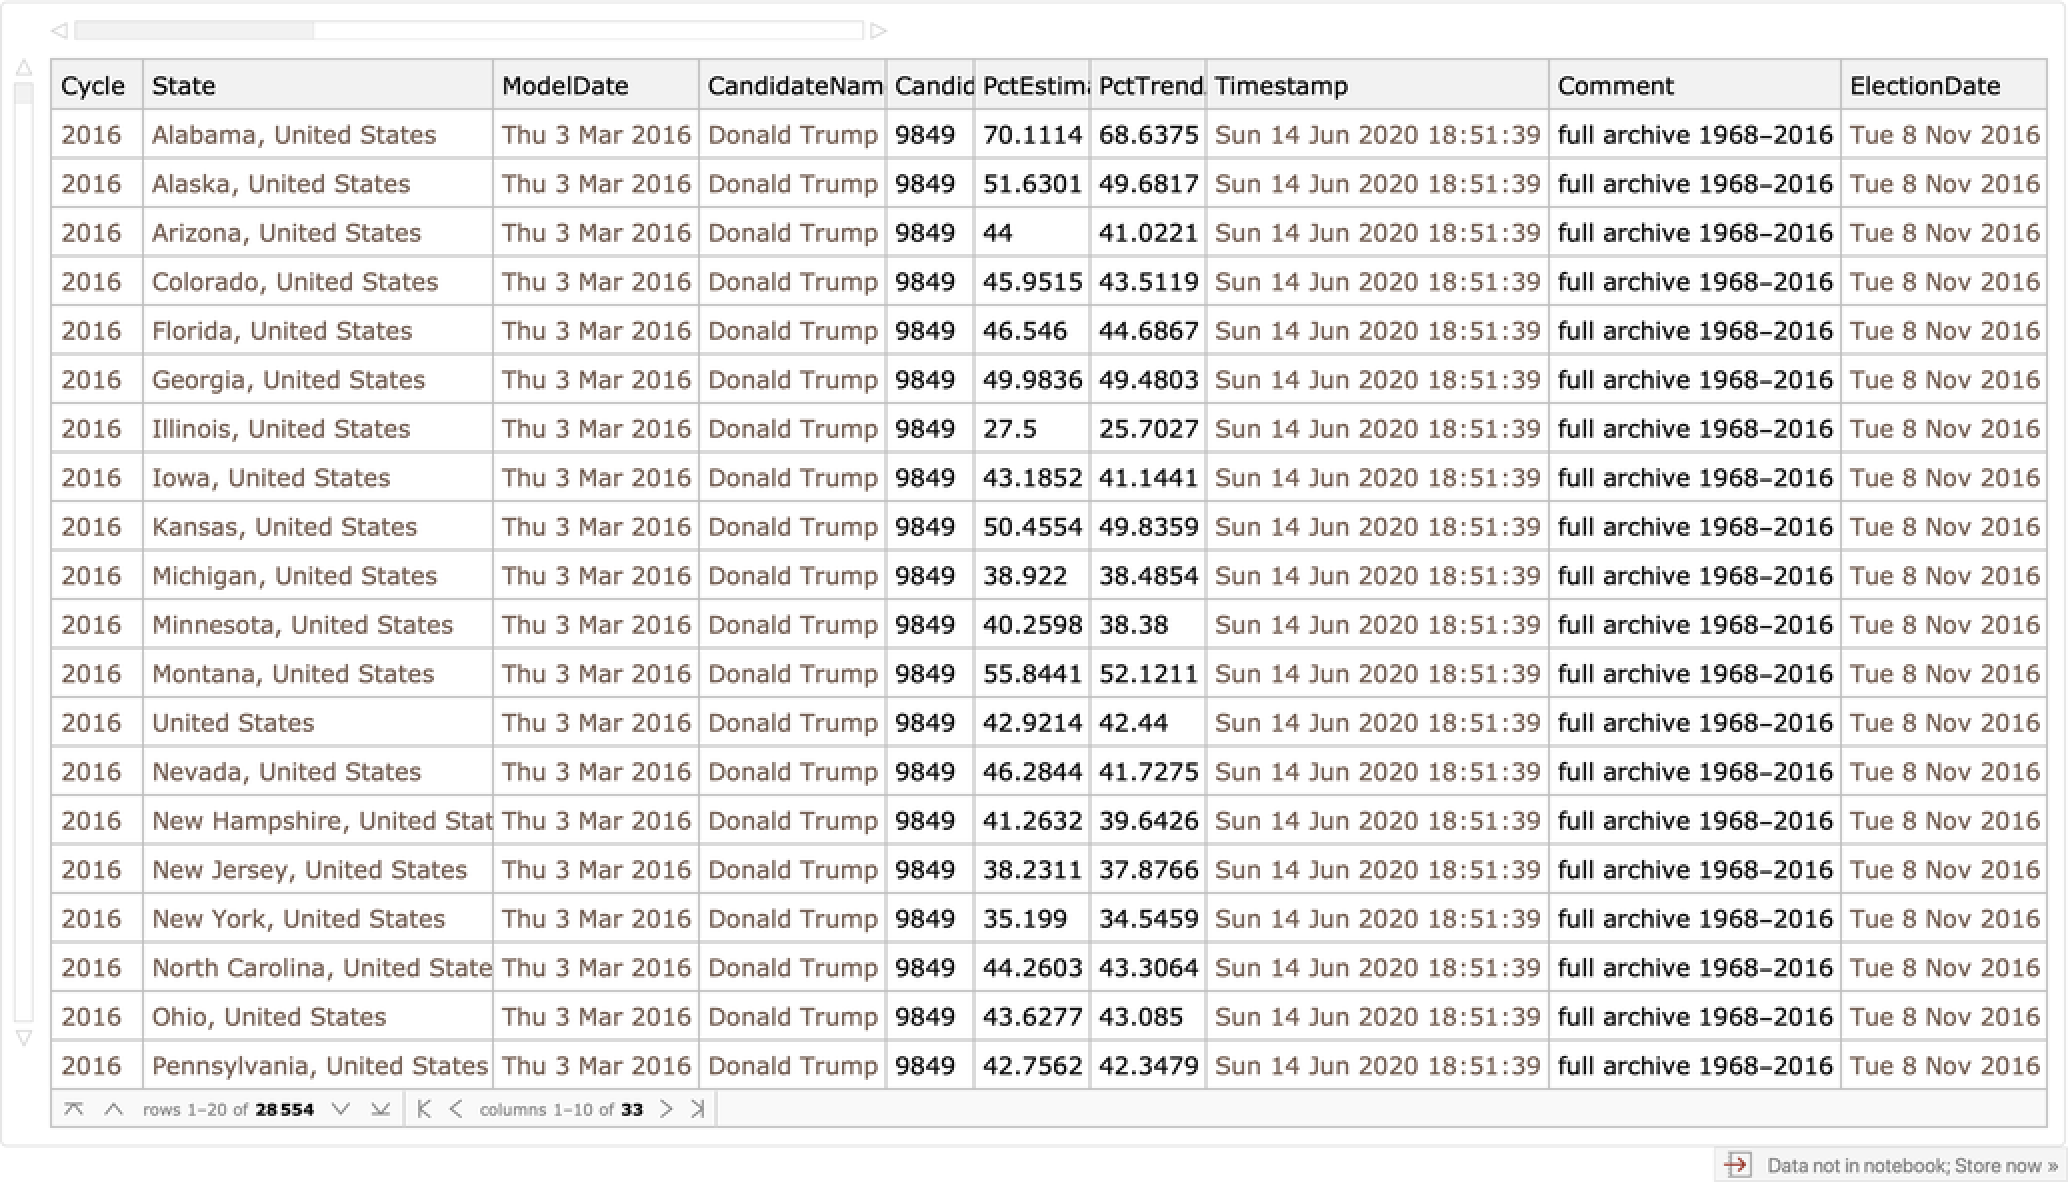
Select data from just one election:
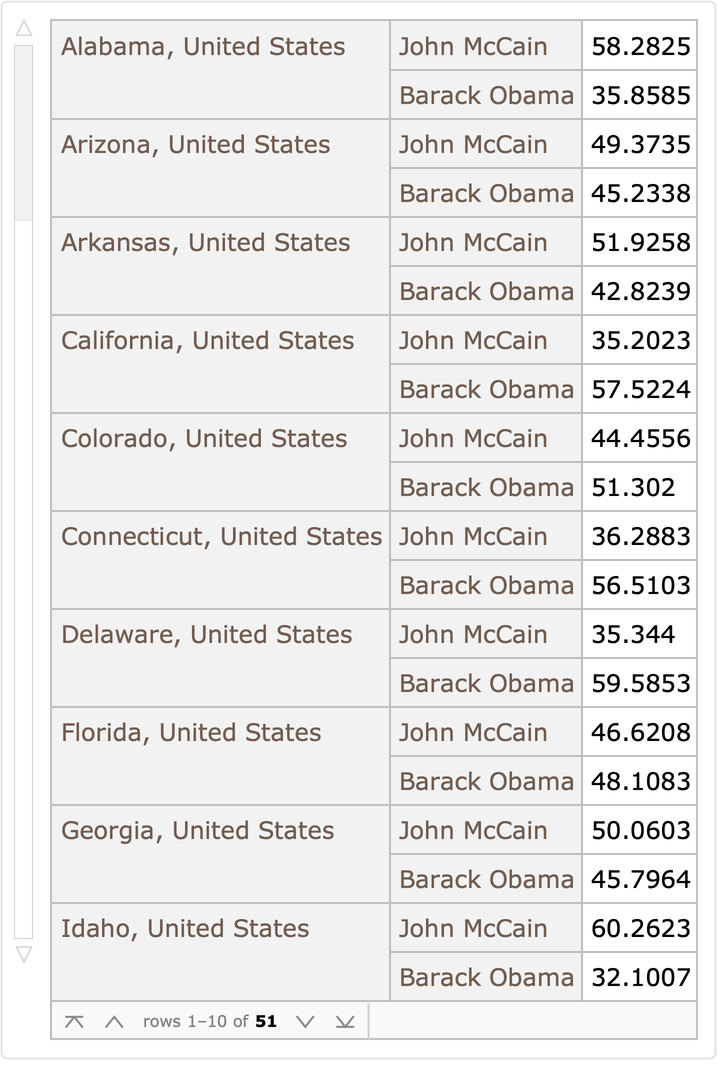
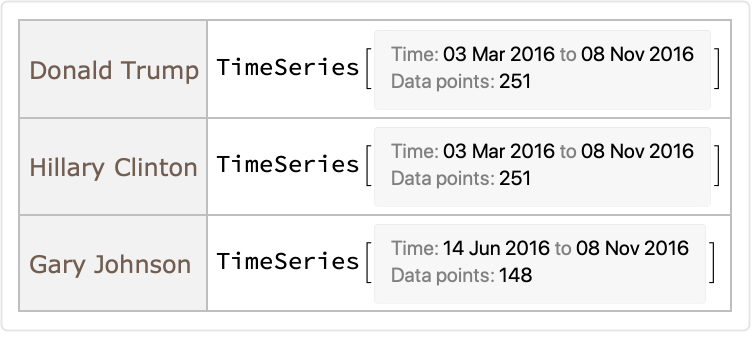
See the candidates:
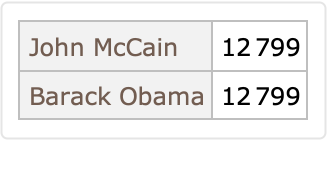
Get the last result for each state:
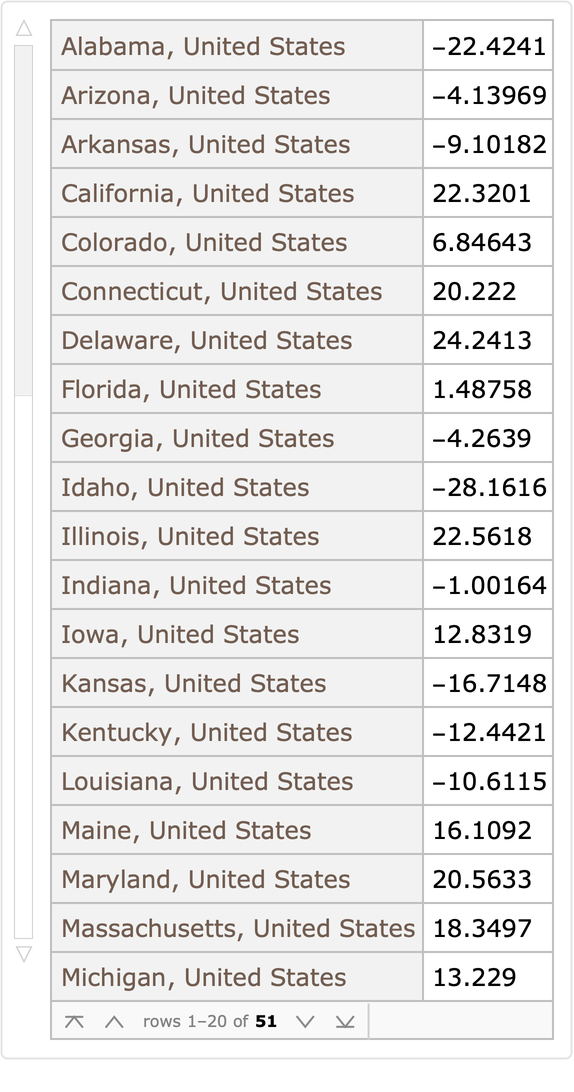
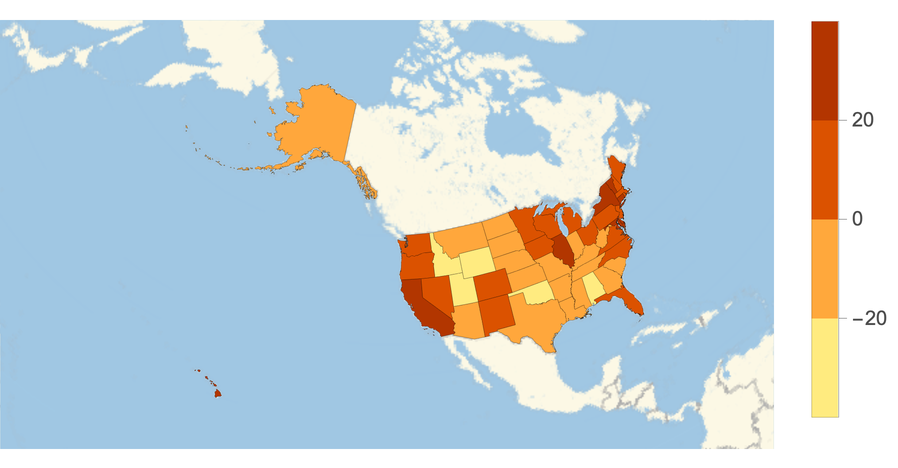
Calculate the estimated difference in support between the two candidates:
Calculate timeline plots for each state:
Create a map of the support difference which shows the timelines when hovered:
Get data for another election:
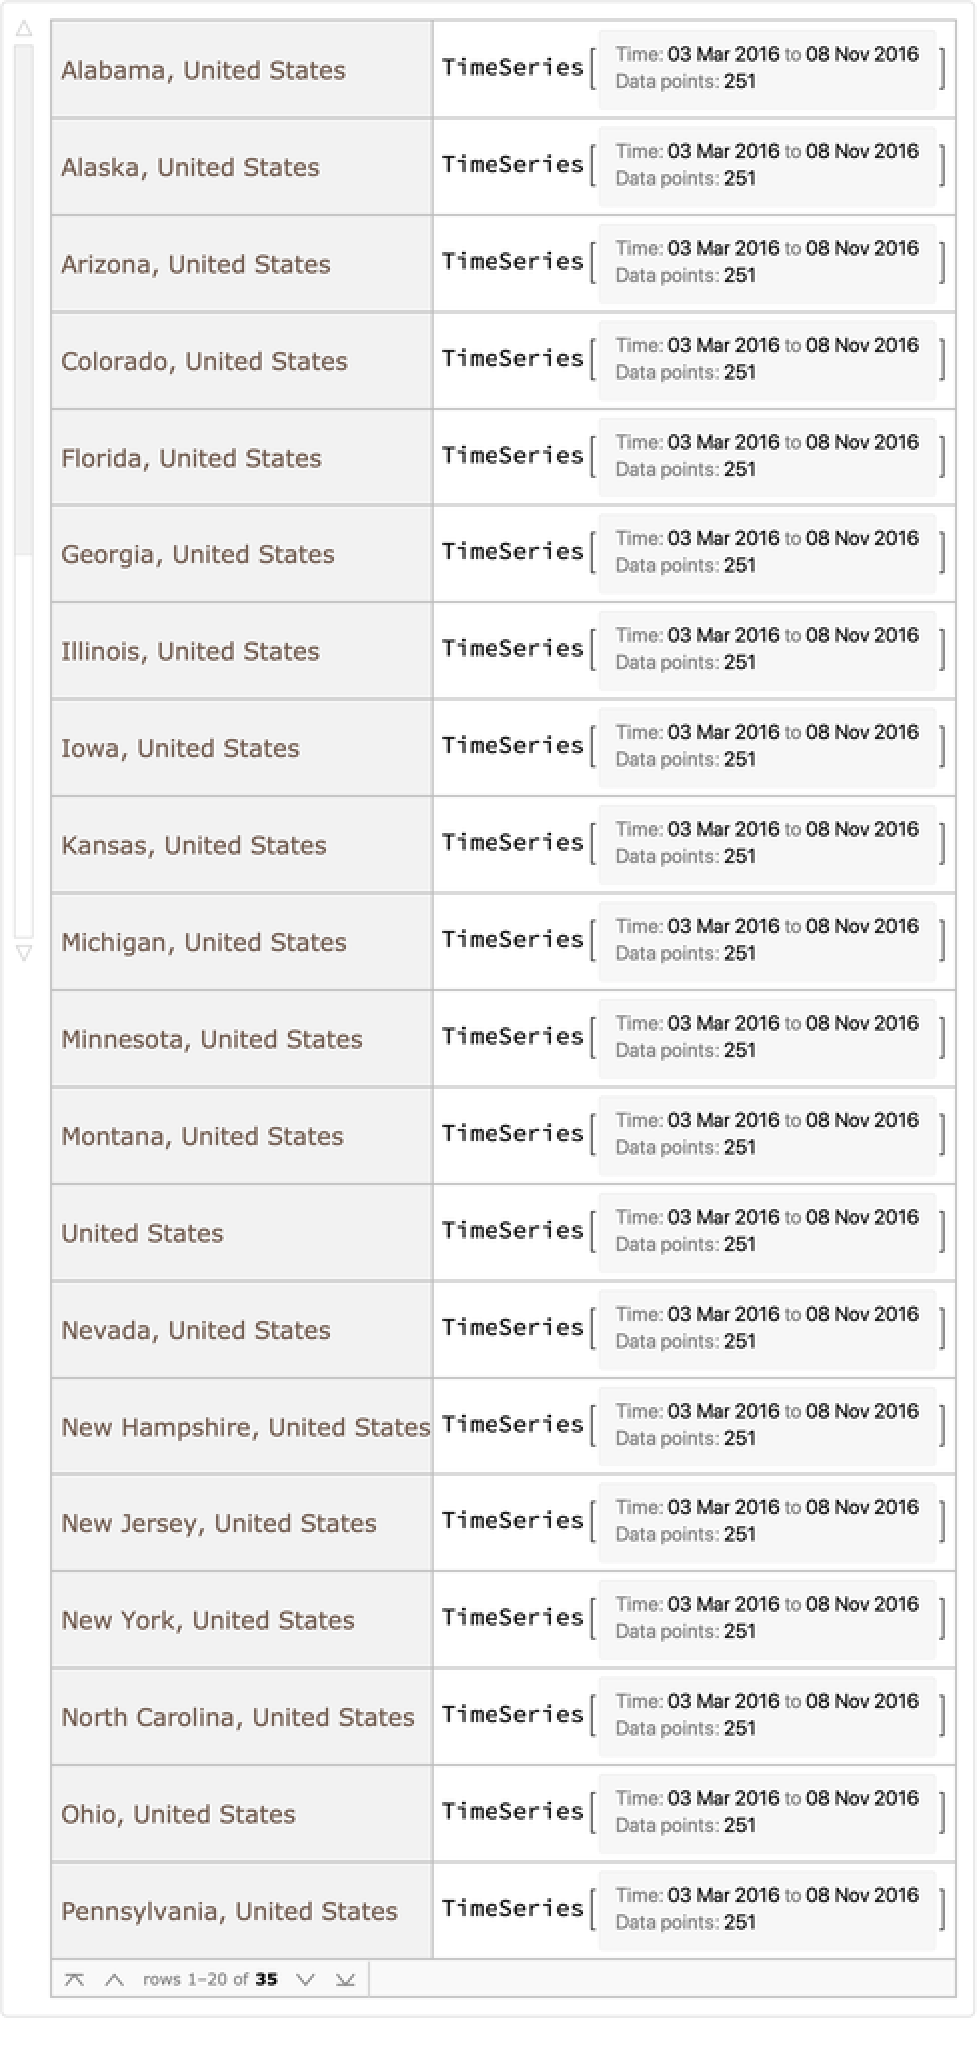
Create time series data for each state:
Get the difference in support between the top two candidates over time for each state with over two hundred estimates:
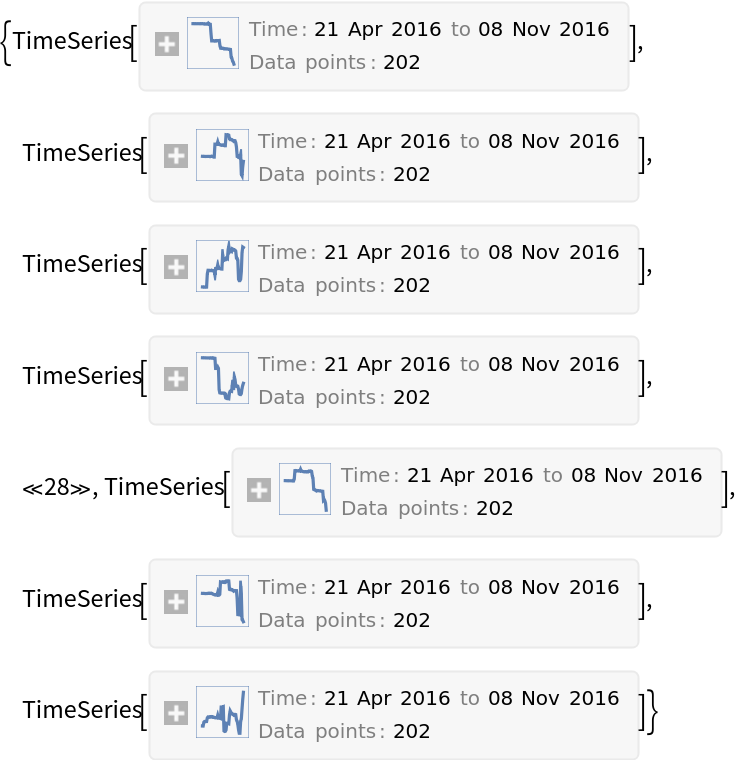
Create a list of TimeSeries with samples over the smallest common range:
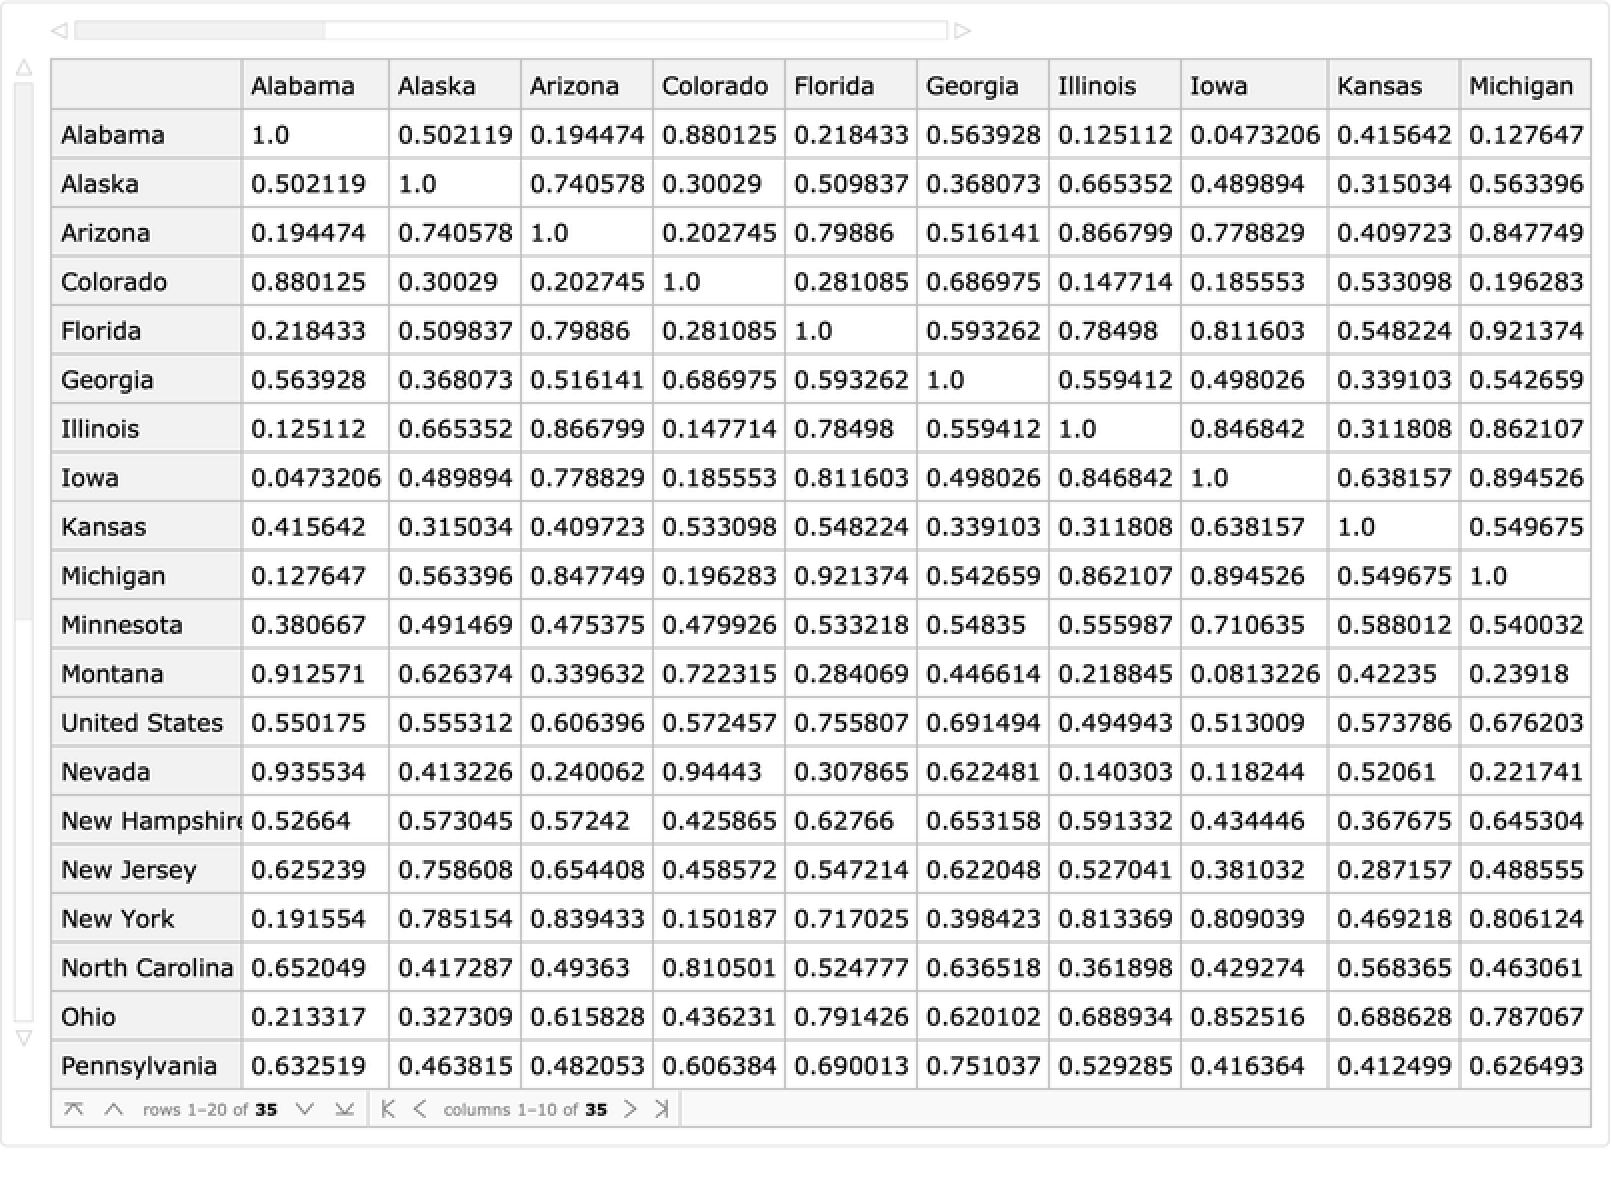
Calculate the correlations between states:
See the results:
Visualize it:
Possible Issues (3)
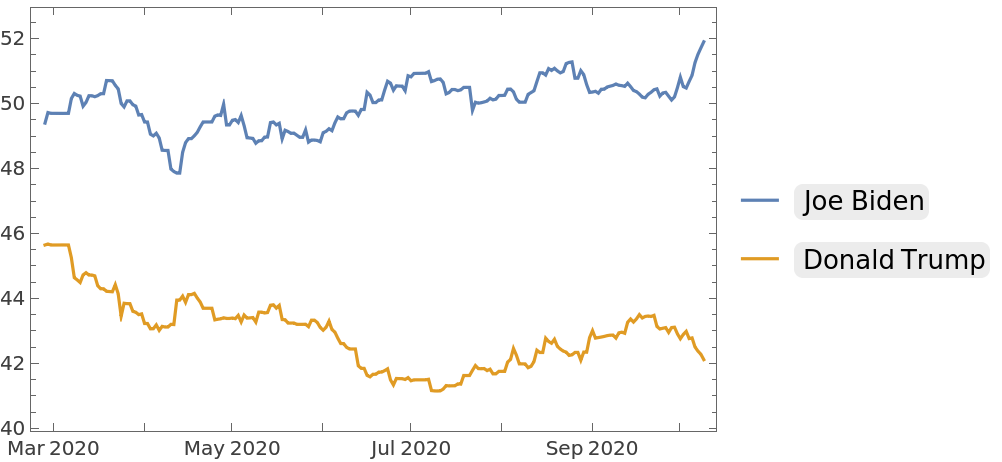
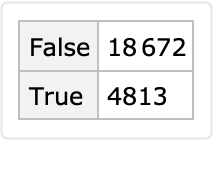
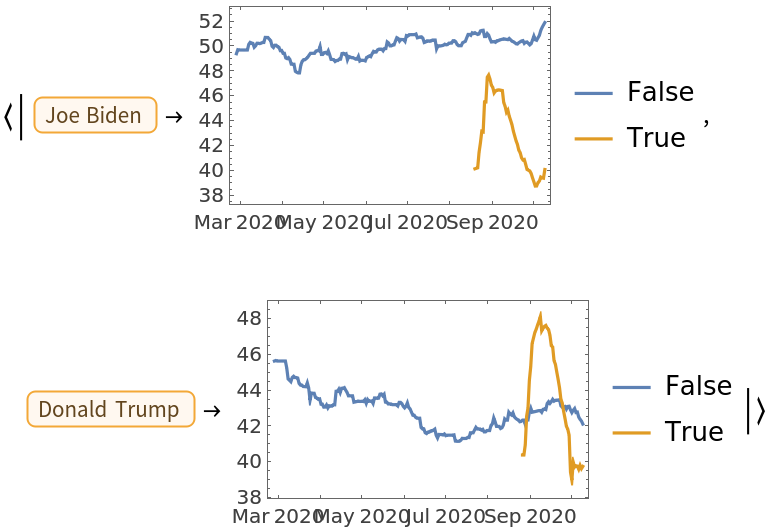
The 2020 data includes numbers adjusted for convention bounces:
The bounce-adjusted numbers differ considerably from the standard average:
Use only non-bounce-adjusted values instead:
![current = ResourceFunction[
"FiveThirtyEightPresidentialPollingAverages", ResourceSystemBase -> "https://www.wolframcloud.com/obj/resourcesystem/api/1.0"][2024];
bypollster = current[GroupBy[{#"Pollster", #"Population"} &]][All, GroupBy["EndDate"]];
bypollster[All, Keys]](https://www.wolframcloud.com/obj/resourcesystem/images/15f/15f9aff5-50a2-4a85-854c-20e49e941cc6/32f2649607a6b129.png)
![bypollster = bypollster[All, All, GroupBy["CandidateName"], Min@*Lookup["Pct"]][
All, Select[KeyExistsQ[Entity["Person", "JosephBiden::9g8qp"]]]];
First[bypollster]](https://www.wolframcloud.com/obj/resourcesystem/images/15f/15f9aff5-50a2-4a85-854c-20e49e941cc6/712b94feae95ddc2.png)
![rawseries = Transpose /@ Normal[bypollster[All, All, #[Entity["Person", "JosephBiden::9g8qp"] ] - #[
Entity["Person", "DonaldTrump::6vv3q"]] &][
All, {Keys[#], Values[#]} &]];
longseries = TimeSeries /@ Select[rawseries, Length[#] > 10 && #[[1, 1]] > (Today - Quantity[2, "Weeks"]) && #[[-1, 1]] < (Today - Quantity[6, "Months"]) &]](https://www.wolframcloud.com/obj/resourcesystem/images/15f/15f9aff5-50a2-4a85-854c-20e49e941cc6/5e436d4115dd1239.png)
![DateListPlot@
Table[{date, Mean[(#[date]) & /@ longseries]}, {date, DateRange[(Today - Quantity[6, "Months"]), (Today - Quantity[2, "Weeks"]), Quantity[1, "Weeks"]]}]](https://www.wolframcloud.com/obj/resourcesystem/images/15f/15f9aff5-50a2-4a85-854c-20e49e941cc6/7c06983b2f9e2d92.png)
![timelines = oneelection[GroupBy["State"], GroupBy["CandidateName"], All, {"ModelDate", "PctEstimate"}][All, DateListPlot, Values/*TimeSeries];
timelines[Entity["AdministrativeDivision", {"Missouri", "UnitedStates"}]]](https://www.wolframcloud.com/obj/resourcesystem/images/15f/15f9aff5-50a2-4a85-854c-20e49e941cc6/375d02f6400b5722.png)
![GeoRegionValuePlot[
MapThread[
Tooltip[#1[[1]], #2] -> #1[[2]] &, {Normal[
Normal[KeyDrop[diffbystate, Entity["Country", "UnitedStates"]]]], Normal@Values[KeyDrop[timelines, Entity["Country", "UnitedStates"]]]}]]](https://www.wolframcloud.com/obj/resourcesystem/images/15f/15f9aff5-50a2-4a85-854c-20e49e941cc6/69e860092181c190.png)
![oneelection = Select[ResourceFunction[
"FiveThirtyEightPresidentialPollingAverages", ResourceSystemBase -> "https://www.wolframcloud.com/obj/resourcesystem/api/1.0"][], #Cycle === DateObject[{2016}] &]](https://www.wolframcloud.com/obj/resourcesystem/images/15f/15f9aff5-50a2-4a85-854c-20e49e941cc6/1573d3d7cb5159d9.png)
![timeseries = oneelection[GroupBy["State"], GroupBy["CandidateName"], All, {"ModelDate", "PctEstimate"}][All, All, Values/*TimeSeries];
RandomChoice[timeseries]](https://www.wolframcloud.com/obj/resourcesystem/images/15f/15f9aff5-50a2-4a85-854c-20e49e941cc6/387b9e1b8219a596.png)
![Short[list = Normal@Values@
diffsbystate[All, TimeSeriesResample[#, {diffsbystate[-1]["Dates"]}] &]]](https://www.wolframcloud.com/obj/resourcesystem/images/15f/15f9aff5-50a2-4a85-854c-20e49e941cc6/691035928b1fdcb5.png)
![states = StringDelete[CommonName /@ Normal[Keys[diffsbystate]], ", United States"];
ResourceFunction["DatasetForm"][
AssociationThread[
states -> (AssociationThread[states -> #] & /@ corr)]]](https://www.wolframcloud.com/obj/resourcesystem/images/15f/15f9aff5-50a2-4a85-854c-20e49e941cc6/7ec162e26af6ffb7.png)
![Grid[ MapIndexed[
Item[Tooltip[Graphics[], states[[#2]]], Background -> ColorData["TemperatureMap"][#1]] &, corr, {2}], Spacings -> 0, ItemSize -> .5, Frame -> None]](https://www.wolframcloud.com/obj/resourcesystem/images/15f/15f9aff5-50a2-4a85-854c-20e49e941cc6/06ee555e5eeca889.png)

![Normal@bidentrump[Select[#State === \!\(\*
NamespaceBox["LinguisticAssistant",
DynamicModuleBox[{Typeset`query$$ = "usa", Typeset`boxes$$ = TemplateBox[{"\"United States\"",
RowBox[{"Entity", "[",
RowBox[{"\"Country\"", ",", "\"UnitedStates\""}], "]"}], "\"Entity[\\\"Country\\\", \\\"UnitedStates\\\"]\"", "\"country\""}, "Entity"], Typeset`allassumptions$$ = {},
Typeset`assumptions$$ = {}, Typeset`open$$ = {1, 2}, Typeset`querystate$$ = {"Online" -> True, "Allowed" -> True, "mparse.jsp" -> 1.534023, "Messages" -> {}}},
DynamicBox[ToBoxes[
AlphaIntegration`LinguisticAssistantBoxes["", 4, Automatic,
Dynamic[Typeset`query$$],
Dynamic[Typeset`boxes$$],
Dynamic[Typeset`allassumptions$$],
Dynamic[Typeset`assumptions$$],
Dynamic[Typeset`open$$],
Dynamic[Typeset`querystate$$]], StandardForm],
ImageSizeCache->{143.1491329656863, {6.86328125, 15.92578125}},
TrackedSymbols:>{Typeset`query$$, Typeset`boxes$$, Typeset`allassumptions$$, Typeset`assumptions$$, Typeset`open$$, Typeset`querystate$$}],
DynamicModuleValues:>{},
UndoTrackedVariables:>{Typeset`open$$}],
BaseStyle->{"Deploy"},
DeleteWithContents->True,
Editable->False,
SelectWithContents->True]\) &]][GroupBy["CandidateName"], GroupBy["ConventionBounce"], All, {"ModelDate", "PctEstimate"}][
All, DateListPlot, Values/*TimeSeries]](https://www.wolframcloud.com/obj/resourcesystem/images/15f/15f9aff5-50a2-4a85-854c-20e49e941cc6/7e08e37884a6e449.png)
![bidentrump[Select[#State === \!\(\*
NamespaceBox["LinguisticAssistant",
DynamicModuleBox[{Typeset`query$$ = "usa", Typeset`boxes$$ = TemplateBox[{"\"United States\"",
RowBox[{"Entity", "[",
RowBox[{"\"Country\"", ",", "\"UnitedStates\""}], "]"}], "\"Entity[\\\"Country\\\", \\\"UnitedStates\\\"]\"", "\"country\""}, "Entity"], Typeset`allassumptions$$ = {},
Typeset`assumptions$$ = {}, Typeset`open$$ = {1, 2}, Typeset`querystate$$ = {"Online" -> True, "Allowed" -> True, "mparse.jsp" -> 1.534023, "Messages" -> {}}},
DynamicBox[ToBoxes[
AlphaIntegration`LinguisticAssistantBoxes["", 4, Automatic,
Dynamic[Typeset`query$$],
Dynamic[Typeset`boxes$$],
Dynamic[Typeset`allassumptions$$],
Dynamic[Typeset`assumptions$$],
Dynamic[Typeset`open$$],
Dynamic[Typeset`querystate$$]], StandardForm],
ImageSizeCache->{143.1491329656863, {6.86328125, 15.92578125}},
TrackedSymbols:>{Typeset`query$$, Typeset`boxes$$, Typeset`allassumptions$$, Typeset`assumptions$$, Typeset`open$$, Typeset`querystate$$}],
DynamicModuleValues:>{},
UndoTrackedVariables:>{Typeset`open$$}],
BaseStyle->{"Deploy"},
DeleteWithContents->True,
Editable->False,
SelectWithContents->True]\) && ! #ConventionBounce &]][
GroupBy["CandidateName"], All, {"ModelDate", "PctEstimate"}][DateListPlot, Values/*TimeSeries]](https://www.wolframcloud.com/obj/resourcesystem/images/15f/15f9aff5-50a2-4a85-854c-20e49e941cc6/23a37e2d1a44df4d.png)