Wolfram Function Repository
Instant-use add-on functions for the Wolfram Language
Function Repository Resource:
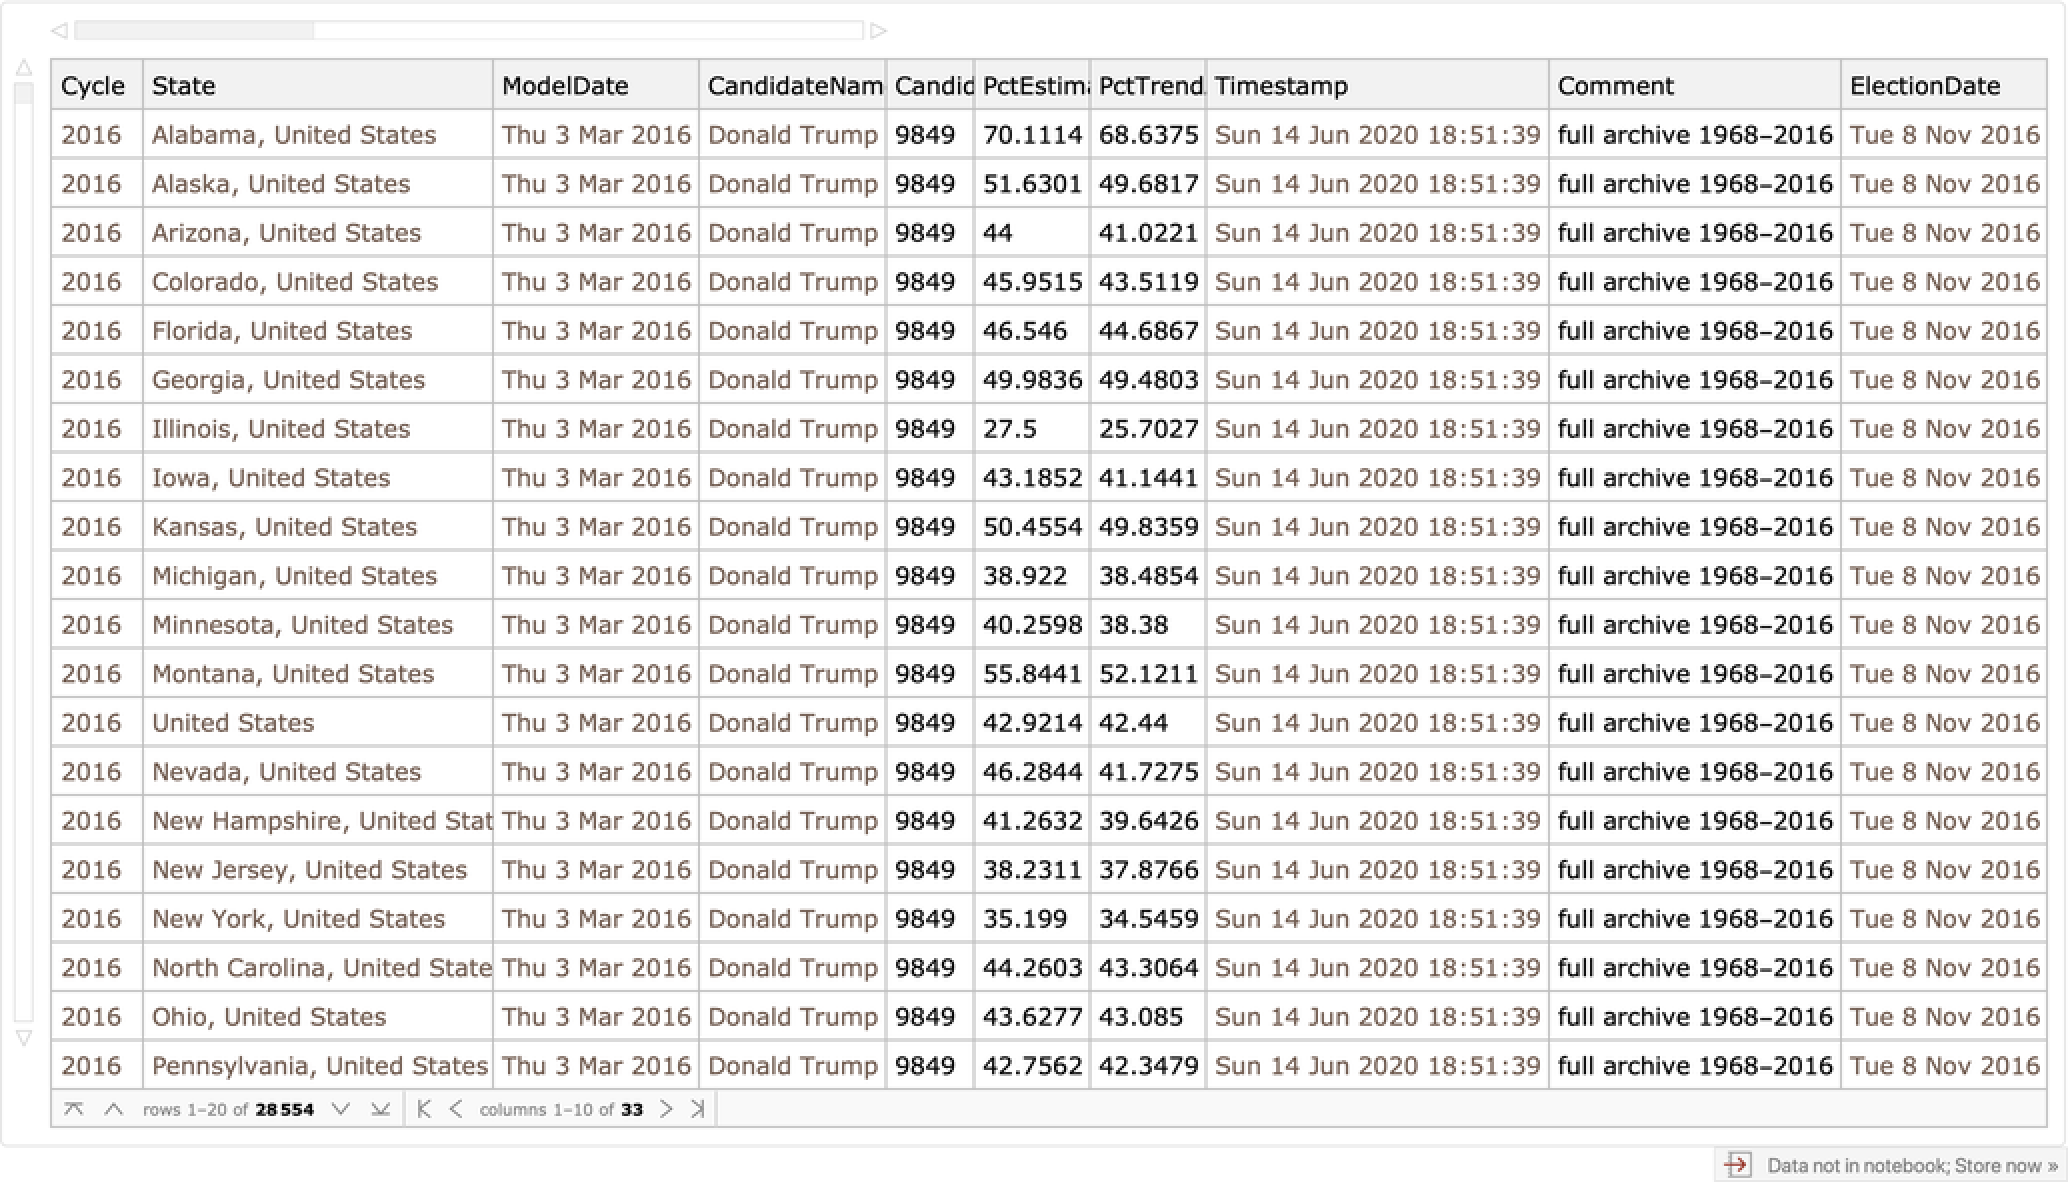
Import polling data on presidential elections from the website FiveThirtyEight
ResourceFunction["FiveThirtyEightPresidentialPollingAverages"][yr] imports presidential polling data from fivethirtyeight.com for the for the specified election year yr. | |
ResourceFunction["FiveThirtyEightPresidentialPollingAverages"][{yr1,yr2,…}] combines data from several election years. |
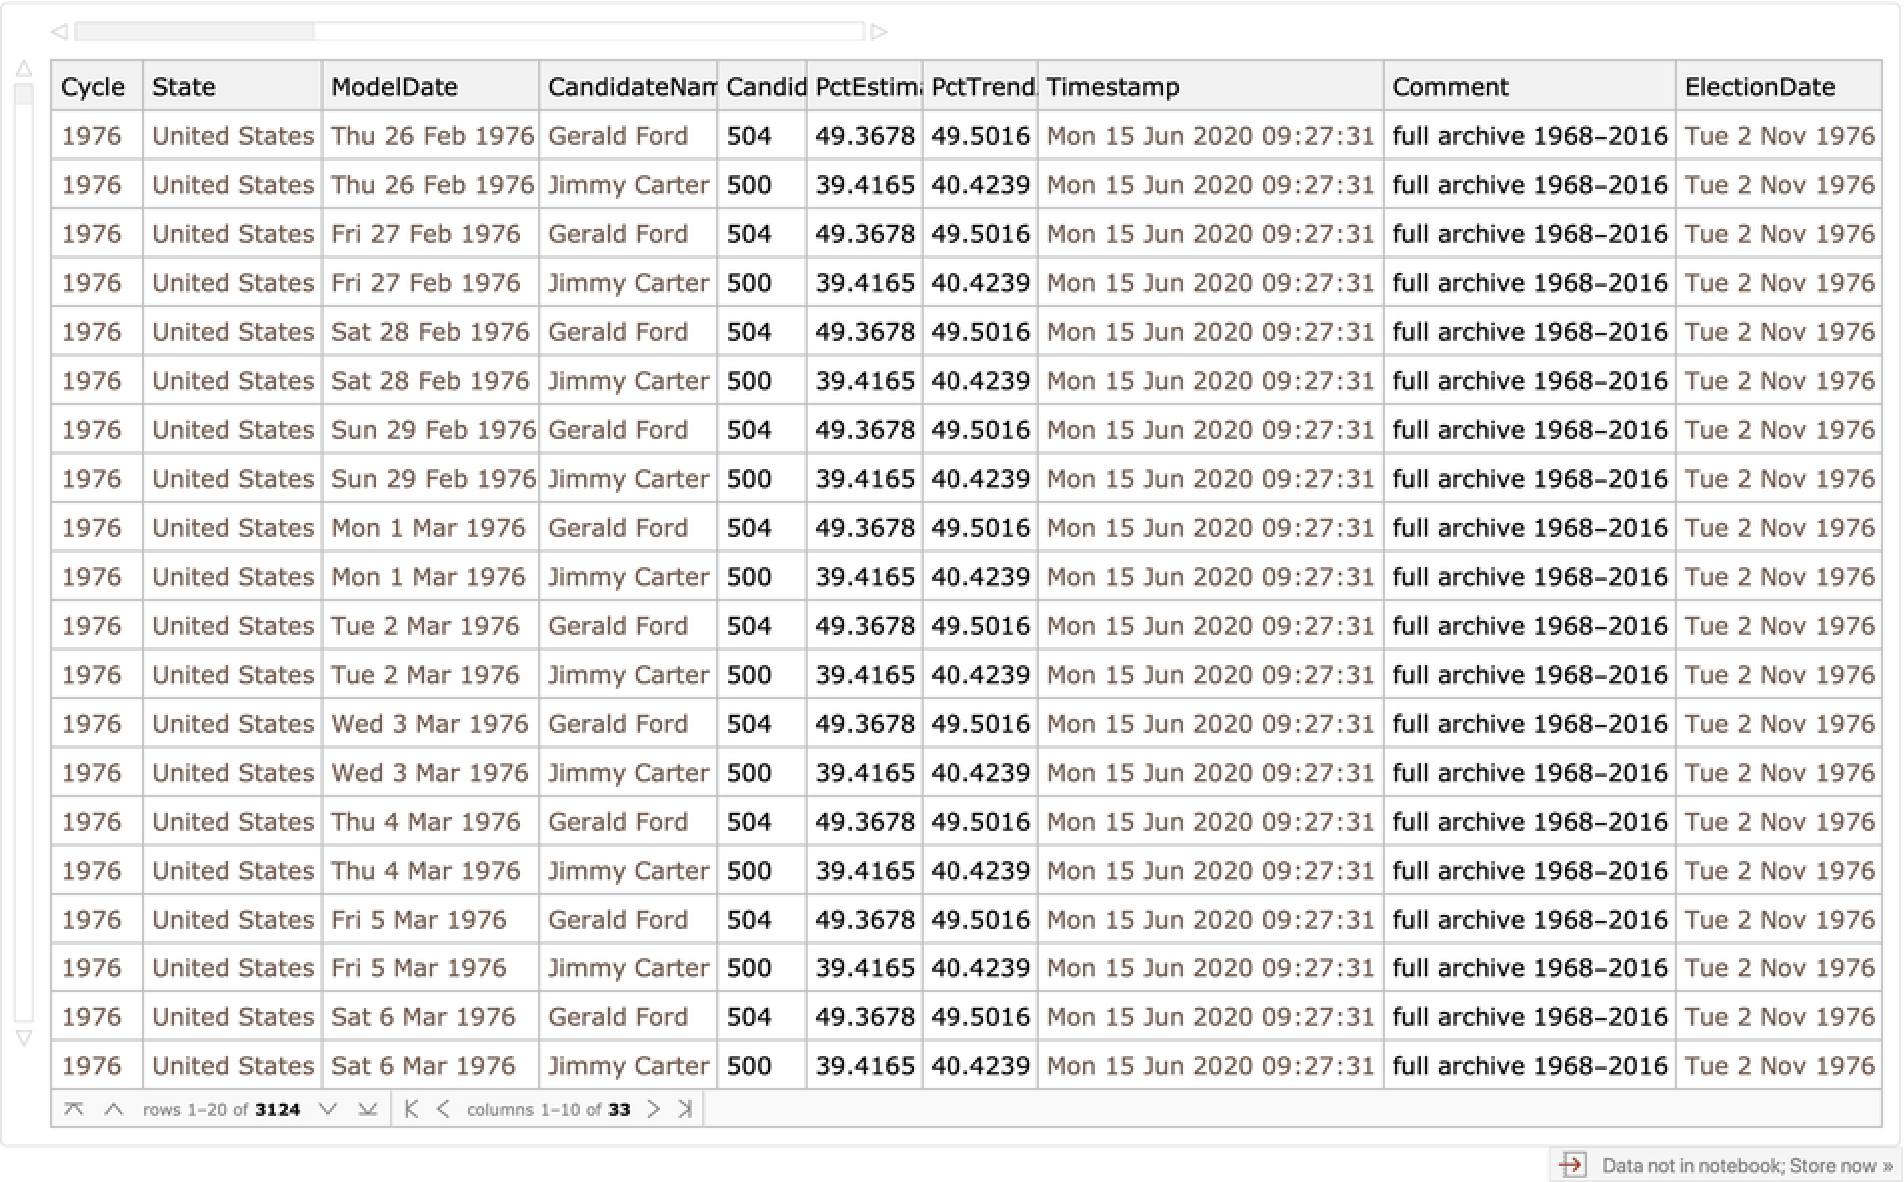
Get polling data for the 1976 US presidential election from fivethirtyeight.com:
| In[1]:= |
|
| Out[1]= |
|
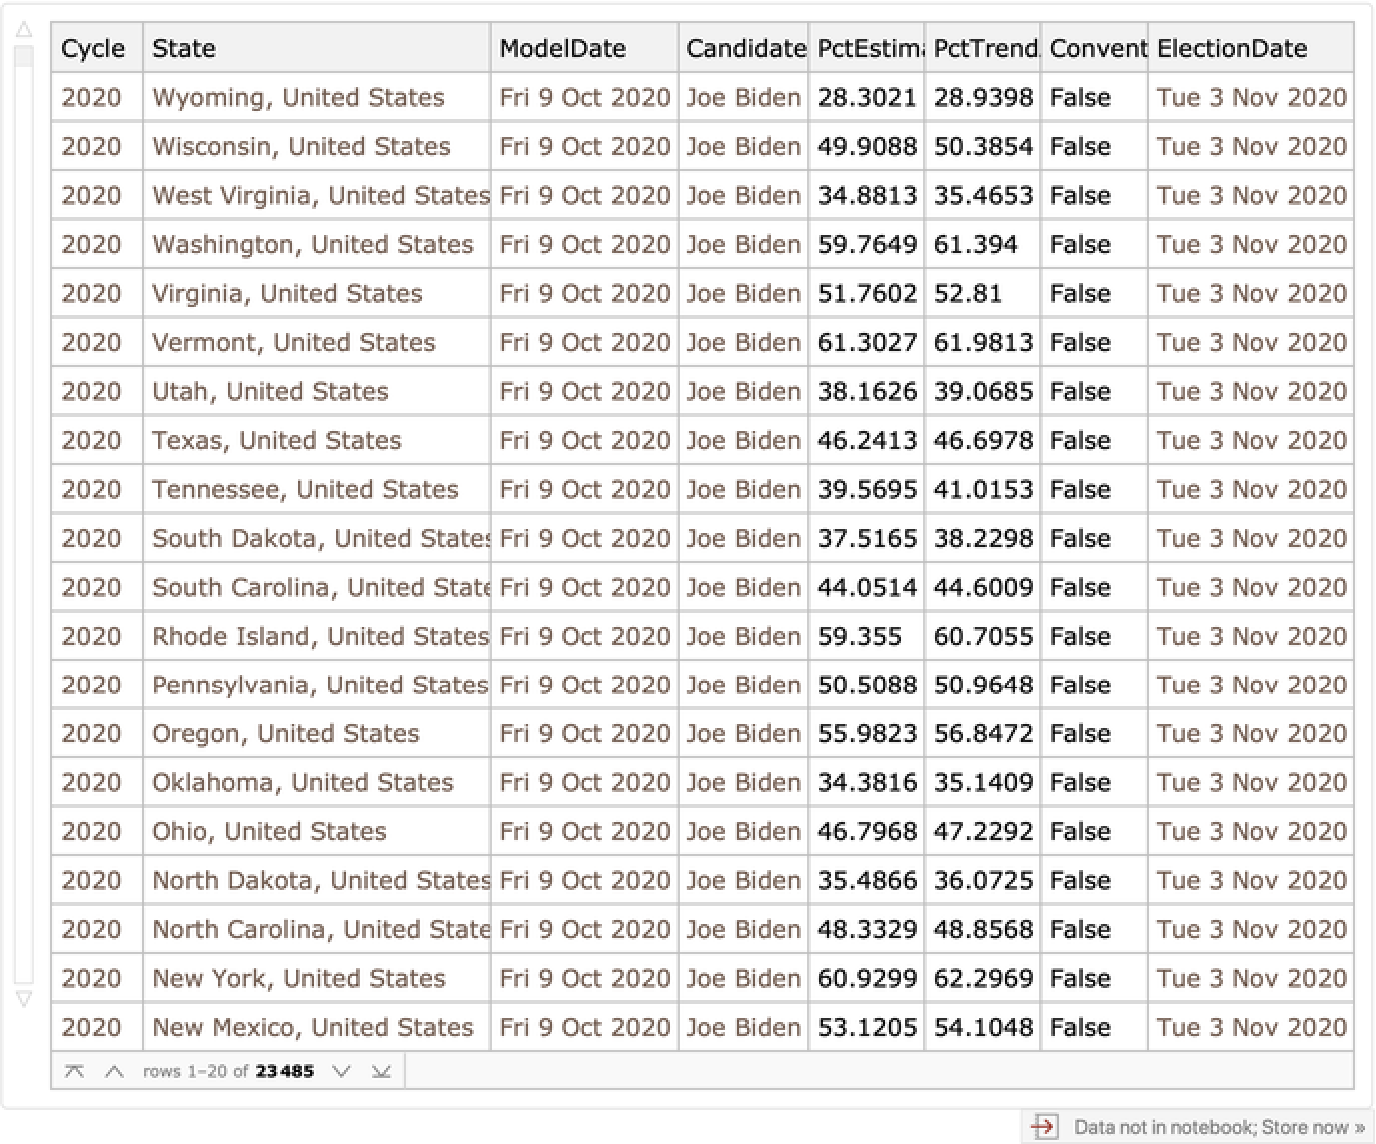
Retrieve polling data for the 2020 election cycle:
| In[2]:= |
|
| Out[2]= |
|
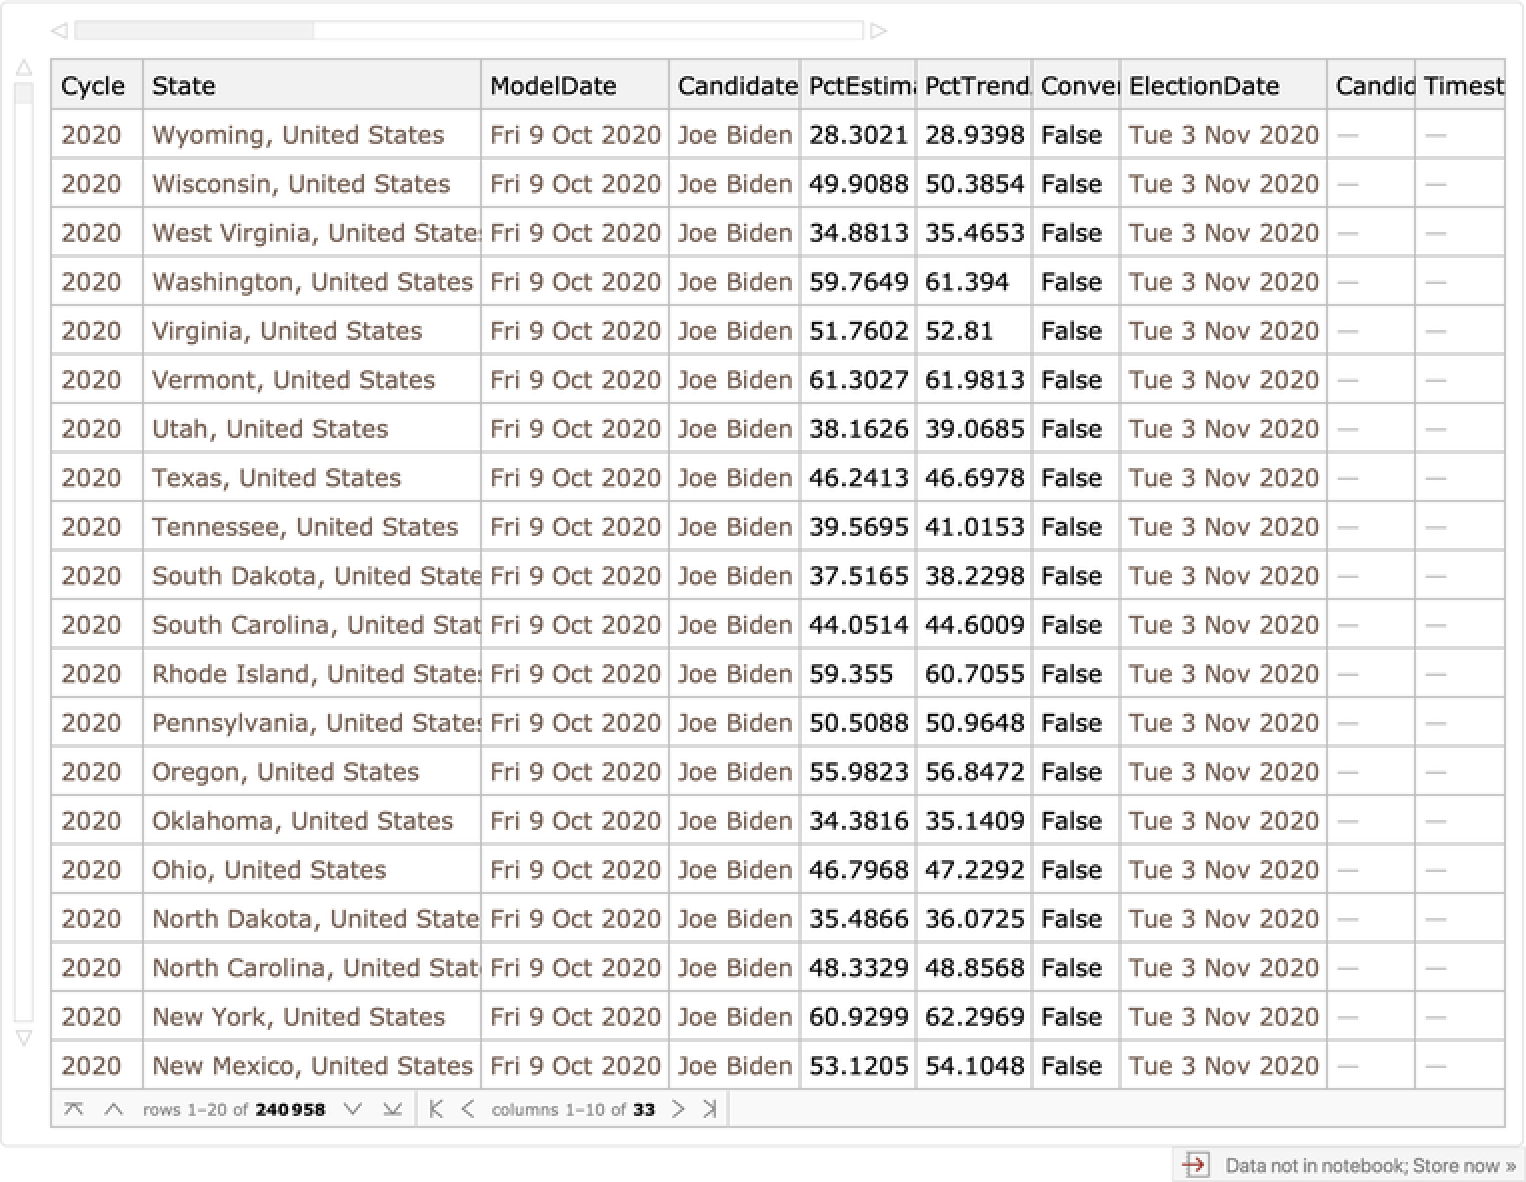
Get all polling data:
| In[3]:= |
|
| Out[3]= |
|
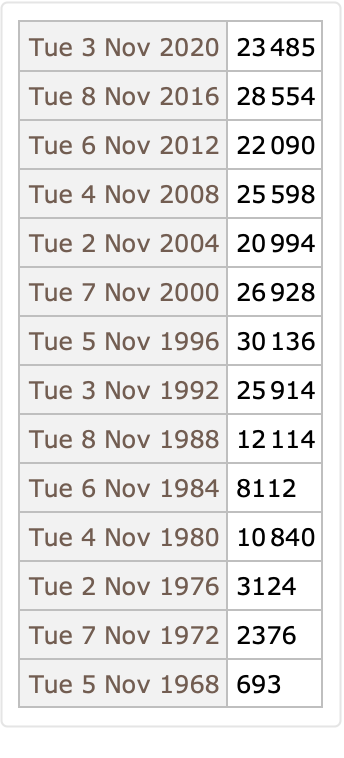
See the included elections dates:
| In[4]:= |
|
| Out[4]= |
|
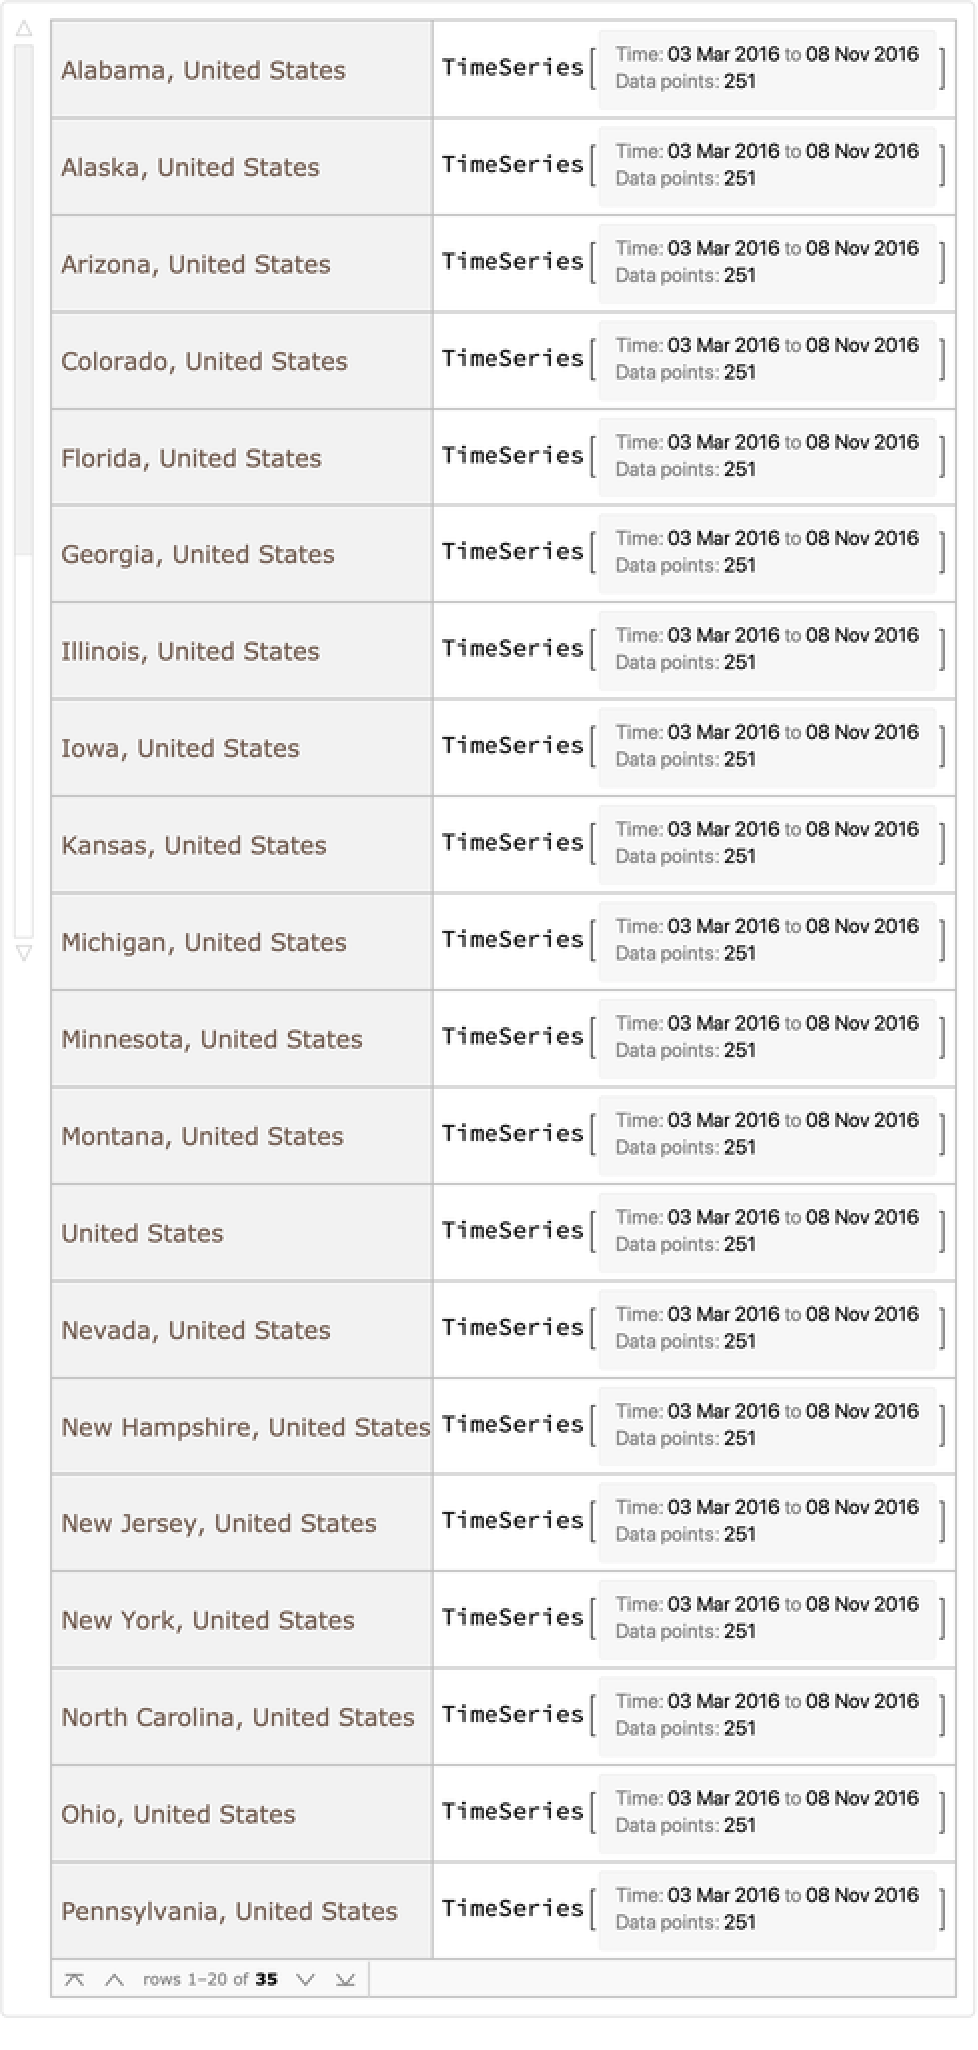
See the number of statewide averages for each state or region:
| In[5]:= |
|
| Out[5]= |
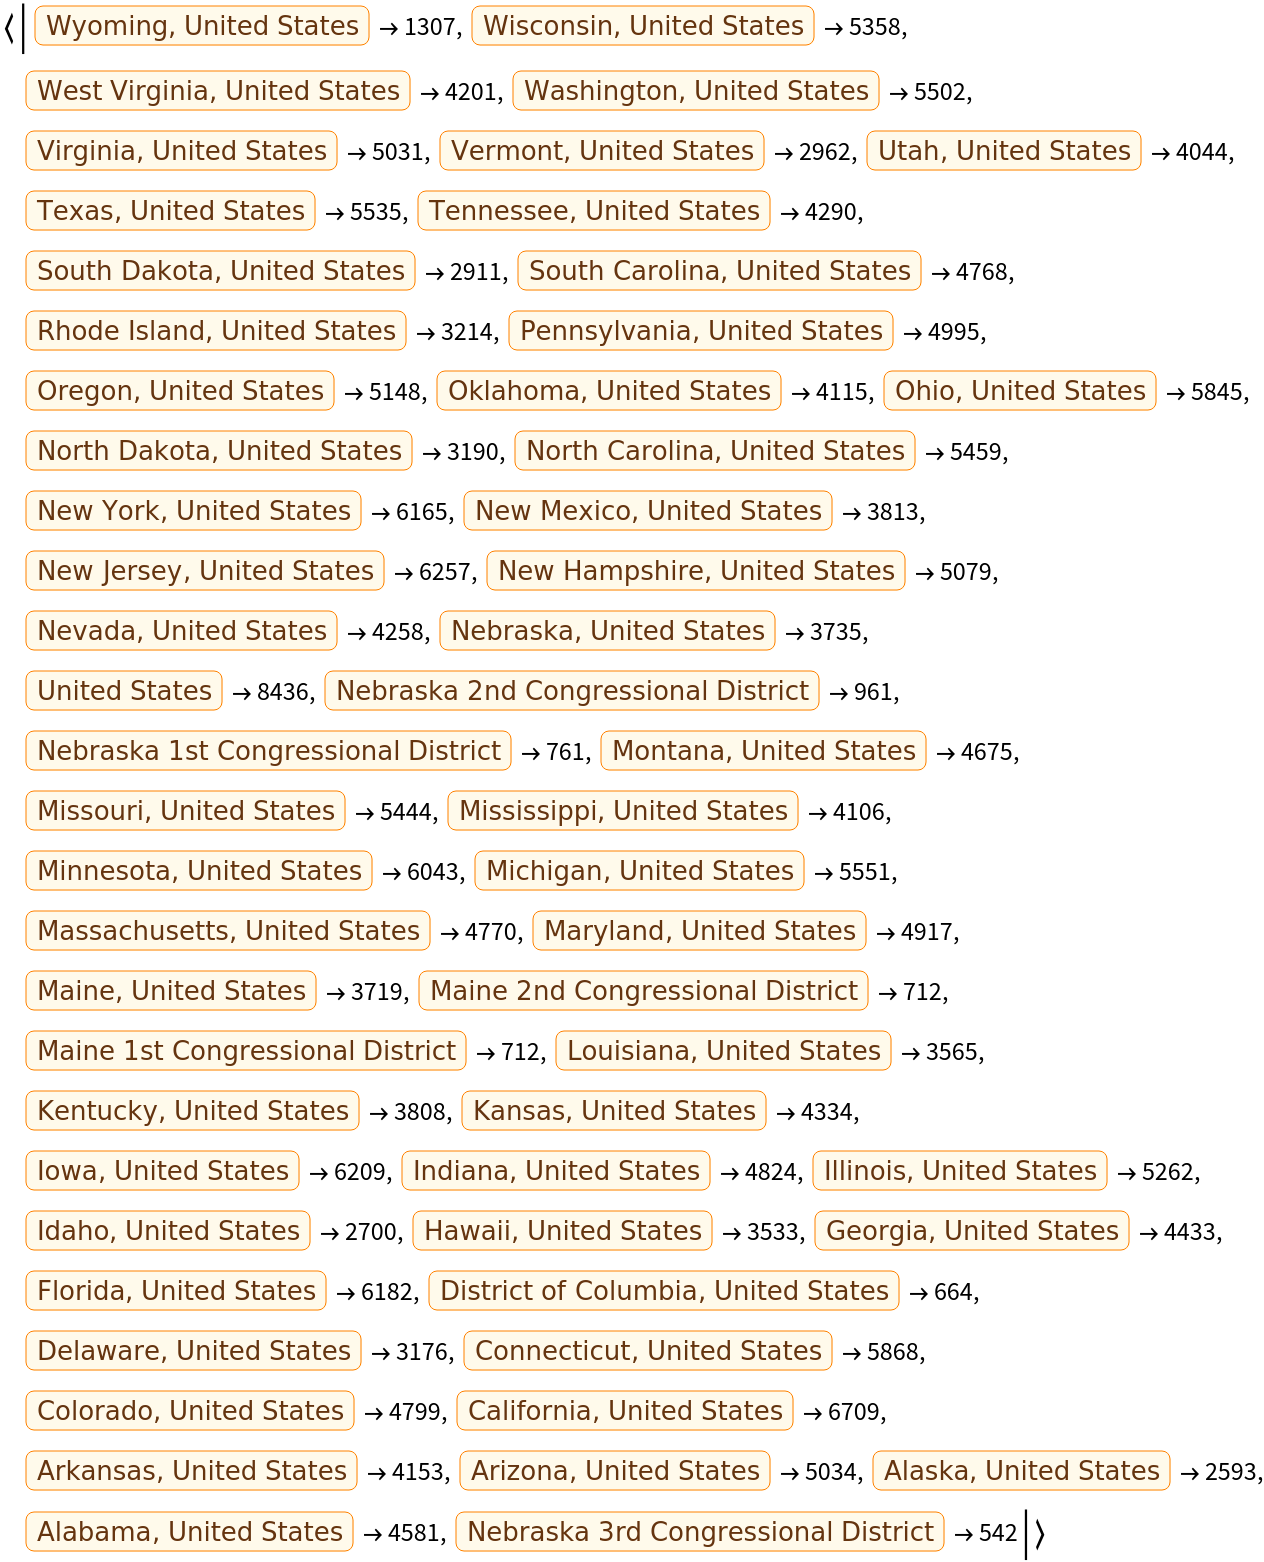
|
Use a DateObject to specify the date:
| In[6]:= |
|
| Out[6]= |
|
Get data for two elections:
| In[7]:= |
|
| Out[7]= |
|
| In[8]:= |
|
| Out[8]= |
|
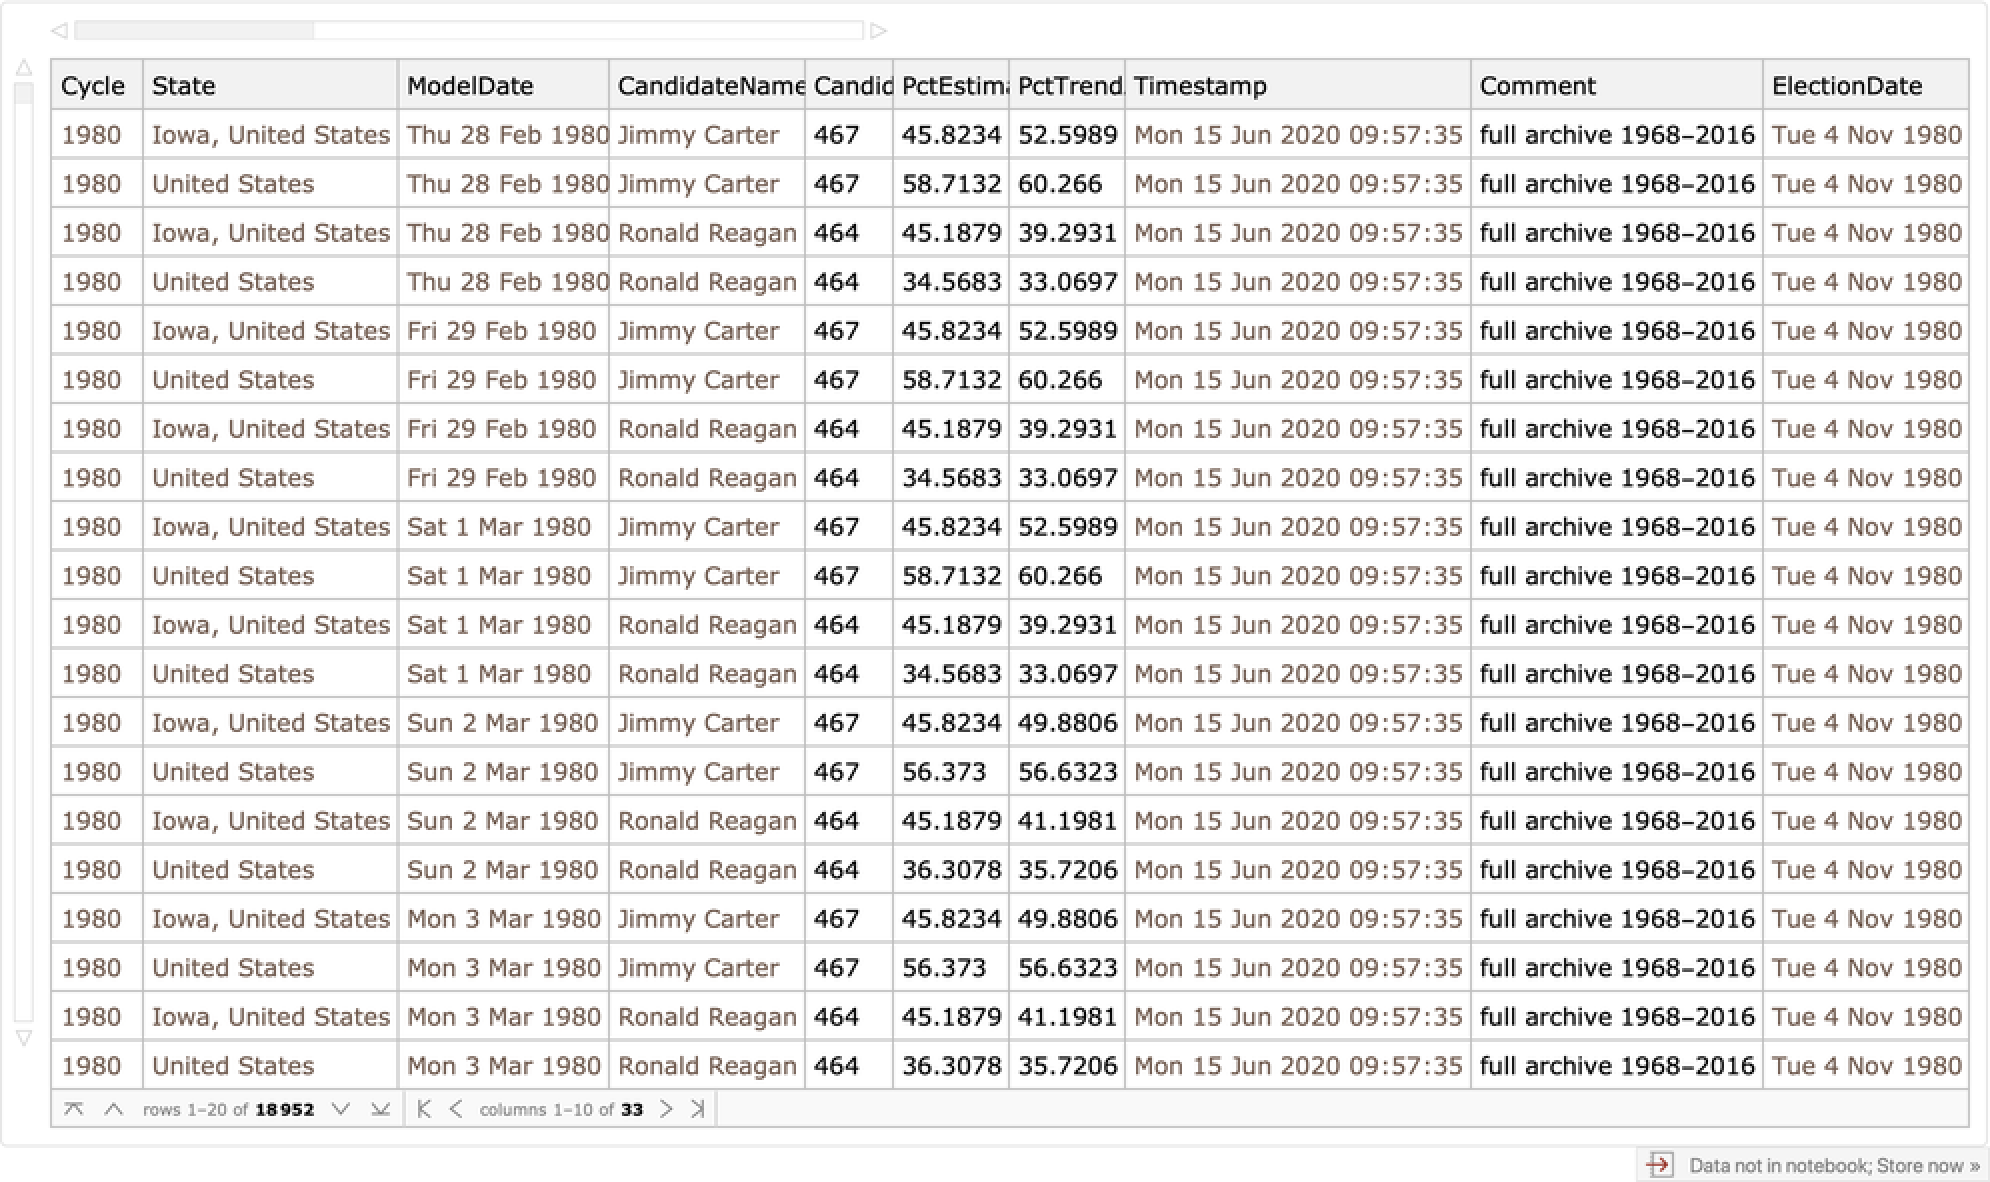
Get all polling data without the current election cycle using "Historic":
| In[9]:= |
|
| Out[9]= |

|
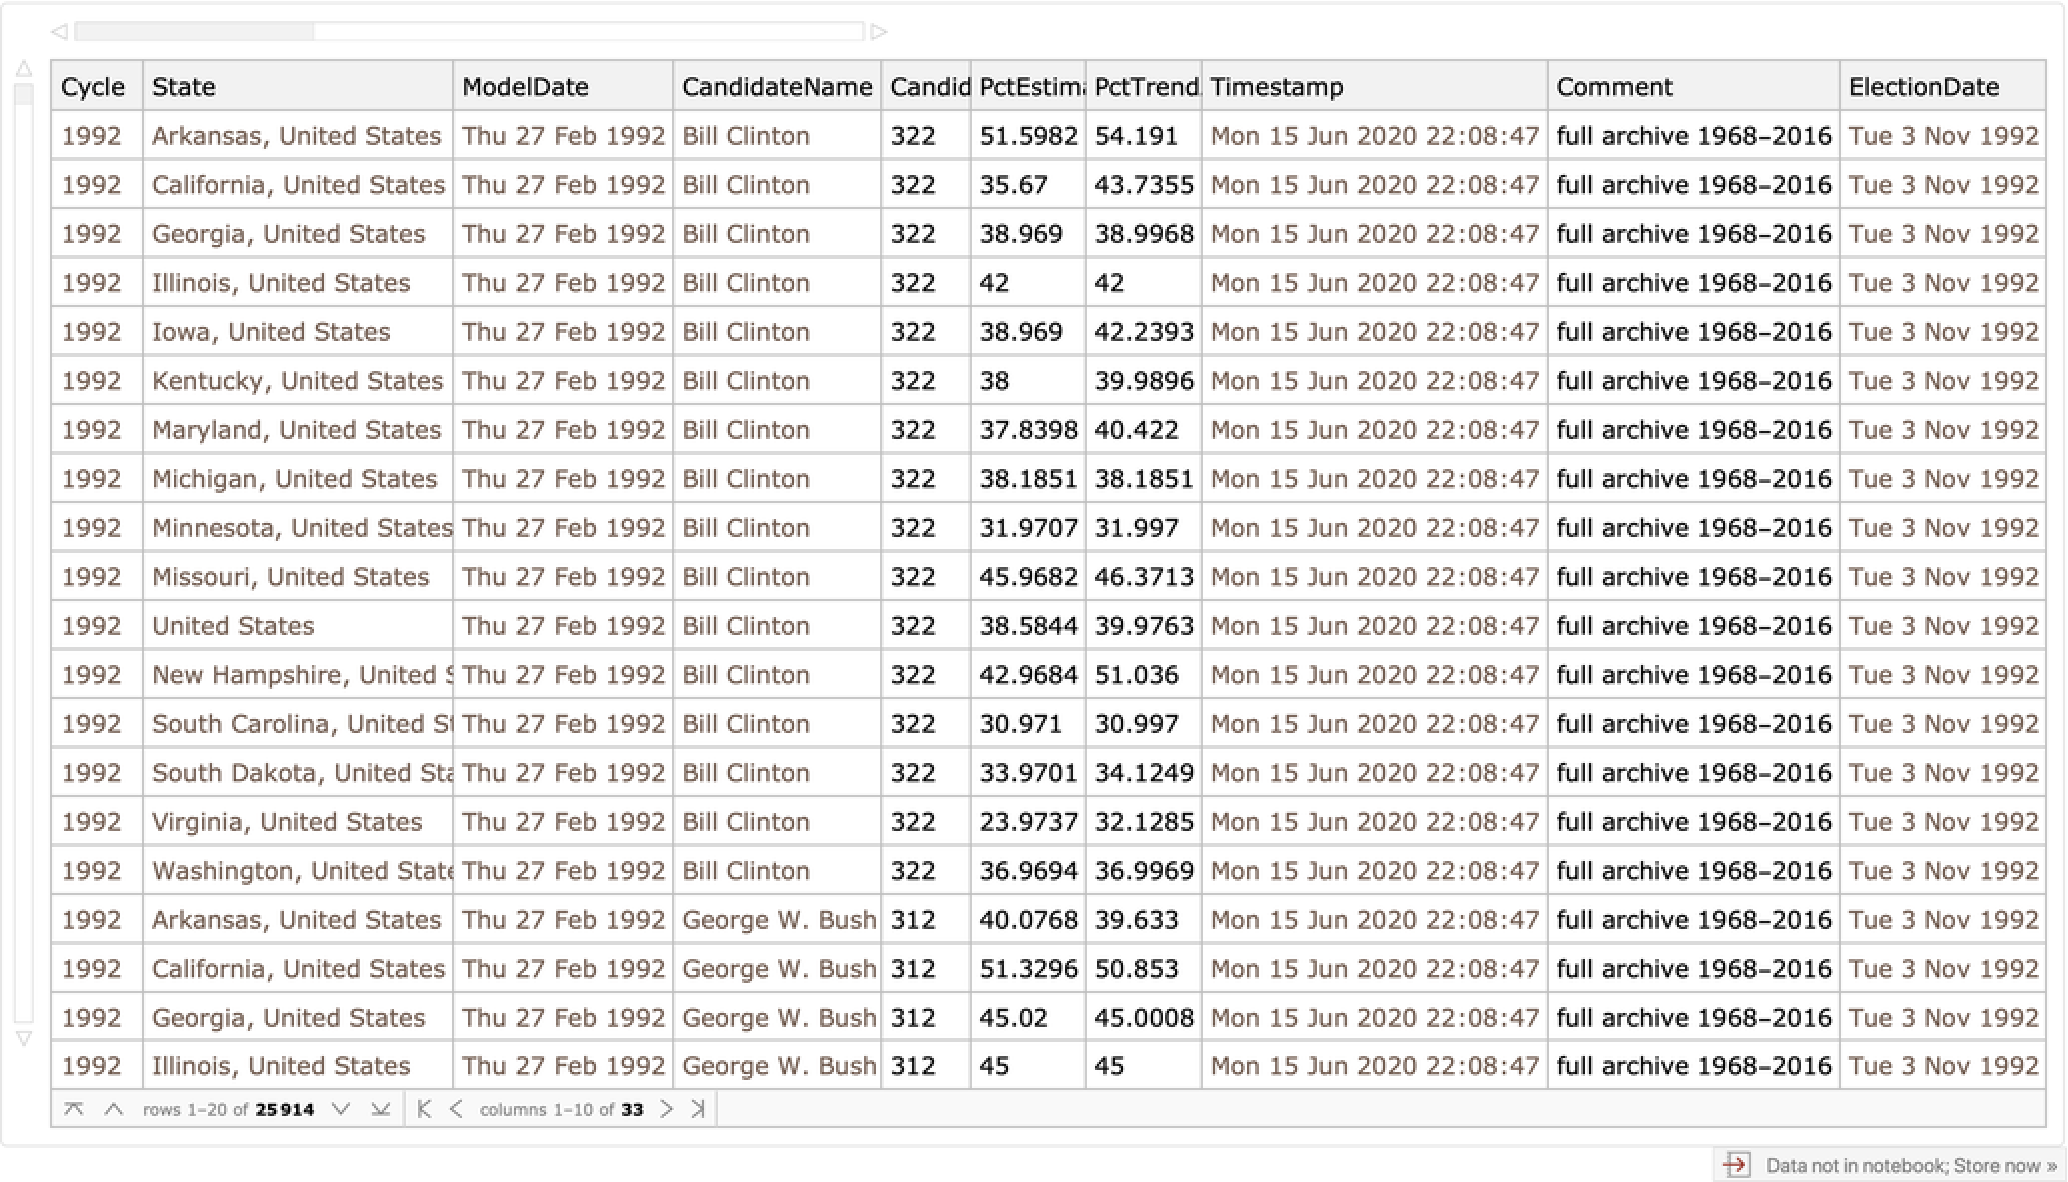
Select data from just one election:
| In[10]:= |
|
| Out[10]= |
|
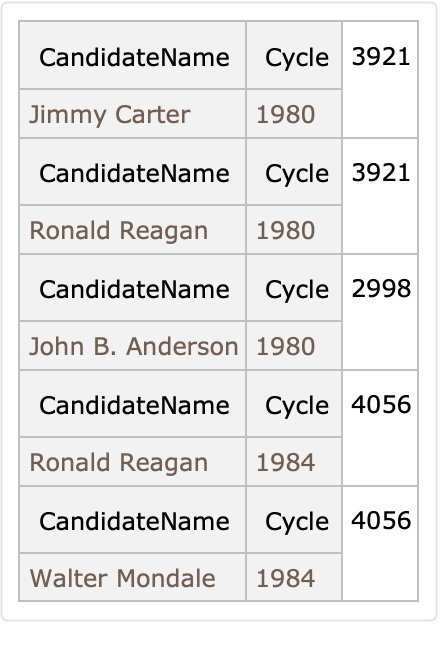
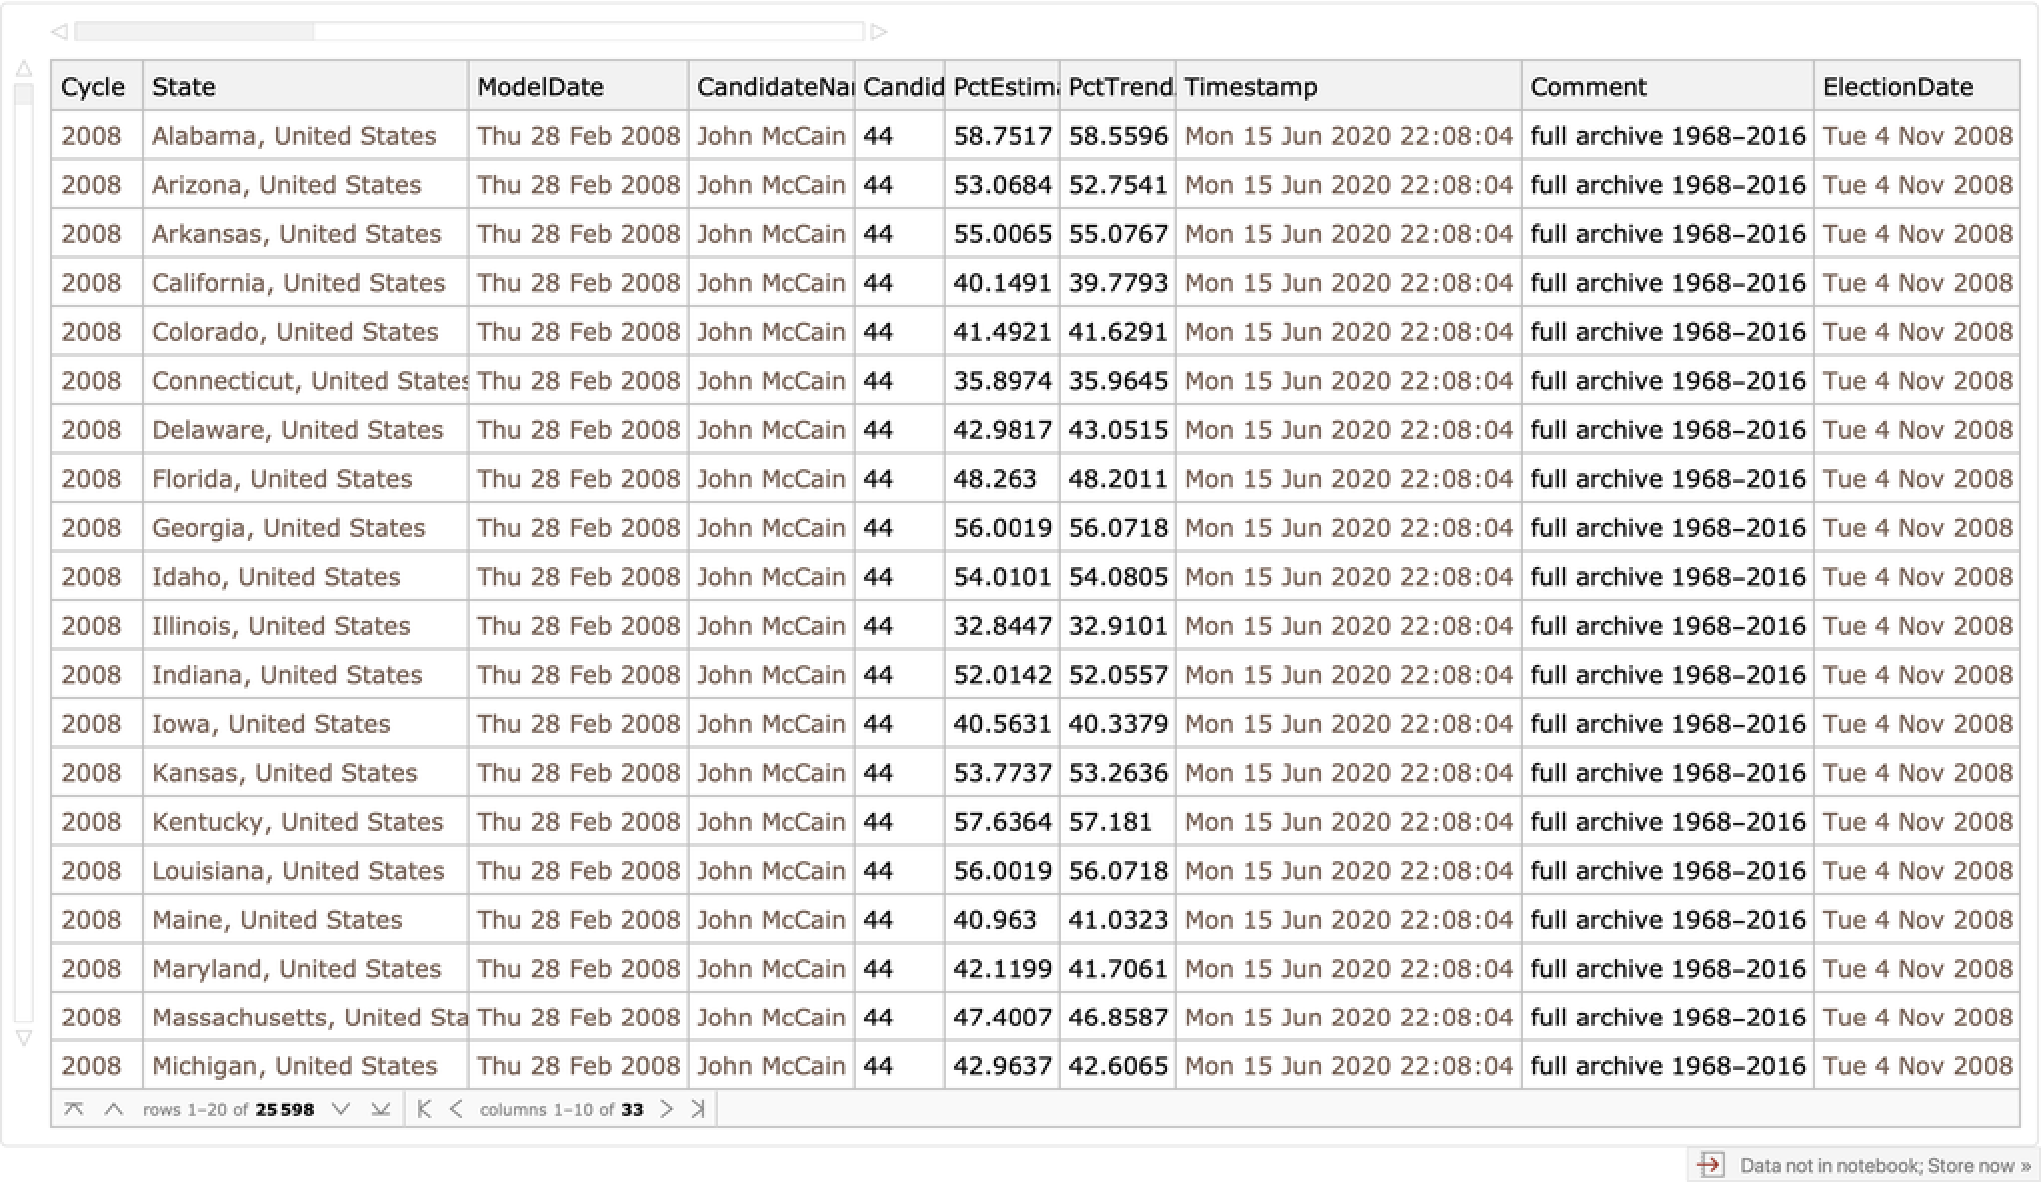
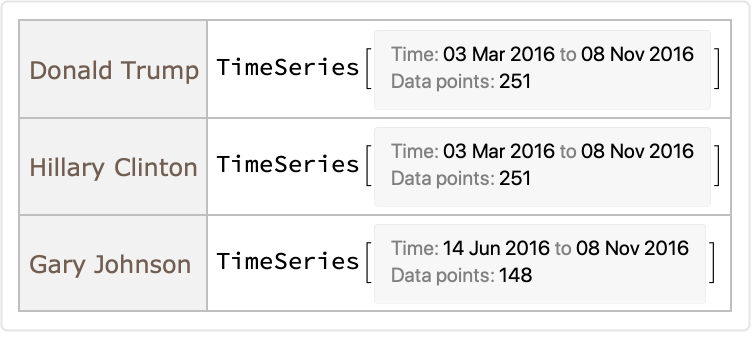
See the candidates:
| In[11]:= |
|
| Out[11]= |
|
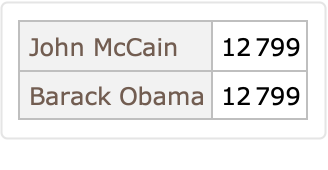
Get the last result for each state:
| In[12]:= |
|
| Out[12]= |
|
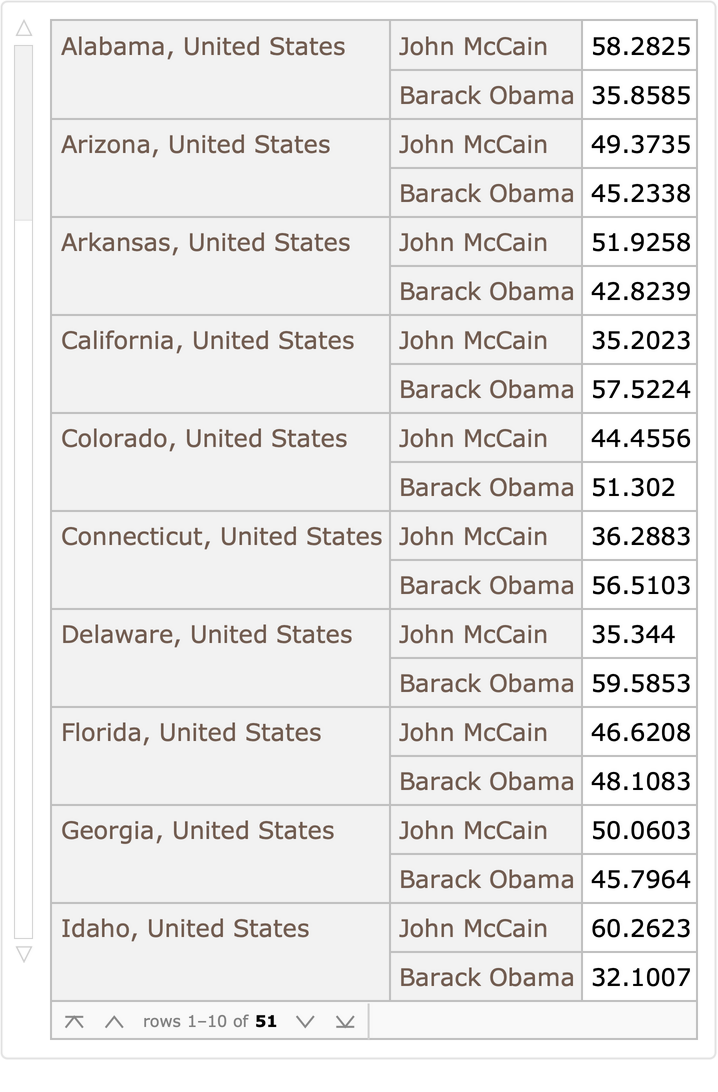
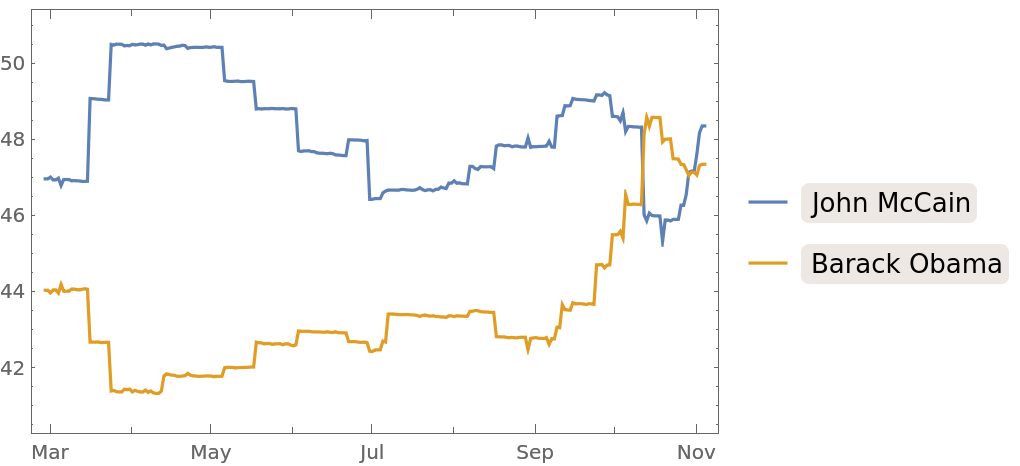
Calculate the estimated difference in support between the two candidates:
| In[13]:= |
|
| Out[13]= |
|
Calculate timeline plots for each state:
| In[14]:= |
![timelines = oneelection[GroupBy["State"], GroupBy["CandidateName"], All, {"ModelDate", "PctEstimate"}][All, DateListPlot, Values /* TimeSeries];
timelines[
Entity["AdministrativeDivision", {"Missouri", "UnitedStates"}]]](https://www.wolframcloud.com/obj/resourcesystem/images/15f/15f9aff5-50a2-4a85-854c-20e49e941cc6/3-0-0/6da7fe3ca5982256.png)
|
| Out[15]= |
|
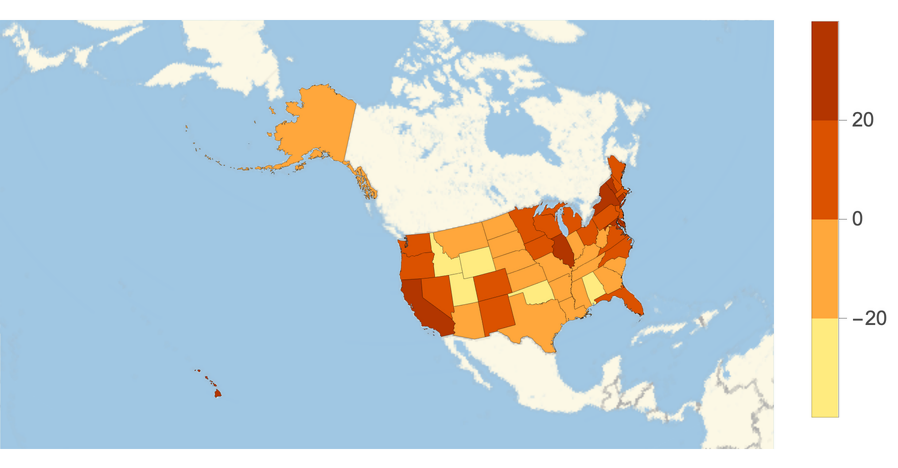
Create a map of the support difference which shows the timelines when hovered:
| In[16]:= |
![GeoRegionValuePlot[
MapThread[
Tooltip[#1[[1]], #2] -> #1[[2]] &, {Normal[
Normal[KeyDrop[diffbystate, Entity["Country", "UnitedStates"]]]], Normal@Values[
KeyDrop[timelines, Entity["Country", "UnitedStates"]]]}]]](https://www.wolframcloud.com/obj/resourcesystem/images/15f/15f9aff5-50a2-4a85-854c-20e49e941cc6/3-0-0/66e574f762cde06c.png)
|
| Out[16]= |
|
Get data for another election:
| In[17]:= |
|
| Out[17]= |
|
Create time series data for each state:
| In[18]:= |
![timeseries = oneelection[GroupBy["State"], GroupBy["CandidateName"], All, {"ModelDate", "PctEstimate"}][All, All, Values /* TimeSeries];
RandomChoice[timeseries]](https://www.wolframcloud.com/obj/resourcesystem/images/15f/15f9aff5-50a2-4a85-854c-20e49e941cc6/3-0-0/547fb64436942170.png)
|
| Out[19]= |
|
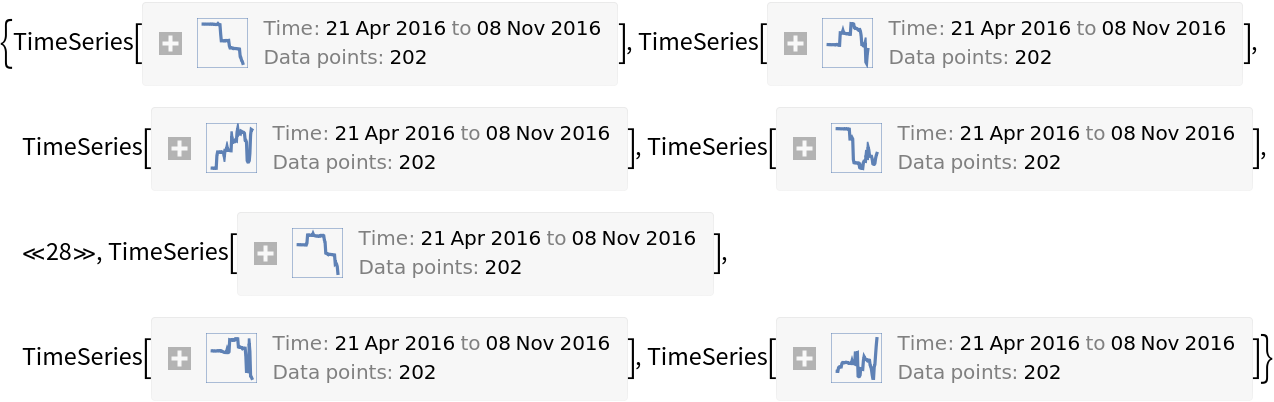
Get the difference in support between the top two candidates over time for each state with over two hundred estimates:
| In[20]:= |
|
| Out[20]= |
|
Create a list of TimeSeries with samples over the smallest common range:
| In[21]:= |
|
| Out[21]= |
|
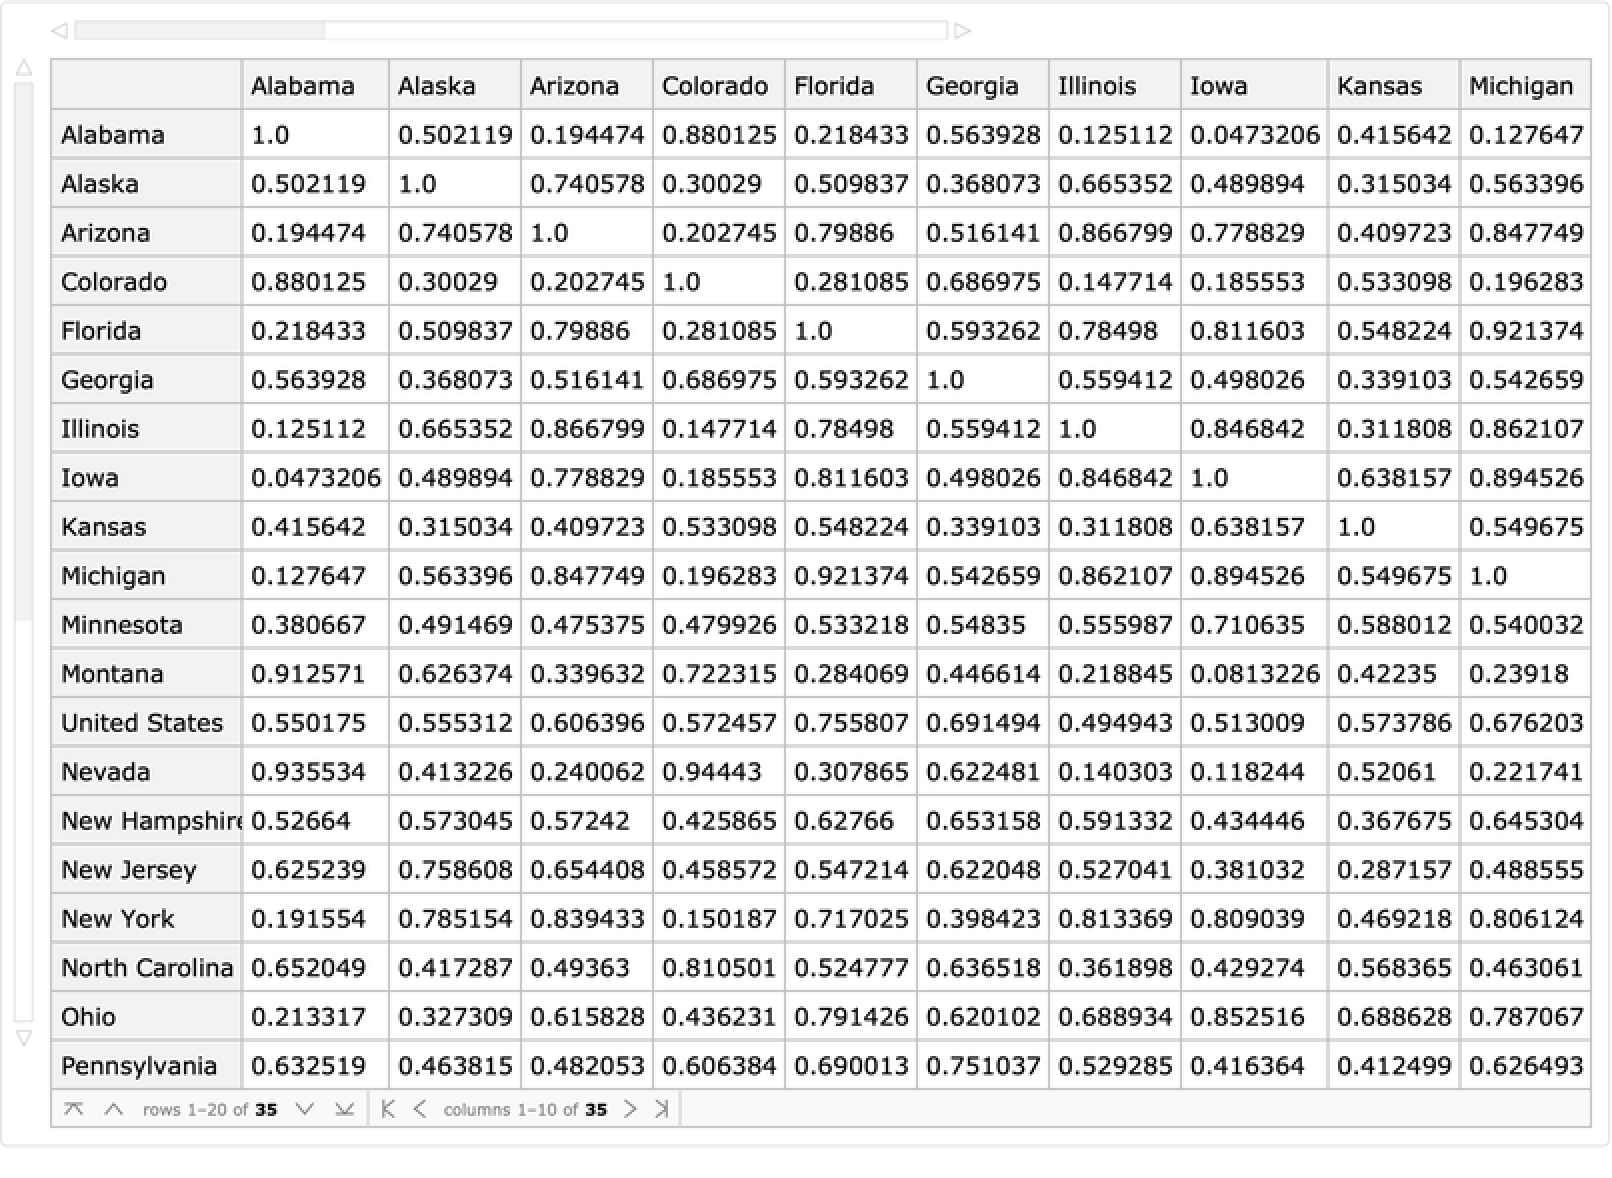
Calculate the correlations between states:
| In[22]:= |
|
| Out[23]= |
|
See the results:
| In[24]:= |
![states = StringDelete[CommonName /@ Normal[Keys[diffsbystate]], ", United States"];
ResourceFunction["DatasetForm"][
AssociationThread[
states -> (AssociationThread[states -> #] & /@ corr)]]](https://www.wolframcloud.com/obj/resourcesystem/images/15f/15f9aff5-50a2-4a85-854c-20e49e941cc6/3-0-0/75f359f66fc8392b.png)
|
| Out[25]= |
|
Visualize it:
| In[26]:= |
![Grid[ MapIndexed[
Item[Tooltip[Graphics[], states[[#2]]], Background -> ColorData["TemperatureMap"][#1]] &, corr, {2}], Spacings -> 0, ItemSize -> .5, Frame -> None]](https://www.wolframcloud.com/obj/resourcesystem/images/15f/15f9aff5-50a2-4a85-854c-20e49e941cc6/3-0-0/1ee4570e5ca7b1ba.png)
|
| Out[254]= |

|
The 2020 data includes numbers adjusted for convention bounces:
| In[255]:= |
|
| Out[256]= |
|
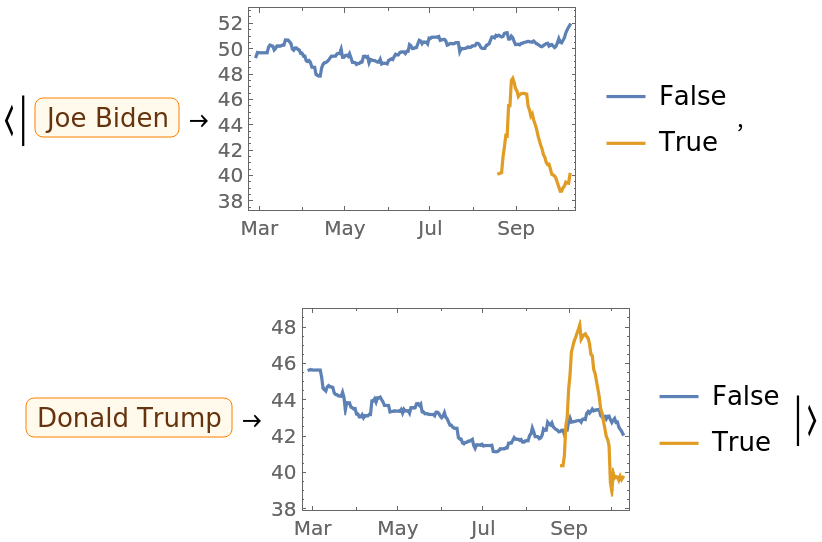
The bounce-adjusted numbers differ considerably from the standard average:
| In[257]:= |
![Normal@bidentrump[Select[#State === \!\(\*
NamespaceBox["LinguisticAssistant",
DynamicModuleBox[{Typeset`query$$ = "usa", Typeset`boxes$$ = TemplateBox[{"\"United States\"",
RowBox[{"Entity", "[",
RowBox[{"\"Country\"", ",", "\"UnitedStates\""}], "]"}], "\"Entity[\\\"Country\\\", \\\"UnitedStates\\\"]\"", "\"country\""}, "Entity"], Typeset`allassumptions$$ = {},
Typeset`assumptions$$ = {}, Typeset`open$$ = {1, 2}, Typeset`querystate$$ = {
"Online" -> True, "Allowed" -> True, "mparse.jsp" -> 1.534023, "Messages" -> {}}},
DynamicBox[ToBoxes[
AlphaIntegration`LinguisticAssistantBoxes["", 4, Automatic,
Dynamic[Typeset`query$$],
Dynamic[Typeset`boxes$$],
Dynamic[Typeset`allassumptions$$],
Dynamic[Typeset`assumptions$$],
Dynamic[Typeset`open$$],
Dynamic[Typeset`querystate$$]], StandardForm],
ImageSizeCache->{182., {7., 17.}},
TrackedSymbols:>{
Typeset`query$$, Typeset`boxes$$, Typeset`allassumptions$$, Typeset`assumptions$$, Typeset`open$$, Typeset`querystate$$}],
DynamicModuleValues:>{},
UndoTrackedVariables:>{Typeset`open$$}],
BaseStyle->{"Deploy"},
DeleteWithContents->True,
Editable->False,
SelectWithContents->True]\) &]][GroupBy["CandidateName"], GroupBy["ConventionBounce"], All, {"ModelDate", "PctEstimate"}][
All, DateListPlot, Values /* TimeSeries]](https://www.wolframcloud.com/obj/resourcesystem/images/15f/15f9aff5-50a2-4a85-854c-20e49e941cc6/3-0-0/027abffffd59d085.png)
|
| Out[257]= |
|
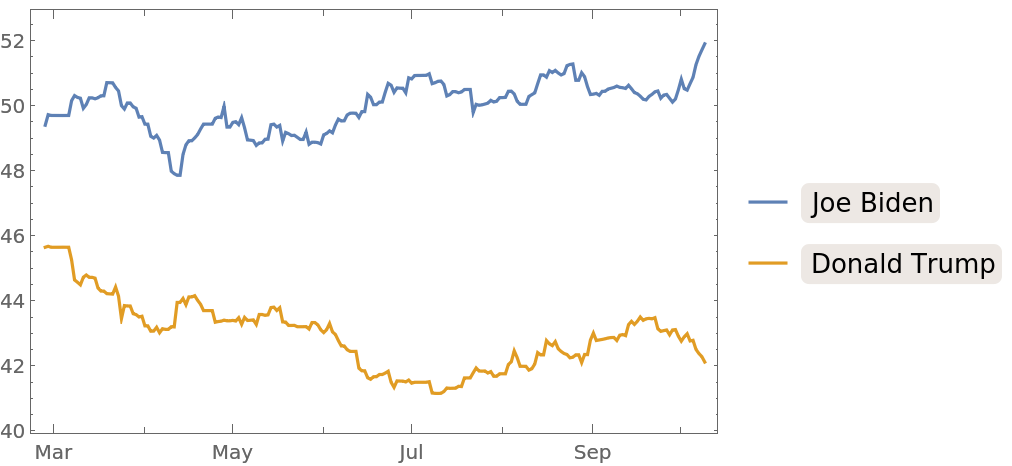
Use only non-bounce-adjusted values instead:
| In[258]:= |
![bidentrump[Select[#State === \!\(\*
NamespaceBox["LinguisticAssistant",
DynamicModuleBox[{Typeset`query$$ = "usa", Typeset`boxes$$ = TemplateBox[{"\"United States\"",
RowBox[{"Entity", "[",
RowBox[{"\"Country\"", ",", "\"UnitedStates\""}], "]"}], "\"Entity[\\\"Country\\\", \\\"UnitedStates\\\"]\"", "\"country\""}, "Entity"], Typeset`allassumptions$$ = {},
Typeset`assumptions$$ = {}, Typeset`open$$ = {1, 2}, Typeset`querystate$$ = {
"Online" -> True, "Allowed" -> True, "mparse.jsp" -> 1.534023, "Messages" -> {}}},
DynamicBox[ToBoxes[
AlphaIntegration`LinguisticAssistantBoxes["", 4, Automatic,
Dynamic[Typeset`query$$],
Dynamic[Typeset`boxes$$],
Dynamic[Typeset`allassumptions$$],
Dynamic[Typeset`assumptions$$],
Dynamic[Typeset`open$$],
Dynamic[Typeset`querystate$$]], StandardForm],
ImageSizeCache->{182., {7., 17.}},
TrackedSymbols:>{
Typeset`query$$, Typeset`boxes$$, Typeset`allassumptions$$, Typeset`assumptions$$, Typeset`open$$, Typeset`querystate$$}],
DynamicModuleValues:>{},
UndoTrackedVariables:>{Typeset`open$$}],
BaseStyle->{"Deploy"},
DeleteWithContents->True,
Editable->False,
SelectWithContents->True]\) && ! #ConventionBounce &]][
GroupBy["CandidateName"], All, {"ModelDate", "PctEstimate"}][DateListPlot, Values /* TimeSeries]](https://www.wolframcloud.com/obj/resourcesystem/images/15f/15f9aff5-50a2-4a85-854c-20e49e941cc6/3-0-0/78f33ae73ae5302e.png)
|
| Out[258]= |
|
This work is licensed under a Creative Commons Attribution 4.0 International License